MARGO - Multiproxy Approach for the Reconstruction of the Glacial Ocean surface
Launch |
|
|
|
Synthesis |
|
|
|
|
|
|
1999 |
2002 |
2005 |
2006 |
2009 |
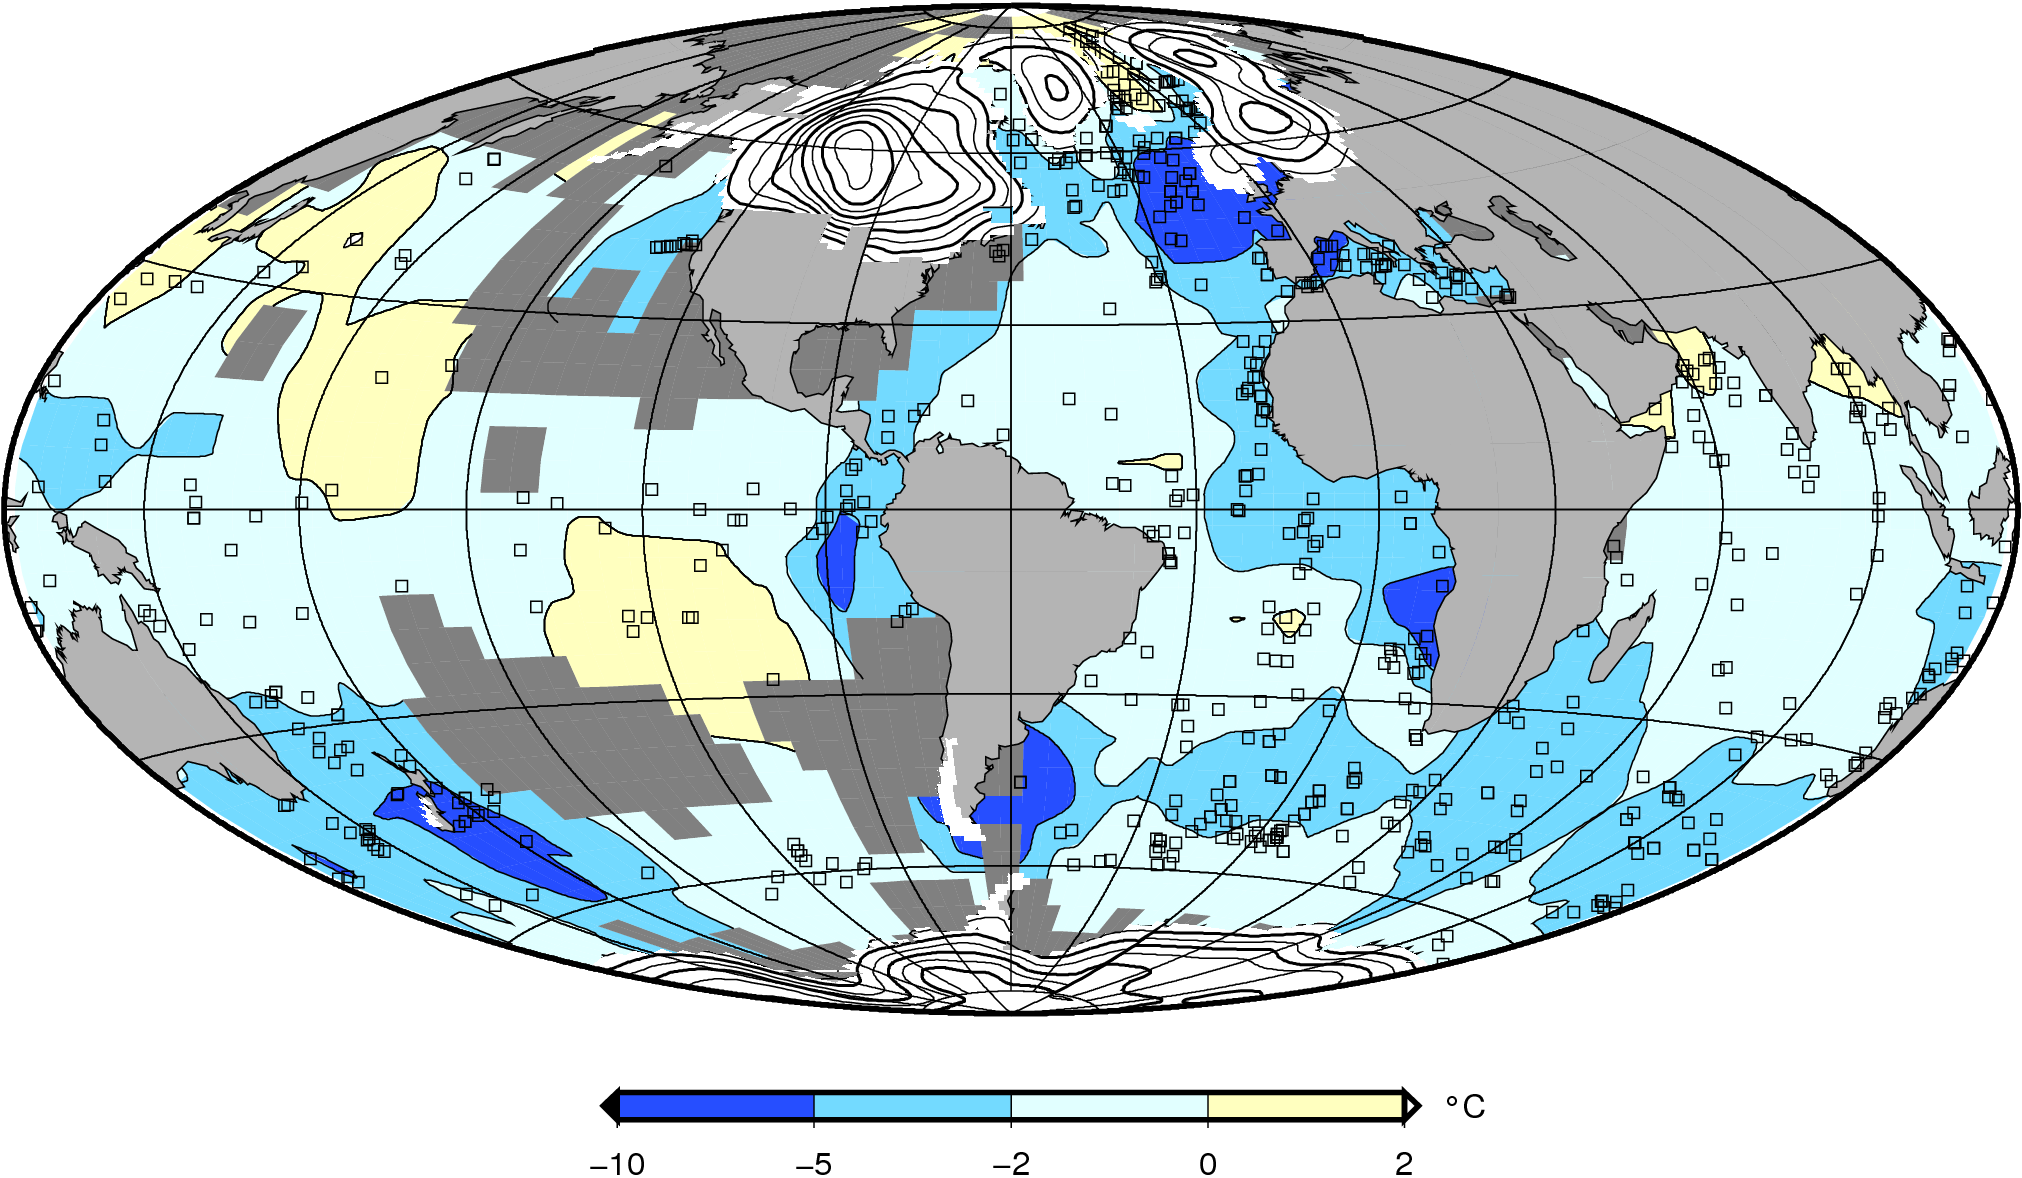
This map shows the reconstructed LGM sea-surface temperature anomaly, computed as the difference between the Last Glacial Maximum (LGM, between 19,000 and 23,000 years before present) and present day, in units of °C for the Northern Hemisphere winter season (January-February-March). Negative anomalies (blue) denote regions that according to the MARGO reconstruction were colder than today, positive anomalies (yellow) point to regions that might have been warmer than today. The squares mark the geographic locations of the sediment cores that were investigated by the MARGO project using a variety of methods for temperature reconstruction. Dark grey areas in the ocean stand in for those regions to which no anomaly could be assigned because the nearest data points were too far (more than 2000 km) away. For illustration, contour lines on land (height contours with a 500 m interval) indicate the extent of the continental ice sheets. The grid lines are 30° of longitude and latitude apart. For the map an equal-area Hammer projection was chosen. (Nature Geoscience, 2009