Internal and forced decadal variability: lessons from the past millennium

Hugues Goosse1, François Klein1, Didier Swingedouw2, Pablo Ortega3
Introduction
The climatic observations over the instrumental era as commonly defined (from roughly C.E. 1850 to present) cover a period too short to document the full range of climate variability. The study of paleoclimates provides a longer perspective allowing to explore the behavior of the climate system in a wider range of conditions and forcings. The most recent millennium is characterized by a climate very close to the present one and offers a large amount of long paleo-climatic time series. This allows multiple applications, such as to characterize more precisely the decadal to centennial climate variations, to test the robustness of potential mechanisms, or to estimate the exact probability and return period of some specific events. It can also be used to define a baseline climate on which the anthropogenic forcing has imposed its imprint. Fortunately, the last millennium is a period for which we have a relatively large amount of paleo data, with generally a low uncertainty on the dating of the records, and reasonable estimates of the changes in external forcing. Consequently, it has received a lot of attention over the last 20 years, allowing to obtain some crucial results for our understanding of the climate system.
Paleoclimatology requires collaboration between communities as the records are coming from diverse natural archives such as corals, tree rings, ocean and ice cores, speleothems, and others. Deciphering the climate signal in those archives requires a deep understanding of the physical, chemical and biological processes resulting in the formation of those archives. This knowledge is essential for paleoclimate reconstructions but, in turn, gives precious evidence of the impact of climate on natural systems. Furthermore, multi-proxy studies are always desirable so that inherent biases to each of the different archives can be partly canceled out. Studying the last millennium is thus a good opportunity to strengthen the link between the groups focusing on climate changes and the ones working on systems influenced by climate.
In this short note, we briefly present a few illustrations focusing first on the relative contributions of anthropogenic forcing, natural forcing and internal variability in the estimated temperature changes over the last millennium. Specific points about the role of oceanic circulation in the variability at decadal to centennial time scale and the impact of the forcing on climatic modes are then presented. We conclude with some perspectives for future developments.
The warming during the 20th century compared to the pre-industrial climate
A first clear conclusion from the analysis of the last millennium is that at the global scale climate was relatively stable before the industrial era (especially as compared to abrupt climate variations during glacial period), although reconstructions for the last millennium display some significant regional fluctuations. In many regions, the first centuries of the second millennium were relatively warm (the so-called medieval climate anomaly around 950-1250), followed by a colder period (the little ice age, around roughly 1450-1850) (Mann et al., 2009; PAGES 2k consortium, 2013). Those warm conditions during the medieval climate anomaly were less homogenous than during the 20th century, which appears as the only one over the past centuries characterized by a clear warming over all the continents, except Antarctica (Mann et al., 2009; PAGES 2k consortium, 2013). Model results agree with this conclusion and reproduce relatively well the main characteristics of reconstructed changes (Masson-Delmotte et al., 2013; PAGES 2k-PMIP3, 2015). This reinforces our confidence in their ability to reproduce the dominant processes responsible for the continental and global-scale temperature fluctuations at interannual to centennial timescales.
Role of internal variability
An emerging point from the analysis of last millennium climate is the dominant contribution of the internal variability (defined here simply as the one occurring even in the absence of natural or anthropogenic forcing) in the recorded fluctuations. Indeed, internal climate variability often overwhelms completely the influence of the natural external forcing (solar variations, volcanic eruptions) at the local to regional scales in climate model simulations (Goosse et al., 2005; Jungclaus et al., 2010).
Due to this important contribution of internal climate variability, ensembles of simulations, driven by the same external forcing but using different initial conditions, are required for meaningful comparisons between the results of one model and reconstructions and to disentangle the forced and unforced components of the simulated response (Goosse et al., 2005; Jungclaus et al., 2010; Otto-Bliesner et al., 2016).
 |
|
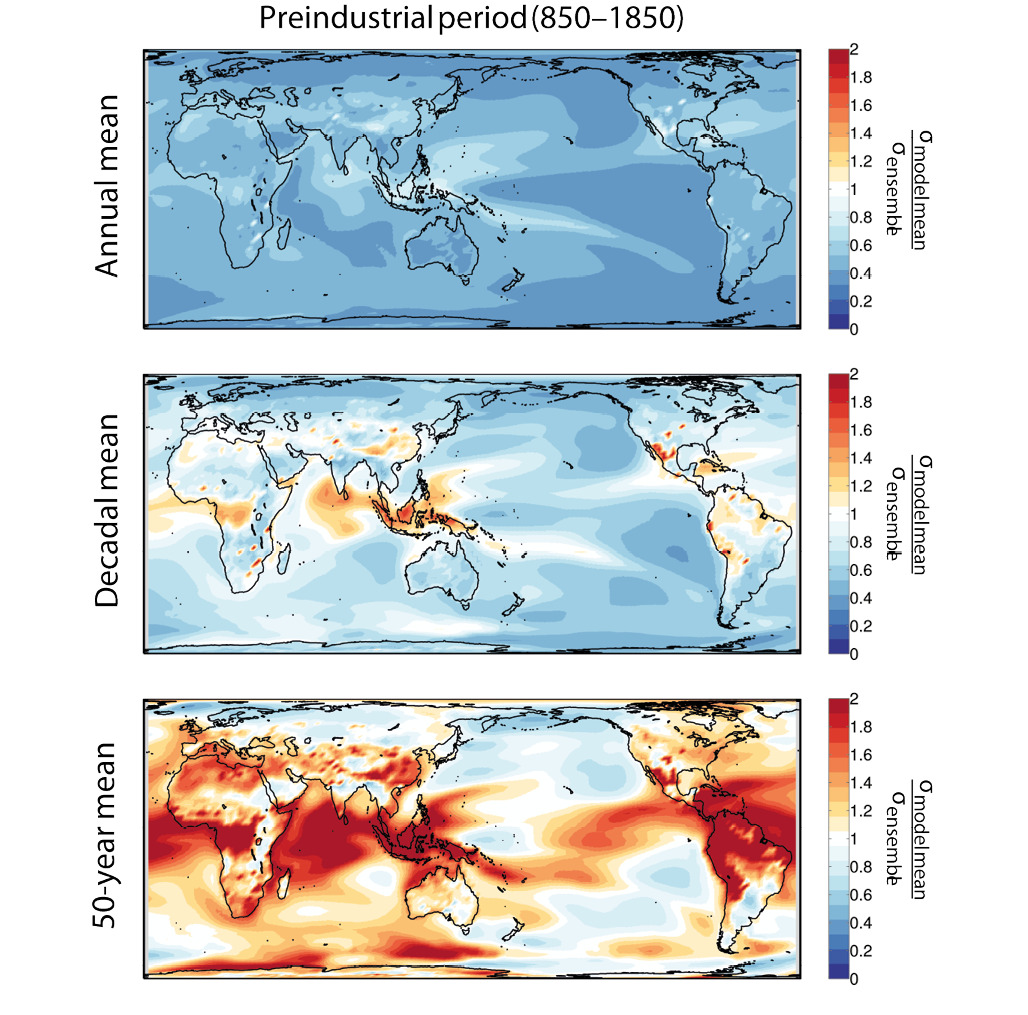
Figure 1: Ratio of the standard deviation of the ensemble mean of an ensemble of 10 simulations performed with CESM1 (Otto-Bliesner et al., 2016) over the mean standard deviation of the ensemble members around this ensemble mean, for the 2-meter air temperature. The standard deviations are computed over the period C.E. 850-1850 for (top panel) annual mean values (middle panel) decadal-means and (bottom panel) 50-year means. The ensemble mean is representative of the forced response while the range of the ensemble around this ensemble mean provides an estimate of the internal variability as simulated by the model. |
A commonly used metric to quantify the relative contribution of forced and internal variability in an ensemble of simulations is the ratio of the standard deviation of the ensemble mean over the mean standard deviation of the individual departures around this ensemble mean. The forced signal dominates in regions where this ratio is larger than 1, and the internally-driven signal when it is lower. These relative contributions can change depending on the timescale considered, as illustrated in Fig. 1 for the 2-meter air temperature in a set of ten last millennium simulations from the climate model CESM1 (Otto-Bliesner et al., 2016). At interannual timescales, internal fluctuations are dominant everywhere while, mainly in the tropics, a larger contribution of the response to the forcings can be found at multidecadal timescales (i.e. 50-year means). The surface average of the ratios over the Northern Hemisphere for annual means, decadal means and 50-year means are 0.45, 0.77 and 1.25, respectively. The corresponding values for the Southern Hemisphere are 0.44, 0.72 and 1.27. For the hemispheric mean temperatures (i.e., when the surface average is computed first before estimating the standard deviations), the relative contribution of the forced response is much larger with ratios of 1.13, 1.72 and 2.53 for the Northern Hemisphere mean temperature and 0.75, 1.58 and 2.66 for the Southern Hemisphere mean.
Many studies have also emphasized the role of internal variability in recent and future changes (Hawkins and Sutton, 2009; Boer, 2011; Deser et al., 2014), even though the external forcing will likely be much larger in the future (compared to the 850-1850 period) due to large anthropogenic greenhouse gases emissions. The last millennium therefore provides an ideal baseline to estimate the magnitude of natural and of internal variability at various spatial and temporal scales. For instance, this period can be used to evaluate the probability of extreme events such as droughts or floods before the dominant impact of greenhouse gas forcing, and the processes responsible for these events, as well as to test the stationarity of the teleconnections within the climate system (e.g., PAGES 2k Consortium, 2013; Ortega et al., 2015; Coats et al., 2016).
The influence of the natural forcing
Although natural forcing may be relatively weak at the regional scale, it is possible to detect and attribute statistically its influence on North Hemisphere temperature during the last millennium, in particular the imprint of volcanic forcing (Schurer et al., 2013). Major volcanic eruptions induce a global-scale cooling in the years following an event. Furthermore, changes in the frequency of the eruptions and their cumulative effects are also responsible for a significant part of the temperature difference between the medieval climate anomaly and the little ice age (Schurer et al., 2013; McGregor et al., 2015).
It has been mentioned above that model results overall agree with reconstructions but a more detailed analysis indicates that many of them tend to simulate a response to volcanic eruptions that is larger than in the reconstructions, with the largest differences in the Southern Hemisphere (Neukom et al., 2014; PAGES 2k-PMIP3, 2015). The correlation of temperature changes among the continents and between the hemispheres is also higher in the model simulations than in the reconstructions (Neukom et al., 2014; PAGES 2k-PMIP3, 2015). This high spatial coherence may be due either to uncertainties in the external forcing estimates, to a too strong and homogenous response to external forcings in the climate model simulations (Stoffel et al., 2015; LeGrande et al., 2016), or to an underestimation of the magnitude of internal variability in the models (which induces changes much less coherent among continents than the external forcings). Alternatively, uncertainty in the proxy-based reconstructions, due to the non-climatic noise, could lead to an underestimation of the coherency of the changes between regions. Determining the origin of those discrepancies will require to investigate all those elements simultaneously. A more objective model-data comparison is in particular required, including forward modules that simulate explicitly the proxy variables measured such as tree ring width or isotope composition (Evans et al., 2013). Indeed, a significant part of the mismatch may simply come from the differences in the variables that are compared between proxies and models.
Changes in ocean circulation
The changes in ocean circulation could potentially provide large contributions to the decadal variability over the last millennium. In the North Atlantic, some model results and reconstructions have suggested that decadal to centennial variations in the intensity of both the subpolar gyres and the meridional overturning circulation induced important changes in the oceanic heat transport, and thus had large-scale impacts on climate (e.g., Lund et al., 2006; McCarthy et al., 2015; Moreno-Chamarro et al., 2016).
Confirming those hypotheses about the role of ocean circulation is a challenge because the available proxy data is much more abundant over the continents than over the ocean and globally only a few marine records have high enough resolution to correctly represent decadal fluctuations. Compilations of observations have confirmed a global oceanic cooling over the period 850-1850, compatible with the one reconstructed for the continents (McGregor et al., 2015). At regional scales, new high-resolution oceanic observations (e.g. Reynolds et al., 2016) and syntheses (as in McGregor et al., 2015) are under way and significant progresses on our understanding of past oceanic changes are expected in the coming years.
The influence of the external forcing on the modes of climatic variability
The climate system variability is organized in large-scale modes of variability that are mainly governed by the dynamics of the ocean and the atmosphere. Well-known examples of these variability modes are the El-Niño Southern Oscillation (ENSO), the North Atlantic Oscillation (NAO) or the Atlantic Multidecadal Variability (AMV). While ENSO impacts the variability of the tropical Pacific, with many teleconnections world-wide, the NAO is focussed on local wind variations in the North Atlantic sector, and the AMV on sea-surface temperature variability in the Atlantic, potentially related with the large-scale Atlantic meridional overturning circulation (AMOC).
 |
|
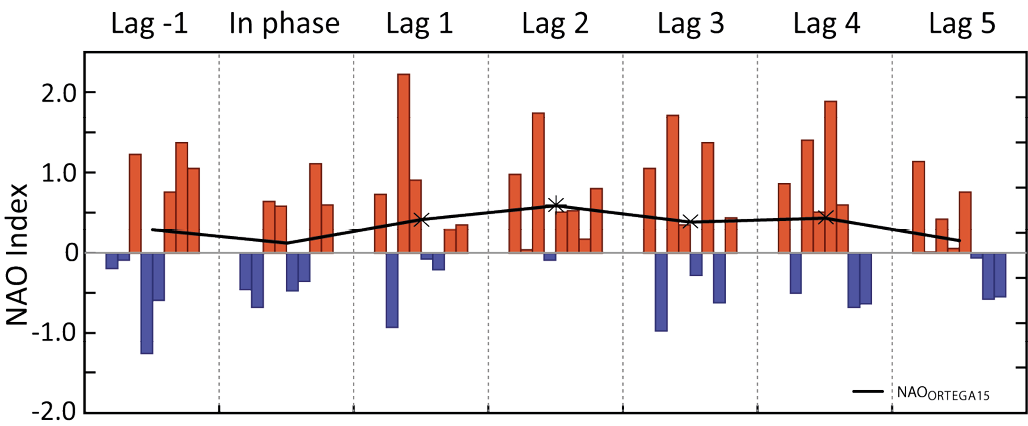
Figure 2: Composite (black line) and individual (colored bars) NAO responses to 8 of the strongest eruptions in the last millennium, as described by a multi-proxy NAO reconstruction covering this period (Ortega et al., 2015). Note that compared to Ortega et al. (2015), we have refined the selection of events to only consider those for which the date of the eruption is well constrained (see Swingedouw et al, 2017). Significance is assessed following a Monte Carlo approach with 1,000 random selections of 8 years from the NAO reconstruction. Significant values at the 90% and 95% confidence levels are represented by crosses and stars, respectively. |
Volcanic eruptions, by cooling the climate at the global scale, might strongly impact the fates of these variability modes and trigger a phase shift. The instrumental era is clearly too short to draw robust conclusions on such potential responses, as it mainly includes five large volcanic eruptions (Krakatau in 1883, Santa María in 1902, Agung in 1963, El Chichón in 1982 and Pinatubo in 1991). On the basis of analyses over the last millennium, some indications exist that volcanic eruptions might promote a positive phase of ENSO the year following a large eruption (e.g., Emile-Geay et al., 2008). Similarly, it has been recently shown that the largest eruptions of the last millennium are almost systematically followed by a positive phase of the NAO, particularly clear for the second winter after the eruptions (Ortega et al., 2015, Fig. 2). For the AMV and AMOC, a few recent studies suggest that volcanic eruptions may act as a pacemaker of their decadal variability over the last millennium (Otterå et al., 2011; Swingedouw et al., 2015). Nevertheless, no entirely clear and robust conclusions concerning the exact impact of volcanic eruptions on these variability modes can be drawn, notably due to difficulties of climate models to reproduce such impacts and the intricacy to separate the contribution of the forcing from the stochastic internal fluctuations (Swingedouw et al., 2017).
Further developments and perspectives
A promising way forward to reduce the uncertainties is the combination of paleo-data and model results to reconstruct as accurately as possible the state of the system over the past millennium. Although many challenges remain, such reanalyses for the past millennium are currently under development (Goosse et al., 2012; Hakim et al., 2016; PAGES, 2017). In addition to contributing to a better understanding of the dynamics of the system, those reconstructions could provide a test bed, complementary to the last century, for decadal prediction systems (Meehl et al., 2014), in order to evaluate their skill in a wider range of conditions. However, the ability to generate the initial climatic conditions for such retrospective predictions (hindcasts) is a dominant issue and the small amount of available data, notably in the ocean realm, strongly limits for the moment the breadth of the tests that can be performed over these past periods.
Many of the conclusions and the questions raised above for the last millennium correspond to research priorities for the more recent past (i.e., the instrumental period) as well. The advantage of the investigations covering the last millennium is the possibility to analyze longer time series, and thus increase the signal-to-noise ratio for the detection and attribution, for example, of forced signals. The disadvantage compared to the instrumental period is the scarcity and larger uncertainties of the proxy records and the larger resources needed to perform model simulations spanning several centuries. Despite those challenges, the information brought by the instrumental and pre-instrumental periods is very complementary, justifying strong interactions and collaborations.
acknowledgements
Hugues Goosse is Research Director within the Fonds National de la Recherche Scientifique (F.R.S.-FNRS-Belgium). Didier Swingedouw is supported by the French Centre National de la Recherche Scientifique (CNRS). The work of Pablo Ortega is funded by the NERC research Project DYNAMOC (NE/ M005127/1). This note is a contribution to the PAGES2k working group of PAGES. Support for PAGES activities is provided by the US and Swiss National Science Foundations, US National Oceanographic and Atmospheric Administration and by the Future Earth program.
affiliations
1 ELIC/TECLIM Université catholique de Louvain, Belgium
2 Environnements et Paléoenvironnements Océaniques et Continentaux (EPOC), UMR CNRS 5805 EPOC—OASU—Université de Bordeaux, Allée Geoffroy Saint-Hilaire, Pessac 33615, France
3 NCAS-Climate, Meteorology Department, University of Reading, UK
references