Basic mechanisms of centennial climate variability

Henk A. Dijkstra and Anna S. von der Heydt
Centennial climate variability appears in several long records of climate observables. Understanding the processes responsible for this internally generated variability can be achieved by a combination of more observational data and the definition of falsifiable criteria for specific physical mechanisms.
Indications for variability on centennial timescales are present in several observables of the climate system. Such variability has, for example, been found in a 3,500-year-long Tasmanian summer temperature record (Cook et al. 2000) and in a 4,500-year-long record of the sea temperature near Iceland (Sicre et al. 2008). It is often mentioned that the mechanisms to understand this type of variability are not known. However, several plausible basic mechanisms have been suggested; a mechanism is understood here as a description of a causal chain involving the interaction of well-known processes providing an explanation for the dominant timescale, and possibly a dominant spatial pattern, of variability.
Internal climate variability
Climate variability may arise from changes in the external forcing (e.g. greenhouse gas concentrations, aerosols and solar insolation), but may also originate from internal processes (e.g. instabilities). Examples of such internal variability are the dominant modes of present-day climate variability, such as the El Niño-Southern Oscillation (ENSO) on interannual timescales and the Atlantic Multidecadal Variability (AMV) on multidecadal timescales. When sea-surface temperature (SST) is chosen as the observable, the integration of small fluctuations by the ocean mixed layer generally leads to a red-noise spectrum (where power density decreases with increasing frequency; Hasselmann 1976). Any internal variability such as ENSO is then characterized by a peak above the (red noise) background spectrum and by a particular spatial pattern (Deser et al. 2010).
The mechanisms of ENSO and AMV can be traced back to the amplification of a single pattern due to specific feedbacks. For example, the SST pattern of El Niño is amplified through Bjerknes' feedbacks (stronger SST gradients across the Pacific tropics lead to stronger easterly winds that lead to stronger SST gradients) and is found as a single amplified pattern in Zebiak-Cane’s coupled ENSO model. The mechanism of propagation and amplification is related to the same pattern appearing in the mean state of the system, which under strong enough coupling gives rise to an unstable coupled mode with a pattern (Van der Vaart et al. 2000). A very similar single pattern is also found in ENSO simulations using climate models with high-resolution ocean components, having a high degree of variability due to presence of eddies and other small-scale (atmospheric) phenomena. Other types of variability are not related to a single pattern, but arise through the interaction of many patterns possibly having different spatial and temporal scales. Examples of such variability are the zonal and blocked flow transitions in the mid-latitude atmosphere (Charney and DeVore 1979) and the decadal variability of ocean western boundary currents (Shevchenko and Berloff 2015).
Climate variability on centennial timescales
As there is no obvious external forcing on centennial timescales, this variability must arise through internal mechanisms. Such mechanisms can be determined from the analysis of long (multi-century) simulations of global climate models, where the climate forcing may contain the seasonal cycle but no slower components. They cannot be determined solely from observations (proxy or instrumental) because records of the relevant fields are simply not long enough. The observations can hence only be used to falsify the mechanisms proposed from model simulations. Below, we describe two basic mechanisms of centennial variability as derived from such model simulations.
Atlantic surface air temperature variability
The first example comes from a 4000-year-long simulation carried out with the Geophysical Fluid Dynamics Laboratory (GFDL) CM2.1 model under constant preindustrial forcing (Delworth and Zeng 2012). The observable chosen was the surface air temperature averaged over the Atlantic domain and over the latitudes 20-90°N. This quantity shows dominant variability on centennial timescales, which appears above a red noise background spectrum. In these simulations, the inter-hemispheric heat transport associated with variations in the meridional overturning circulation (MOC) in the Atlantic is responsible for this variability. The variations arise through the advection of salinity anomalies by the MOC, which also determines the dominant timescale in the Atlantic domain surface air temperature.
 |
|
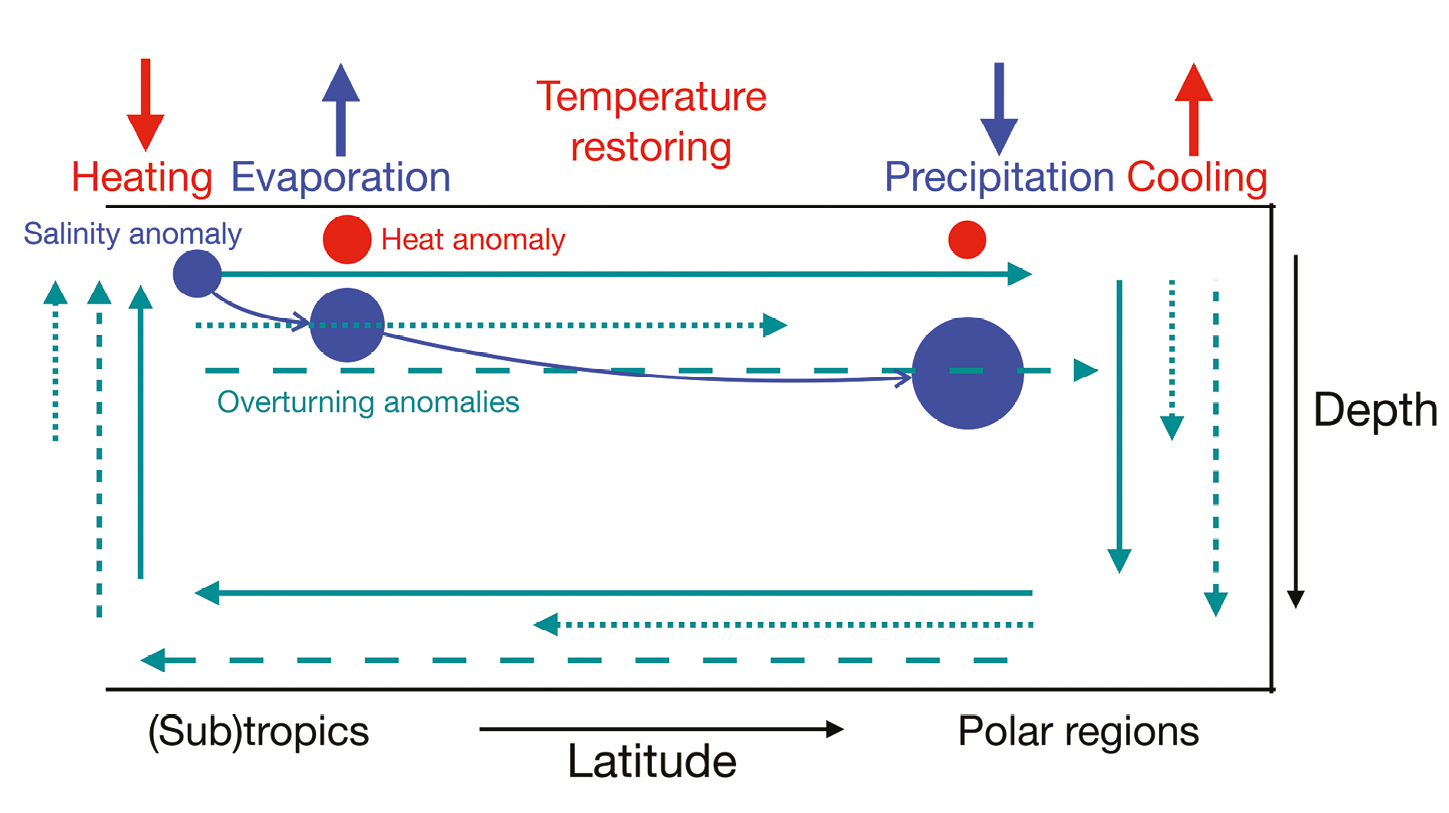
Figure 1: Sketch to describe the mechanism of the Loop Oscillation. A positive salinity anomaly is propagating with the MOC. While it is in the evaporating region, it weakens the MOC, remains longer in this region and hence is amplified. Next, in the precipitating region, it strengthens the MOC, is shorter in this region and is amplified. Moreover, because of different damping of temperature and salinity anomalies, temperature-induced density anomalies appear, which are out of phase with those caused by salinity and hence cause the oscillatory nature of the variability. The timescale is determined by the propagation time of the salinity anomaly over the loop defined by the MOC (details in Sevellec et al. 2006). |
Can this variability be traced back to the amplification of a single pattern in a more idealized model? Indeed, while investigating instabilities of the MOC in an idealized North Atlantic basin, it was found that buoyancy anomalies, which propagate over the overturning loop can be amplified (Sevellec et al. 2006); such oscillations are called "Loop Oscillations" (or overturning oscillations). The mechanism as deduced from such idealized models is sketched in Figure 1 and described in the caption. Similar patterns were also determined in global ocean models, where the timescale of variability is multi-millennial (Weijer and Dijkstra 2003).
Southern Ocean Centennial Variability
As a second example, we consider the centennial variability which was found in a 1500-year-long simulation with the Kiel Climate Model (KCM) using present-day constant forcing conditions (Latif et al. 2013). The observable used is the Southern Ocean Centennial Variability (SOCV) index, defined as the zonally and meridionally (from 50-70°S) averaged SST anomaly. The SOCV shows centennial variability above the red noise background. For this type of variability convection in the Weddell Sea is crucial with responses on sea-ice extent and MOC in turn affecting the convection.
 |
|
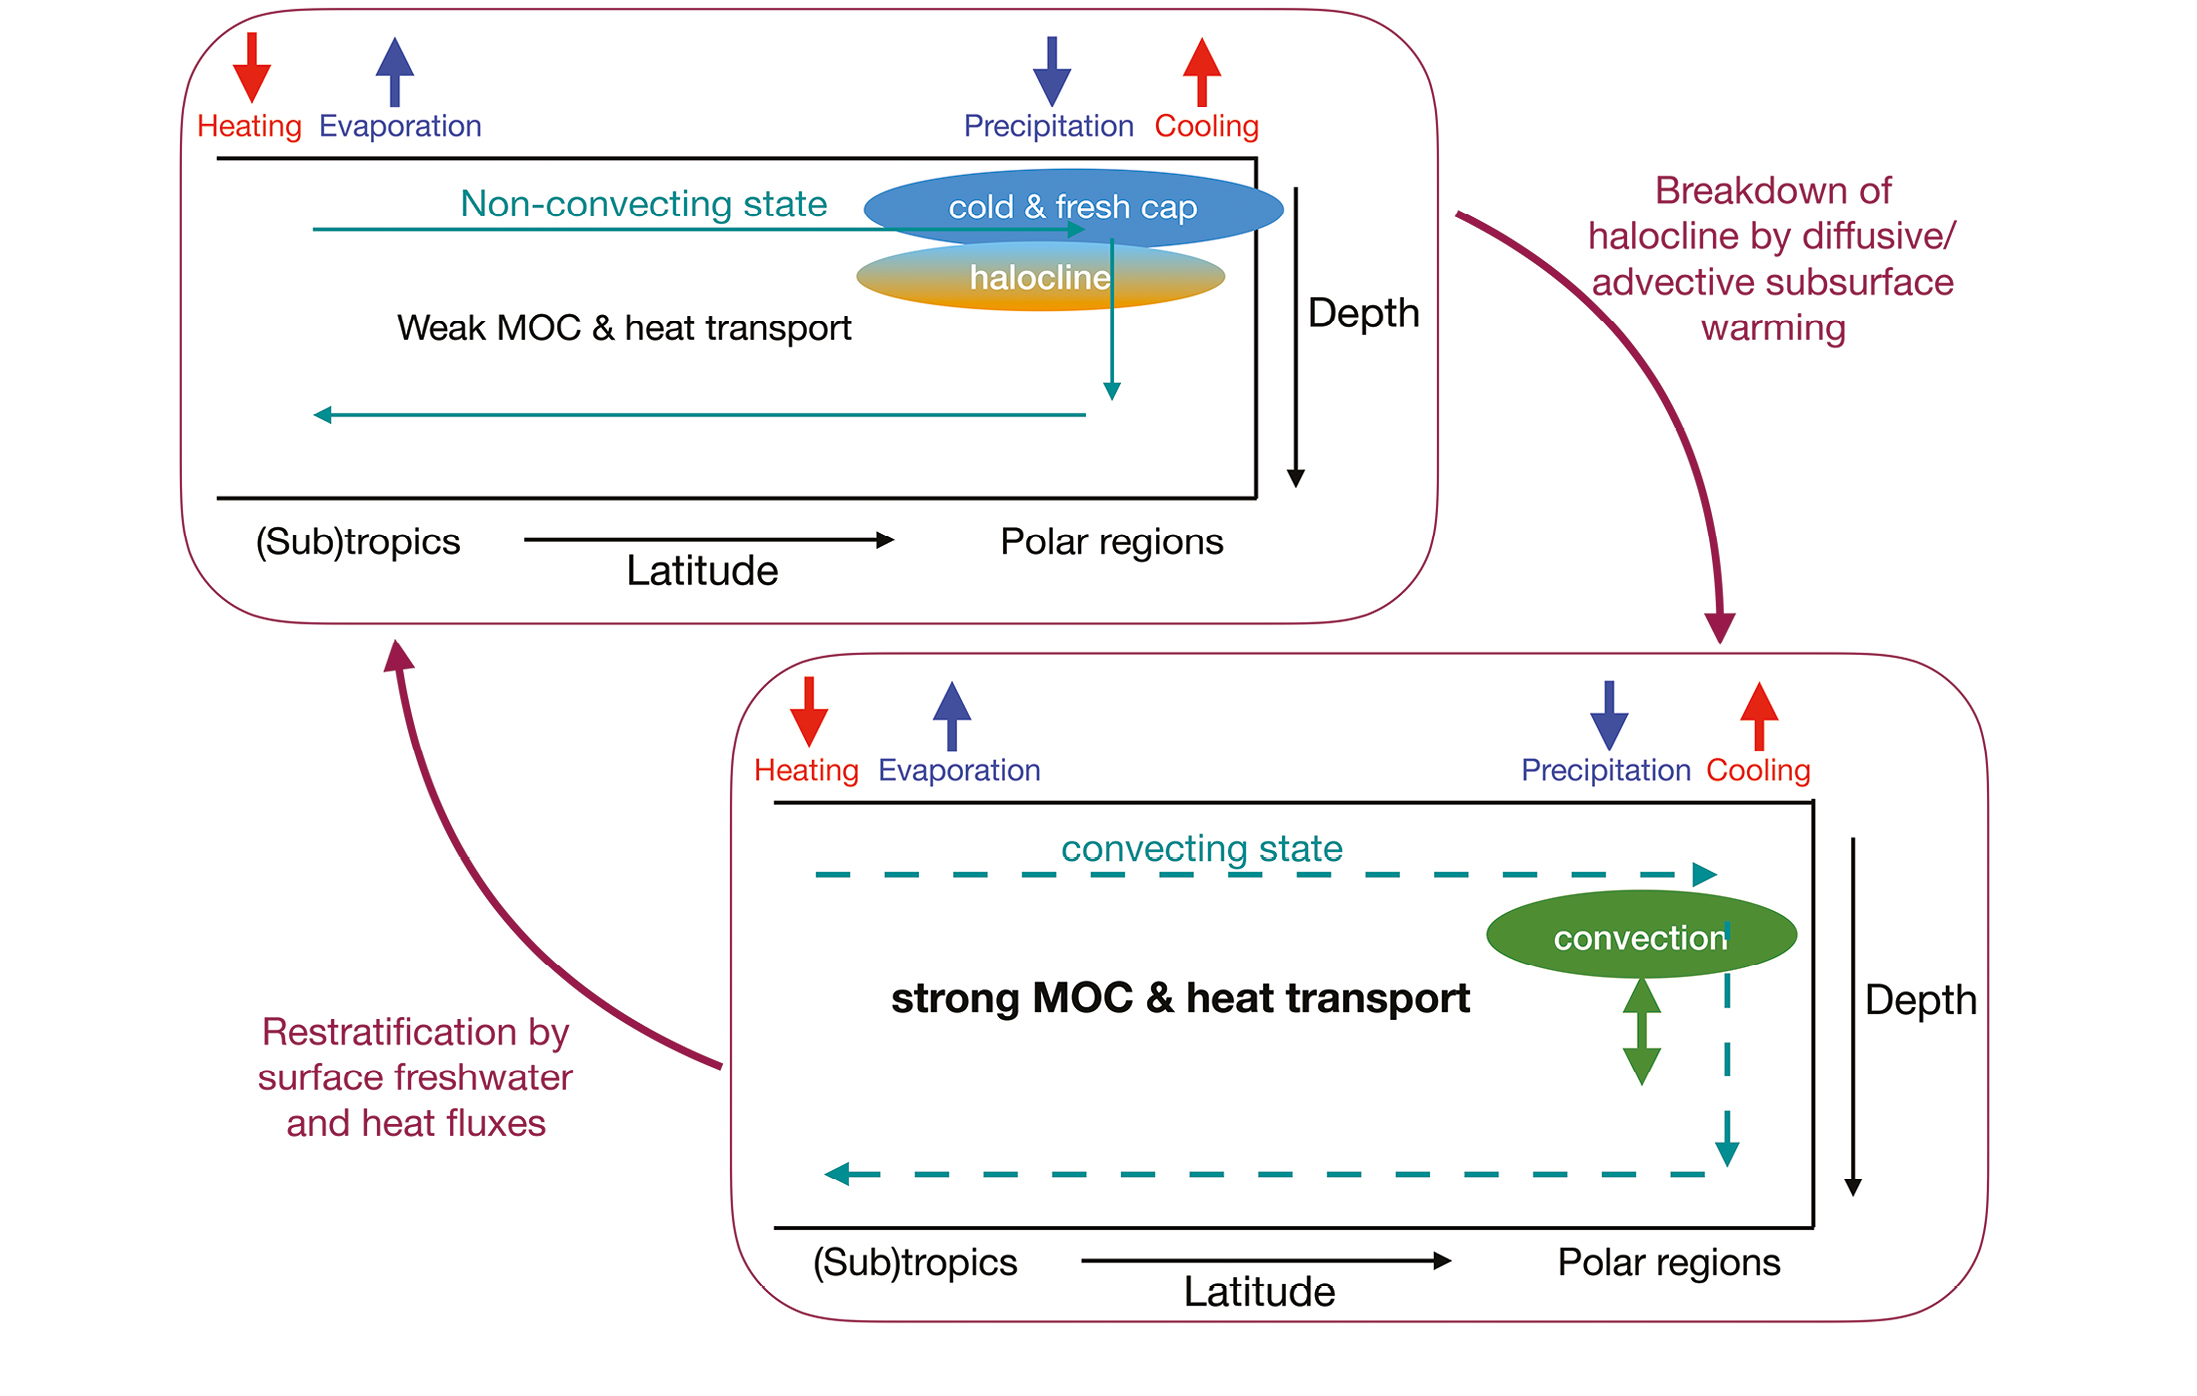
Figure 2: Sketch to describe the mechanism of the Convection-Restratification variability. Starting in a non-(or weakly) convecting state, advective (wind-driven) or diffusive warming of the subsurface ocean causes convection and breaks down the halocline. The convective state increases the strength of the MOC. Through advective and/or diffusive heat and salt fluxes, restratification occurs, which in turn reduces the density at the surface waters eventually causing the transition back to the non-convective state (details in Winton 1995). |
Can this variability again be attributed to a single pattern in a simplified model? In this case, this is more difficult and no single pattern in an idealized model has been found causing this type of variability. However, there are idealized models showing the variability caused by transitions between convective and non-convective states. These changes can therefore best be described by "Convection-Restratification" variability; when the restratification takes place through diffusive processes, the variability has been called a deep-decoupling oscillation or a "flush" (Winton 1995). A sketch of the mechanism of the "Convection-Restratification" variability is given in Figure 2 (with a description in the caption). Here the timescale is dependent on the processes restoring the stratification. When this process is vertical, mixing the timescale is millennial (Colin de Verdiere 2007), but when faster processes of restratification are involved, the timescale can decrease to centennial, or even (multi)-decadal (e.g. LeBars et al. 2016).
A way forward
The two mechanisms described above form the basic mechanisms of centennial variability in either the Atlantic or the Southern Ocean. In other model simulations, variants or modifications are found as the atmosphere and sea-ice components are also affected. At the moment, it is difficult to falsify these basic mechanisms by the observational database. It is therefore important that specific falsification criteria for the mechanisms are developed, which can then be applied every time the database of observations is updated. Also, more sophisticated (nonlinear) data-analysis techniques may be needed to look at higher-order statistics than just simple linear stationary statistical measures (Mukhin et al. 2015). An increasing observational database and good falsification criteria of specific mechanisms are the way forward to get more clarity on the processes responsible for centennial climate variability.
affiliation
Institute for Marine and Atmospheric research Utrecht, Department of Physics, Utrecht University, The Netherlands
contact
Henk A. Dijkstra: h.a.dijkstra uu.nl
uu.nl
references
Charney JG, DeVore JG (1979) J Atmosph Sci 36: 1205-1215
Colin de Verdiere A (2007) J Phys Oceanogr 37: 1142-1155
Cook ER et al. (2000) Clim Dyn 16: 79-91
Delworth TL, Zeng F (2012) Geophys Res Lett 39: L13702
Deser C et al. (2010) Annu Rev Mar Sci 2: 115-143
Hasselmann K (1976) Tellus 28: 473-485
Latif et al. (2013) J Clim 26: 7767-7782
LeBars et al. (2016) Geophys Res Lett 43: 2101-2110
Mukhin D et al. (2015) Sci Rep 5: 15510
Sevellec F et al. (2006) J Mar Res 64: 355-392
Sicre MA et al. (2008) Quat Sci Rev 27: 2041-2047
Shevchenko I, Berloff P (2015) Ocean Mod 94: 1-14
Van der Vaart PCF et al. (2000) J Atmos Sci 57: 967-988