The contributions of PMIP to the IPCC assessment reports
Masa Kageyama1, A. Abe-Ouchi2, J. Annan3, P. Braconnot1, C. Brierley![]() 4, J. Fidel Gonzalez-Rouco5, J. Hargreaves3, S.P. Harrison6, S. Joussaume
4, J. Fidel Gonzalez-Rouco5, J. Hargreaves3, S.P. Harrison6, S. Joussaume![]() 1, D.J. Lunt
1, D.J. Lunt![]() 7, B. Otto-Bliesner
7, B. Otto-Bliesner![]() 8 and M. Rojas Corradi9
8 and M. Rojas Corradi9
PMIP contributed to the Intergovernmental Panel on Climate Change (IPCC) Assessment Reports (ARs) by placing current climate change into a wider context, evaluating climate model performance in very different climatic states, and constraining climate sensitivity based on paleoclimates.
Before PMIP
Back in 1990 when the First Assessment Report (FAR) of the Intergovernmental Panel for Climate Change (IPCC; Houghton et al. 1990) was published, PMIP did not exist. However, in its fourth chapter, entitled "Validation of climate models", the report drew on the pioneering results from CLIMAP Project Members (1981), who produced the first set of boundary conditions for LGM experiments, and COHMAP Members (1988), who produced paleodata syntheses and model simulations for key periods between the LGM and present. It stated that "studies of paleoclimate changes are an important element in climate model validation for two reasons: (1) they improve our physical understanding of the causes and mechanisms of large climatic changes so that we can improve the representation of the appropriate processes in the models, and (2) they provide unique data sets for model validation."
This view has guided the contribution of PMIP results to subsequent assessment reports. The creation of PMIP was announced in the Second Assessment Report (Houghton et al. 1996) in Chapter 5 ("Climate models – evaluation"): "The earlier ice age SST (sea surface temperature) data sets […] are now being revised for use in the newly organized Paleoclimate Modelling Intercomparison Project (PMIP) which is focusing on simulations for the Last Glacial Maximum and for 6000 years BP using atmospheric models with both fixed SST and mixed-layer oceans".
PMIP in the Third Assessment Report: mid-Holocene and Last Glacial Maximum
PMIP studies on both topics outlined in the FAR, model evaluation and process understanding, have been included in every subsequent assessment report of the IPCC. In the Third Assessment Report (TAR; Houghton et al. 2001), PMIP results can be found in Chapter 8 ("Model evaluation"). The iconic figure for the mid-Holocene African monsoon (Joussaume and Taylor, this issue; Fig. 1, adapted from Joussaume et al. 1999) shows that models agree with precipitation reconstructions in simulating an increased monsoon, but that they underestimate the reconstructed northward displacement of the monsoon area. The text states that this is also the case for the northward displacement of the Arctic tree line, and highlights the inconsistency between the simulated drier Eurasia and reconstructed wetter climate there.
 |
|
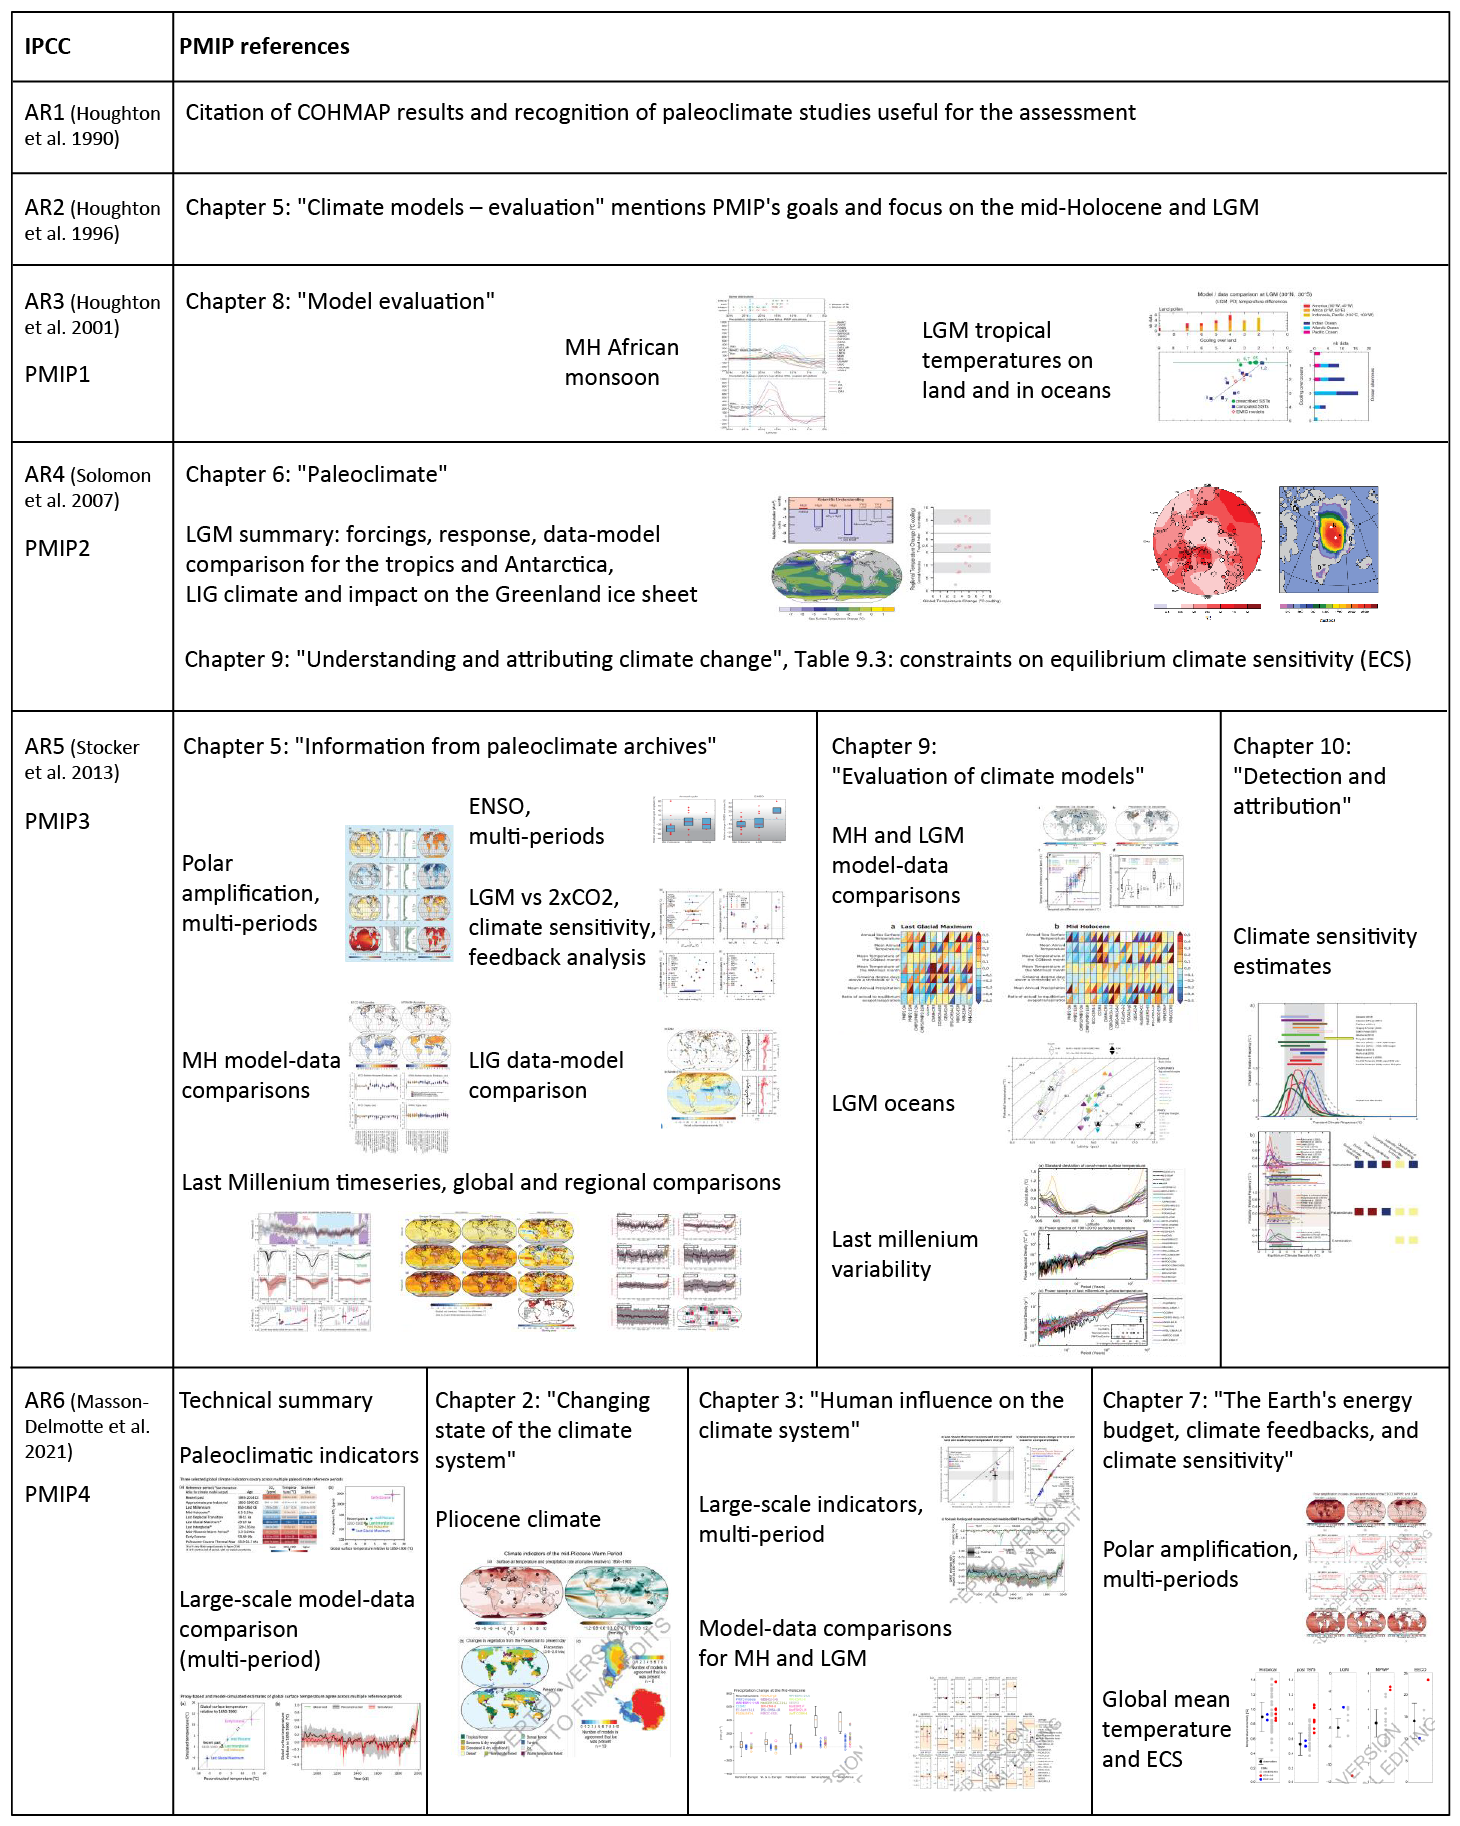
Figure 1: Summary of paleoclimate modeling mentions in the IPCC first and second assessment reports, and of the figures showing PMIP results in subsequent assessment reports. |
Also in the TAR, PMIP results for the Last Glacial Maximum (LGM) are in terms of the potential link between the global mean cooling and climate sensitivity, and an estimate of the LGM radiative forcing is given. The text then evaluates model results in comparison to new reconstructions for the tropics (Joussaume and Taylor, this issue, Fig. 2) and the extratropics. The cooling over the tropics was a highly debated topic, in particular because the cooling over land was found to be much larger than over the oceans. This characteristic could only partly be explained by the "land–sea contrast" later found in observations of current climate change and projections for the future.
At the time of the third assessment, the main conclusion was that the CLIMAP reconstructions were probably too warm over the tropics. Results from slab-ocean models were in better agreement with reconstructions, despite the fact they used present-day meridional heat transport. The TAR also points to a good agreement between models and data over Europe, except for winter for which the models underestimate the reconstructed cooling. All these themes would be addressed in subsequent reports.
PMIP in the Fourth Assessment Report: addition of the Last Interglacial
In the Fourth Assessment report (AR4; Solomon et al. 2007), PMIP disappears from the evaluation chapter (apart from a citation on modeling abrupt climate change) and appears in Chapter 6, a new chapter entirely dedicated to paleoclimate, and in Chapter 9, on "Understanding and Attributing Climate Change". Figure 6.5 shows components of the radiative forcing for the LGM, together with the simulated cooling in terms of sea surface temperatures and the relationships between global and regional temperature changes from the LGM to pre-industrial. This figure thereby highlights processes leading to the temperature change, and simultaneously provides an evaluation of the results. The conclusion is that AOGCMs "are able to simulate the broad-scale spatial patterns of regional climate change recorded by paleodata in response to the radiative forcing and continental ice sheets of the LGM, and thus indicate that they adequately represent the primary feedbacks that determine the climate sensitivity of this past climate state to these changes."
The AR4 also introduces AOGCM simulations of the Last Interglacial and, for the first time, some simulations of the last millennium from AOGCMs and Earth system models of intermediate complexity, which announces subsequent coordinated work within PMIP. The AR4 quantifies the estimated global LGM cooling of 4–7°C, which makes this period very relevant to the warming projected for 2100. PMIP results are also highlighted in Chapter 9 in relation to future climate, and contribute to the estimated ranges of equilibrium climate sensitivity in Table 9.3.
PMIP in the Fifth Assessment Report: multi-period analyses
The Fifth Assessment Report (AR5; Stocker et al. 2013) contains the largest number of figures showing PMIP results; these appear in chapters 5 ("Information from paleoclimate archives"), 9 ("Evaluation of climate models"), and 10 ("Detection and attribution of climate change"). The results are based on the PMIP3 mid-Holocene, LGM, and last millennium simulations, and the chosen figures show updated process understanding for the LGM and data–model comparisons for the mid-Holocene and the Last Interglacial. For the last millennium, AR5 highlights the large increase in the number of available AOGCM simulations relative to AR4. Furthermore, the consistency of these simulations with reconstructions and external forcing changes is evaluated, showing our understanding of the processes involved in the unprecedented present warming at hemispheric and continental scales.
A novelty in AR5 is that results (specifically regarding polar amplification) are shown from multiple past periods (including for the mid-Pliocene Warm Period and the Eocene Climate Optimum), together with an idealized future scenario (2xCO2) in the same figure. Another new topic is the analysis of changes of ENSO variability for different periods. Several lines of evidence, including paleoclimate reconstructions and simulations are also combined to assess Equilibrium Climate Sensitivity in a comprehensive section on this topic in Chapter 10. Model evaluation (Chapter 9) focuses on the last millennium variability, large-scale and regional features of the LGM and mid-Holocene surface climate, as well as LGM large-scale deep ocean gradients in temperature and salinity. Model performance is also quantified in terms of metrics, similar to the approach used for evaluating present climate in comparison to observations. However, in the case of PMIP, the metrics are based on bioclimatic variables.
The Sixth Assessment report: PMIP distributed throughout the report
Simpler diagnostics have been chosen for the Sixth Assessment Report, in which most chapters are devoted to process understanding and provide a holistic assessment of broad topics, including paleoclimatic information. PMIP results, and results from paleoclimate studies more generally, are distributed throughout the report—with figures found in chapters 2 ("Changing state of the climate system"), 3 ("Human influence on the climate system"), 7 ("The Earth's energy budget, climate feedbacks, and climate sensitivity"), and 8 ("Water cycle changes"). One remarkable result is that within the combination of constraints on equilibrium climate sensitivity, paleoclimatic reconstructions, supported by modeling work associated with PMIP, were key to reducing the likely range of equilibrium climate sensitivity from the AR5 range of 1.5–4.5°C to 2.5–4.0°C. We are optimistic that this presentation may improve the public's awareness of PMIP results, and their potential for use by policymakers and other stakeholders.
affiliations
1Laboratoire des Sciences du Climat et de l'Environnement, LSCE/IPSL, UMR CEA-CNRS-UVSQ, Université Paris-Saclay, Gif sur Yvette, France
2Atmosphere and Ocean Research Institute, The University of Tokyo, Japan
3BlueSkiesResearch, Settle, UK
4University College London, UK
5Department of Earth Physics and Astrophysics, Geosciences Institute IGEO (UCM-CSIC), Complutense University of Madrid, Spain
6School of Archaeology, Geography and Environmental Science (SAGES), University of Reading, UK
7School of Geographical Sciences, University of Bristol, UK
8National Center for Atmospheric Research, Boulder, CO, USA
9Department of Geophysics, University of Chile, Santiago, Chile
contact
Masa Kageyama: masa.kageyama lsce.ipsl.fr
references
COHMAP Members (1988) Science 241: 1043-1052
CLIMAP Project Members (1981) Seasonal reconstruction of the Earth's surface at the last glacial maximum. Geol Soc Am, Map and Chart Series, pp 1-18