Paleoclimatic data syntheses from the terrestrial realm: History and prospects
Patrick J. Bartlein![]() 1 and Thompson Webb III
1 and Thompson Webb III![]() 2
2
Syntheses of terrestrial paleoclimatic data have a long history, but in the 1980s they rapidly developed into the database-in-a-repository form we know today. Over time they have anchored the productive interaction with climate-model simulations aimed at both testing the models and explaining patterns in the data.
One of the basic tasks of PMIP (and its predecessor studies) is the comparison of climate-model simulations with paleoenvironmental observations. This is motivated by the dual objectives of using the observations to "benchmark" or test the models, and using the physically based models to provide mechanistic explanations for the observed patterns in the data (Braconnot et al. 2012; Harrison et al. 2015). These objectives have in turn motivated the synthesis of paleoenvironmental data from both terrestrial and marine sources and their interpretation. Here we review some of the past terrestrial syntheses, and their evolution over time.
Early syntheses
Before the mid-1970s, syntheses of terrestrial paleoenvironmental data were available in book form, as textbooks (e.g. Brooks 1949; Zeuner 1959; Frenzel 1967; and R.F. Flint's evolving sequence: 1947, 1957, and 1971), edited volumes (e.g. Nairn 1961; Wright and Frey 1965), and H.H. Lamb's (1971, 1977) two-volume treatise. Although not databases in any sense, such publications were the places to go for broad descriptions of past climates and the observations they were based on.
Also of note from this era was a U.S. National Academy of Sciences report, Understanding Climatic Change, prepared by the U.S. Committee for the Global Atmospheric Research Program (USCGARP 1975). This study included Appendix A, a survey of past climates by Imbrie, Broecker, Mitchell, and Kutzbach, that included some temporal and spatial syntheses of climatic variations. Many of the themes and proposals for climate-research action discussed there (such as the joint elaboration of paleoclimatic databases and development of simulation models of both present and past climates) would seem familiar today.
CLIMAP era
CLIMAP (Climate: Long range Investigation, Mapping, and Prediction) was a collaborative project aimed at reconstructing conditions at the Last Glacial Maximum, in particular the distribution of ice sheets, seasonal sea-surface temperatures, and land-surface albedo. The main results of the reconstructions appeared in Science (CLIMAP Project Members 1976), and more fully in an edited volume (Cline and Hays 1976), and a set of maps (CLIMAP Project Members 1981). In a companion paper, Gates (1976) described the results of a GCM simulation with surface boundary conditions provided by the CLIMAP reconstructions. Although not the first attempt at paleo simulation, the paper did feature what might be regarded as a canonical mode of data–model comparison—dots on a map.
Running through the CLIMAP-era discussions was the notion that if the goal was comparison of paleo-observations and climate-model simulations, then more paleo-data were surely needed. This began to be realized late in the 1970s. For example, Bernabo and Webb (1977) described mapped summaries of Holocene pollen data from northeastern North America, and similar work was underway for Europe (Huntley and Birks 1983). A special issue of Quaternary Research (Hecht et al. 1979) contained the first really comprehensive syntheses of terrestrial paleoclimatic data on a global scale (Peterson et al. 1979; Street and Grove 1979).
 |
|
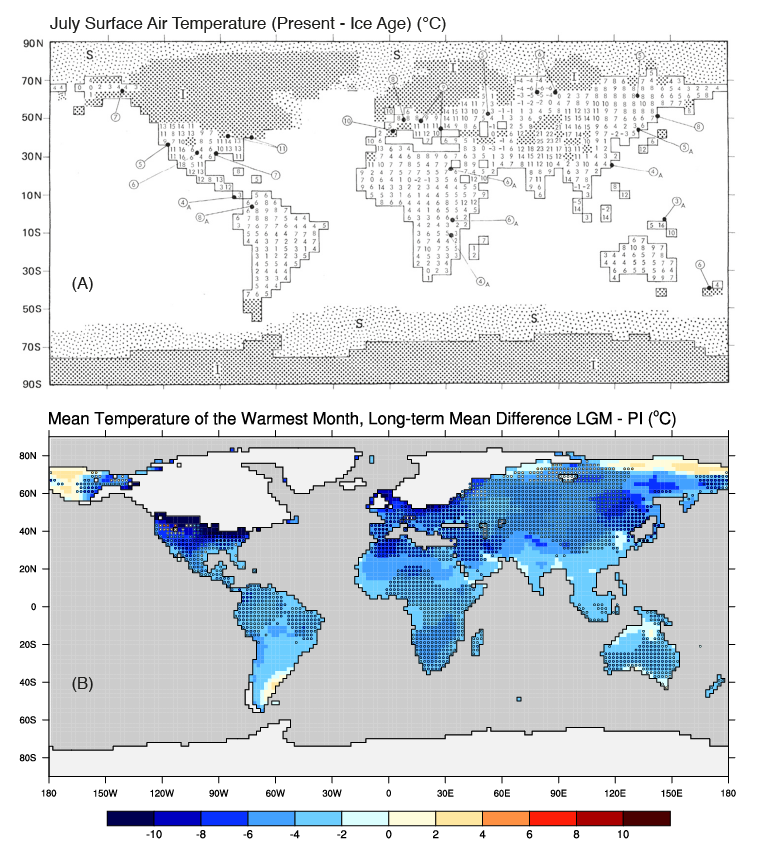
Figure 1: Forty-five years of progress in terrestrial data–model comparisons. (A) CLIMAP-era comparisons of simulated (values on the model grid) and reconstructed (circles and dots) July temperature difference (present-day minus ice age); figure modified from Gates (1976). (B) Gridded reconstructions of the Last Glacial Maximum minus present mean temperature of the warmest month (colored dots, data from Cleator et al. 2020), plotted over CMIP5/PMIP3 lgm – piControl multi-model means on a 2-degree grid (see Harrison et al. 2014). |
Peterson et al. (1979) brought together data for the LGM, and introduced the notion of "levels of analysis of the data: I: "raw" pollen, lake-level, etc. data; II: Level I data converted to estimates of specific climatic variables; and III: Level II data combined from various sources, and interpolated and contoured. (From a data-preservation perspective, we might now consider a Level 0—the materials themselves, e.g. Palmer et al. 2021, and Level IV—coordinated data sets of multiple kinds of data linked to one another, Grobe et al. 2021). Peterson et al. also addressed chronological uncertainties, introducing a three-level classification (later refined to seven levels by Webb 1985a), and the question of how much data is enough for valid comparisons. Street and Grove (1979) described lake-status data both temporally and spatially over the past 30 kyr. The syntheses were not electronic, and the results exist today only as .pdfs of the articles. However, they contained data-availability statements, perhaps some of the earliest. The 150-page Appendix to Peterson et al. could be obtained for the price of photocopying (probably ∼USD 7.50), while the Street and Grove data would be furnished on microfiche for USD 2.50.
COHMAP era
COHMAP (Cooperative Holocene Mapping Project; Wright et al. 1993; Wright and Bartlein 1993) was an international, interdisciplinary research group that became organized in the late 1970s, benefiting from the experiences of several of the participants in CLIMAP. The project evolved to focus on a suite of paleoclimatic simulations at 3-kyr intervals from the Last Glacial Maximum to present, and parallel syntheses of terrestrial and marine data and climate reconstructions based on them (e.g. COHMAP Members 1988).
By 1980, it became obvious that photocopy and microfiche distribution was not ideal. Personal computers were becoming widely available as were connections to the forerunners of the internet, and this pushed along the electronic distribution of data.
What might be regarded as the first "modern" syntheses were a global compilation of the climate of 6000 yr BP and the supporting data (Webb 1985a) and a synthesis of lake-level status for the COHMAP target times (Street-Perrott et al. 1989). These studies had both printed and electronic components (on magnetic tape), and remarkably, the .pdfs of the printed reports and the data files are still available online. The collections of individual files are easily recognizable as the elements of a relational database, and feature such components of 21st-century databases as "rich" site metadata, separation of the chronologies or age models from the data, adoption of common vocabularies, harmonization of taxa, sediments, depositional environments, and links to publications and to the data originators.
The databases of that era represented snapshots of data available at the time of publication, and, unlike today, there was no provision for updating. This led to another strategy for database development that is still in use today: a distinction between a database (in a repository) and a "research data set", which may include newer published and unpublished data. The published databases, along with continuously updated research data sets, supported analysis of the data (e.g. Webb 1985b; Street-Perrott and Harrison 1985; COHMAP Members 1988; Harrison 1989).
PMIP era
By the mid 1990s, databases of the 1980s were being regularly elaborated and enlarged, while contributing to the evaluation of newer sequences of climate-model experiments (e.g. Webb and Kutzbach 1998) and to the first generation of PMIP experiments (Joussaume et al. 1999). Examples include lake-status records for Europe and elsewhere produced by Sandy Harrison and associates, often published as a journal article and companion data release (e.g. Yu and Harrison 1995a; 1995b) – anticipating the current FAIR Principles for data management and stewardship. Pollen databases were organized for each continent (e.g. NAPD and EPD, the North American and European Pollen Database(s), Grimm et al. 2018 provides a history). The pollen databases contributed to Level III-type syntheses, such as that represented by the reconstruction of vegetation at 6000 yr BP and the LGM (Prentice and Webb 1998; Boenisch et al. 2001).
Over the past decade, databases or syntheses that contribute to the design or evaluation of the current (PMIP4) generation of simulations came online, including those for standard and "deep-time" experiments (e.g. Cleator et al. 2020; Hollis et al. 2019; Dowsett et al. 2016), as well as those for the last millennium, such as the International Tree-Ring Data Bank (Zhao et al. 2018) and the PAGES2k Consortium (2013; 2017) database of temperature reconstructions. Other databases that have yet to "fully participate" in PMIP-style data–model comparisons include those for biomass burning and paleofire (Marlon et al. 2016) and speleothem isotopes (Comas-Bru et al. 2020). Recently "databases of databases" have appeared including the Neotoma Paleoecology Database (Williams et al. 2018b; Grimm et al. 2018), which folded in many earlier paleoecological-focused efforts and greatly expanded the content and usability of the data.
Today the amount of data has begun to impact their usability (Khider et al. 2019), and external (to PMIP or to paleoclimatology in general) demands on paleoscience require answering more complicated questions than "What happened?" or "Do the models really work?" Those issues are being addressed; see, for example, the November 2018 issue of Past Global Changes Magazine (Williams et al. 2018a) and Grobe et al. (2021).
One common theme in the history of syntheses of terrestrial paleoclimatic data is the goal of making the data available, whether via book, edited volume, multiple-authored article, or adopted new technologies. A second common theme is the continuous interaction between scientific questions and data availability. Hypotheses about how the climate system works, expressed either as predictions from conceptual models or output from climate-model simulations, demand data for testing. The patterns in the data, both temporal and spatial, demand explanation and in turn generate new questions and hypotheses. That interaction between the data and models makes the intellectual environment of paleoclimatology rich and motivates continued data generation, curation, and synthesis.
affiliations
1Department of Geography, University of Oregon, Eugene, OR, USA
2Department of Earth, Environmental and Planetary Sciences, Brown University, Providence, RI, USA
contact
Pat Bartlein: bartlein uoregon.edu
references
Bernabo JC, Webb T III (1977) Quat Res 8: 64-96
Braconnot P et al. (2012) Nat Clim Change 2: 417-424
Brooks CEP (1949) Climate Through the Ages, Rev Ed. McGraw-Hill, 395 pp Cleator SF et al. (2020) Clim Past 16: 699-712
Data: doi.org/10.17864/1947.244
CLIMAP Project Members (1981) Seasonal reconstruction of the Earth's surface at the last glacial maximum. Geol Soc Am, Map and Chart Series, pp 1-18
Digital data: ncdc.noaa.gov/paleo-search/study/2516
PDFs of the maps: rock.geosociety.org/Store/detail.aspx?id=MCH036P
Cline RM, JD Hays (1976) Geol Soc Am Memoirs 145
COHMAP Members (1988) Science 241: 1043-105
Comas-Bru L et al. (2020) Earth Syst Sci Data 12: 2579-2606
Data: doi.org/10.17864/1947.256
Dowsett H et al. (2016) Clim Past 12: 1519-1538
Flint RF (1947) Glacial Geology and the Pleistocene Epoch. Wiley, 589 pp
Flint RF (1957) Glacial and Pleistocene Geology. Wiley, 553 pp
Flint RF (1971) Glacial and Quaternary Geology. Wiley, 892 pp
Frenzel B (1967) Die Klimaschwankungen des Eiszeitalters. Vieweg+Teubner Verlag, 244 pp
Gates WL (1976) Science 191: 1138-1144
Grimm EC et al. (2018) PAGES Mag 26: 64-65
Harrison SP (1989) Clim Dyn 3: 157-167
Harrison SP et al. (2014) Clim Dyn 43: 671-688
Harrison SP et al. (2015) Nat Clim Change 8: 735-743
Hecht AD et al. (1979) Quat Res 12: 6-17
Hollis C et al. (2019) Geosci Model Dev 12: 3149-3206
Huntley B, Birks HJB (1983) An Atlas of Past and Present Pollen Maps for Europe, 0-13,000 years ago. Cambridge University Press, 667 pp
Joussaume S et al. (1999) Geophy Res Let 27: 859-862
Khider D et al. (2019) Paleoceanogr Paleoclimatol 34: 1570-1596
Marlon JR et al. (2016) Biogeosci 13: 3225-3244 data available at: https://paleofire.org
Nairn AEM (1961) Descriptive Paleoclimatology. Interscience, 380 pp
PAGES2k Consortium (2013) Nat Geosci 6:339-346
PAGES2k Consortium (2017) Sci Data 4: 170088
Palmer J (2021) Eos 102: 22-29
Peterson GM et al (1979) Quat Res 12: 47-82
Prentice IC, Webb T III (1998) J Biogeogr 25: 997-1005
Street FA, Grove AT (1979) Quat Res 12:83-118
Street-Perrott FA, Harrison SP (1985) In: Hecht AD (Ed) Paleoclimate Analysis and Modeling. Wiley, 291-340
USCGARP (United States Committee for the Global Atmospheric Research Program) (1975) Understanding Climatic Change.
Webb T III (1985a) Global Paleoclimatic Data for 6000 Yr B.P. U.S. Department of Energy Technical Report 18, Washington, D.C. 20545. Available from the U.S. Department of Energy, Office of Scientific and Technical Information: osti.gov/search/semantic:10.3334/CDIAC/cli.ndp011
Webb T III (1985b) In: Hecht AD (Ed) Paleoclimate Analysis and Modeling. Wiley, 163-195
Webb T III, Kutzbach JE (1998) Quat Sci Rev 17: 465-471
Williams JW et al. (2018a) PAGES Mag 26: 49
Williams JW et al. (2018b) Quat Res 89: 156-177
Wright HE Jr, Frey DG (Eds; 1965) The Quaternary of the United States. Princeton University Press 922 pp
Wright HE Jr. et al. (Eds; 1993) Global Climates since the Last Glacial Maximum. University Minnesota Press, 569 pp (see Preface and Introduction)
Wright HE Jr, Bartlein PJ (1993) Holocene 3: 89-92
Yu G, Harrison SP (1995a) Boreas 24: 260-268
Zeuner FE (1959) The Pleistocene Period: Its Climate, Chronology and Faunal Successions. Hutchinson Scientific & Technical, 447 pp
Zhao S et al. (2018) J Beogeog 46: 355-368
Data: ncdc.noaa.gov/data-access/paleoclimatology-data/datasets/tree-ring