PlioMIP: The Pliocene Model Intercomparison Project
Alan M. Haywood1, H.J. Dowsett2, J.C. Tindall1, PlioMIP1 and PlioMIP2 participants
PlioMIP is a network of paleoclimate modelers and geoscientists who, through the study of the mid-Pliocene Warm Period (mPWP ∼3.3–3.0 million years ago), seek to understand the sensitivity of the climate system to forcings and examine how well models reproduce past climate change.
Origins of PlioMIP
Building upon 20 years of geological data collection/synthesis by the US Geological Surveys' PRISM Project (Pliocene Research Interpretation and Synoptic Mapping), as well as early Pliocene climate-model studies, paleoclimate modelers and proxy-data experts gathered at the Goddard Institute for Space Studies in New York, USA, in 2007 to discuss the feasibility of a coordinated multi-model and proxy-data effort. A proposal for a PlioMIP working group within PMIP was endorsed at the 2008 PMIP meeting in Estes Park Colorado, USA (pastglobalchanges.org/calendar/128659). Through two discrete phases of work (PlioMIP1 and PlioMIP2), the project has produced, contributed, or inspired more than 100 articles in peer-reviewed literature. It has transformed our view of the Pliocene world, and underlined what the Pliocene tells us about climate and broader Earth system responses to atmospheric carbon dioxide levels akin to those of the present day.
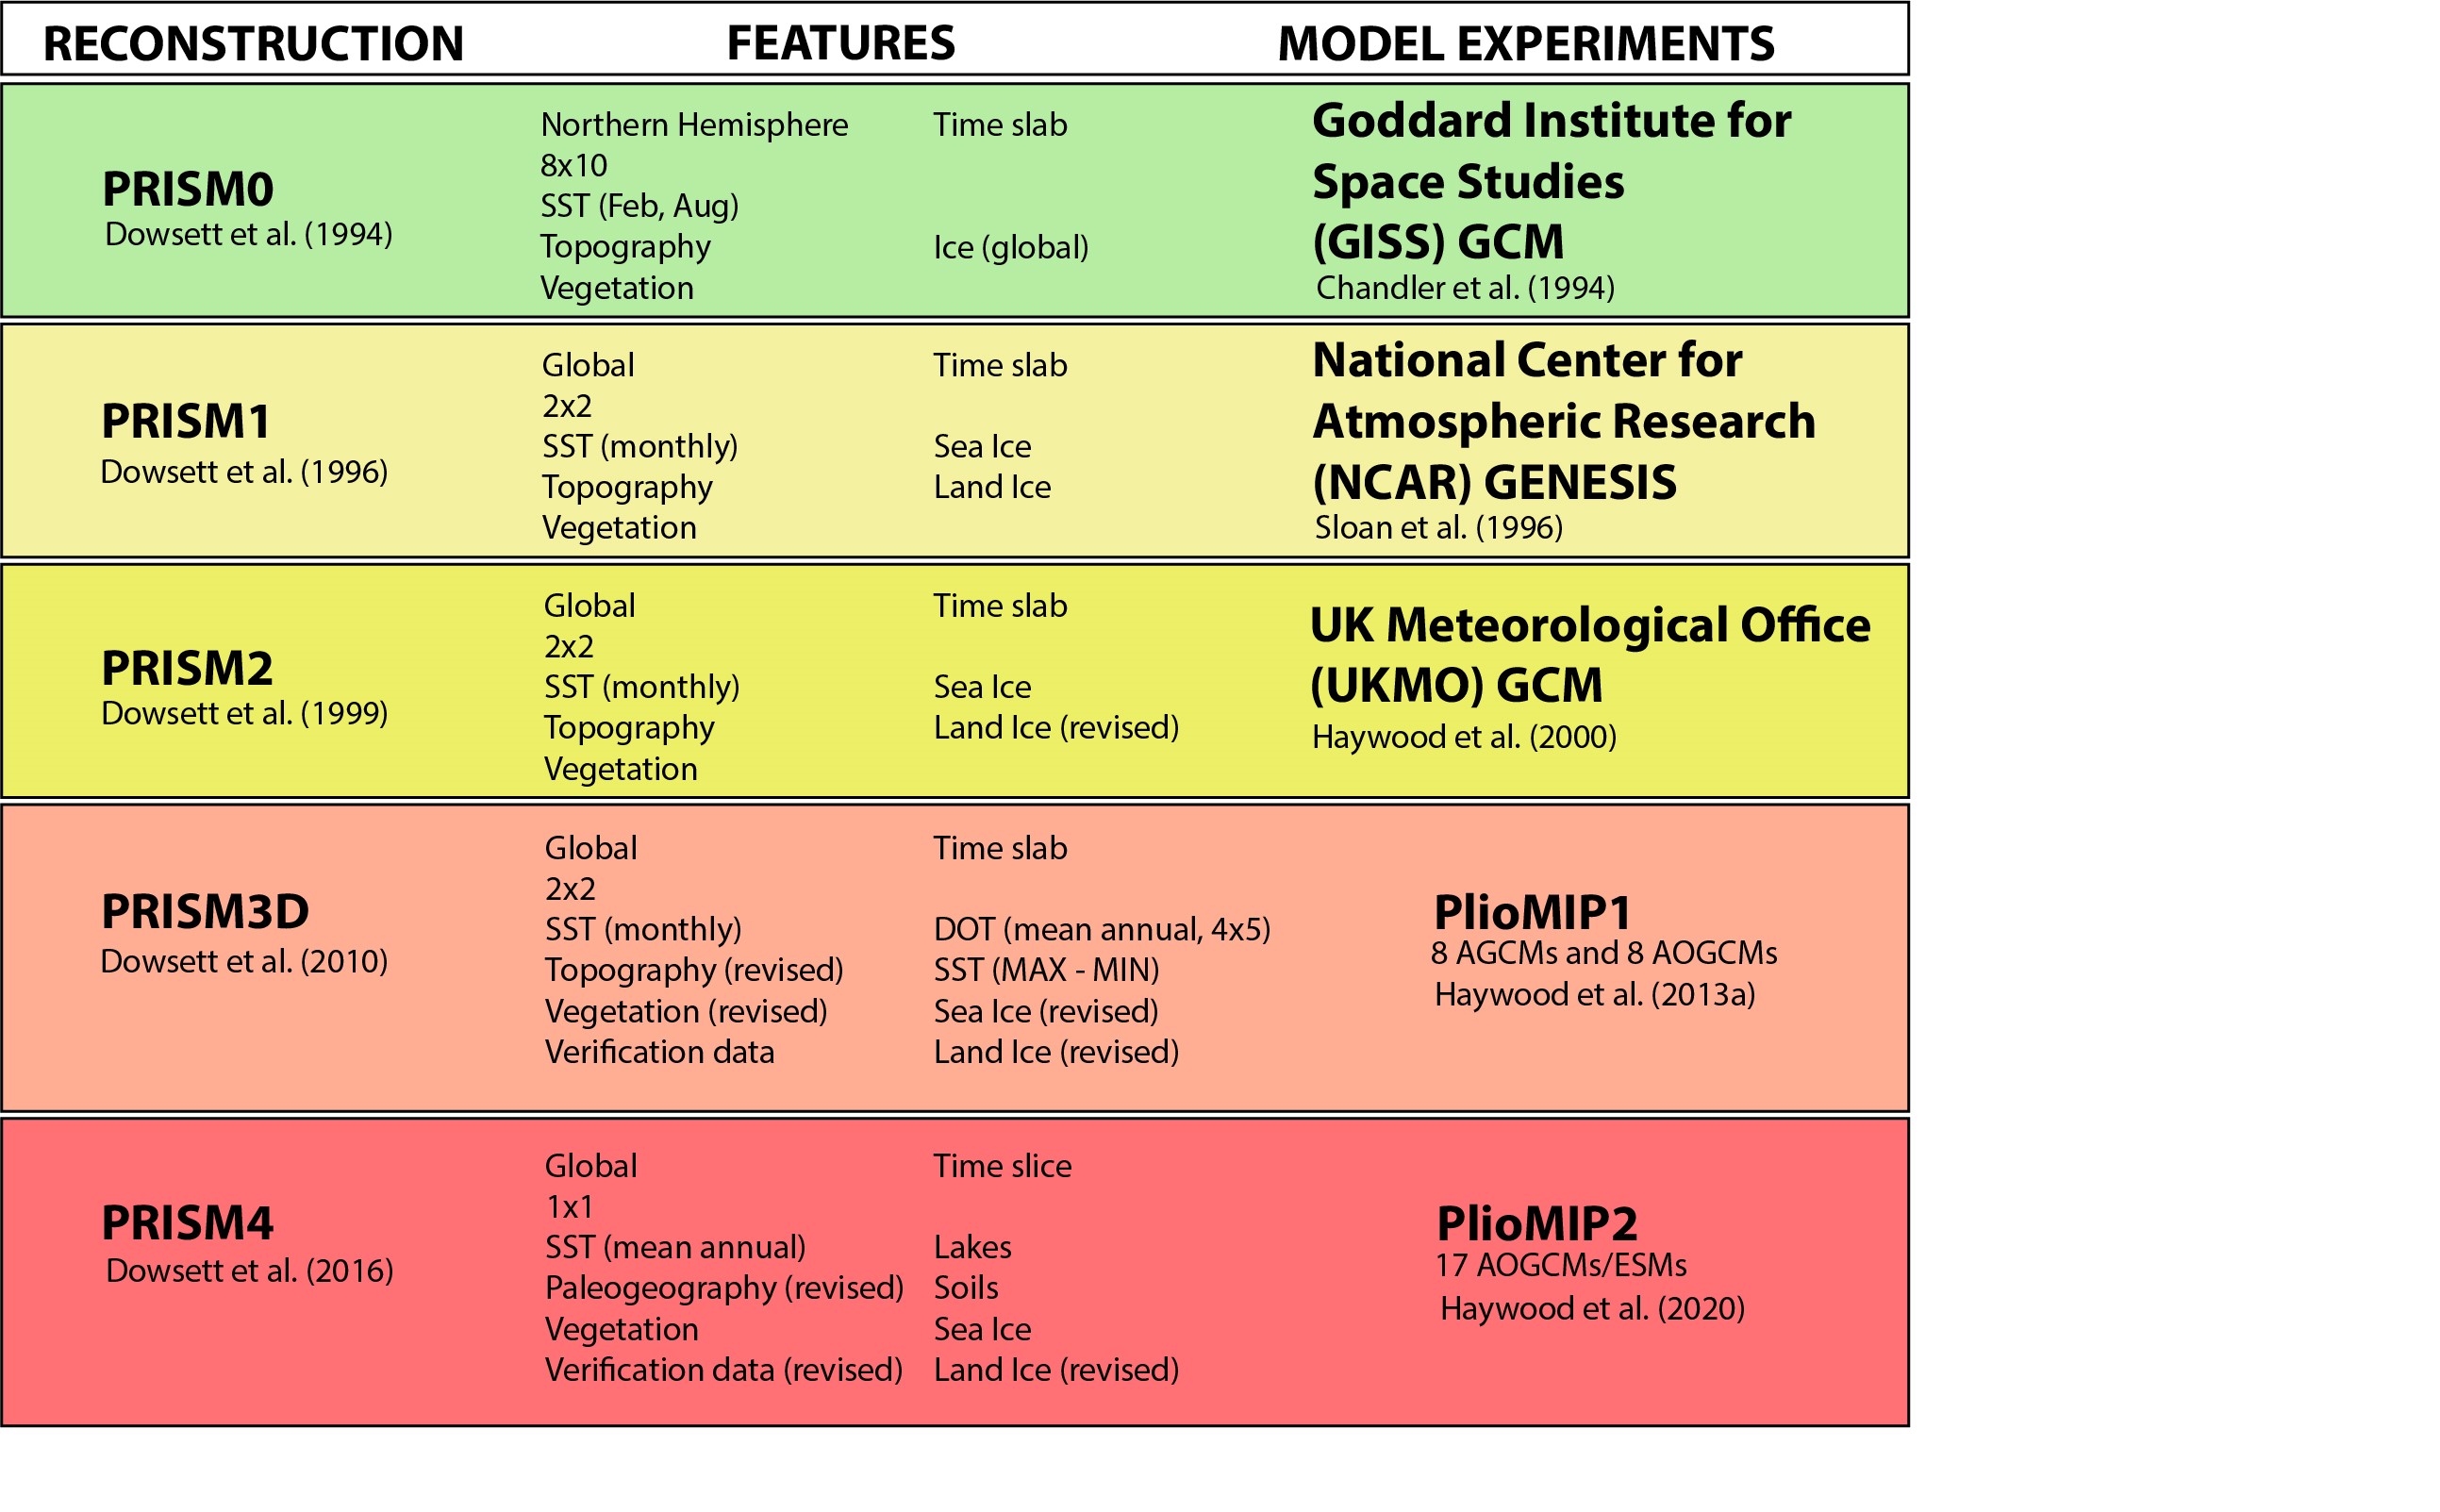
The experimental designs for PlioMIP1 and 2 (Haywood et al. 2010; 2016) were underpinned by two generations of PRISM boundary conditions (geology.er.usgs.gov/egpsc/prism/index.html; Dowsett et al. 2010; 2016; Table 1). The 2010 PRISM3 reconstruction, used in PlioMIP1, was published at a global scale of 2° latitude x 2° longitude, and consisted of data on sea level, sea surface temperature, sea ice, deep ocean temperature, topography, vegetation, and land ice (Dowsett et al. 2010). The 2016 PRISM4 reconstruction, used in PlioMIP2, improved the global spatial resolution to 1° latitude x 1° longitude, adding soils and large lakes, and incorporated new methodologies/approaches in paleogeographic reconstruction (Dowsett et al. 2016).
PlioMIP1 outcomes (mPWP compared to the pre-industrial era)
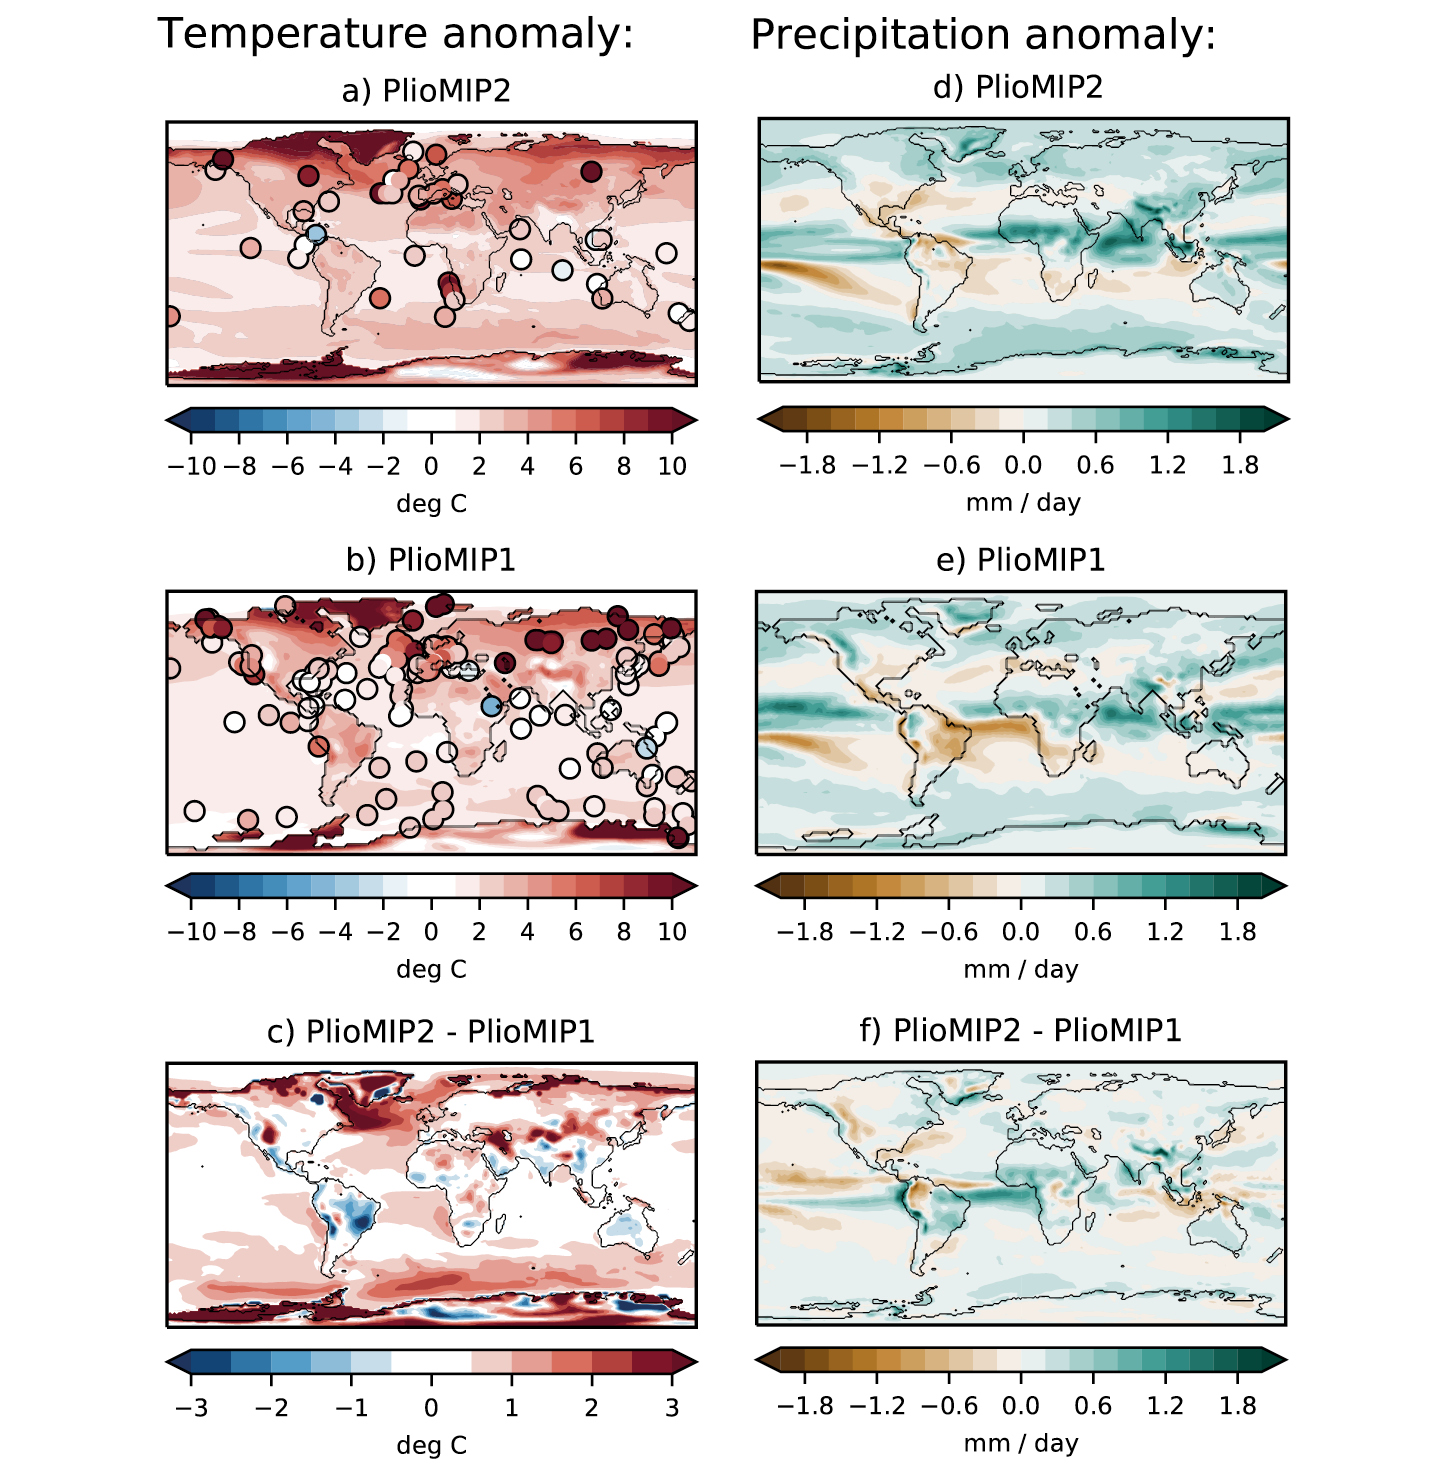
An ensemble of eight climate models indicated that the mPWP global annual mean surface air temperature was 1.8 and 3.6°C higher than the pre-industrial baseline. Warming was predicted at all latitudes yet amplified at the poles, reducing the meridional temperature gradient (Haywood et al. 2013a; Fig. 1). A decline in Arctic sea-ice extent, with some models displaying a seasonally sea-ice-free Arctic, was predicted (Howell et al. 2016). Increased temperatures were predominantly a response to direct CO2 forcing in the tropics and changes in albedo at high latitudes (Hill et al. 2014).
 |
|
Figure 1: (A) PlioMIP2 and (B) PlioMIP1 multi-model annual mean surface air temperature (SAT) differences (over land) and sea surface temperature (SST) differences (over oceans) in °C, compared to the pre-industrial era. (C) Difference between PlioMIP2 and PlioMIP1 multi-modal means (°C). (D) PlioMIP2 and (E) PlioMIP1 multi-model annual mean total precipitation rate (mm/day) differences (compared to the pre-industrial era). (F) Difference between PlioMIP2 and PlioMIP1 multi-modal means (mm/day). Circles represent proxy-derived SST and SAT anomalies in (A) from McClymont et al. (2020) and Salzmann et al. (2013) respectively. Proxy-derived SST and SAT anomalies in (B) from Dowsett et al. (2010) and Salzmann et al. (2013) respectively. |
The change in meridional temperature gradient weakened tropical atmospheric circulation, specifically the Hadley circulation, a response akin to model predictions for the future (Corvec and Fletcher 2017). Mid-latitude westerly winds shifted poleward (Li et al. 2015), tropical cyclone intensity and duration increased (Yan et al. 2016) and the East Asian and West African summer monsoons strengthened (R Zhang et al. 2013; 2016). The global land monsoon system expanded poleward with increased monsoon precipitation over land (Li et al. 2018). The Atlantic Meridional Overturning Circulation (AMOC) showed no clear change (Z Zhang et al. 2013). Equilibrium Climate Sensitivity (ECS) ranged from 1.9 to 3.7°C (Hargreaves and Annan 2016). Earth System Sensitivity (ESS) was 1.47°C higher than the ECS (ensemble mean ECS = 3.4°C; ensemble mean ESS = 5.0°C; Haywood et al. 2013a). While models were able to reproduce many of the regional patterns of ocean and land surface temperature change demonstrated by proxy data, they underestimated the magnitude of warming at higher latitudes (e.g. Salzmann et al. 2013; Dowsett et al. 2013).
Creating PlioMIP2
PlioMIP1 highlighted two issues with model boundary conditions and proxy data used to verify climate models. Firstly, the PRISM3 paleogeographic reconstruction was a semi-quantitative interpretation of the available geological data. Changes in the distribution of land versus sea, as well as topography/bathymetry, result in significant regional changes to model-generated climates. A more objective and reproducible assessment, including the modeling of dynamic topography and incorporation of glacial isostatic adjustment (GIA) effects on the local expression of Pliocene sea level, was necessary (Dowsett et al. 2016). Secondly, PRISM reconstructions of sea surface temperatures (SSTs) were based on a time-slab concept that averaged warm phase SSTs over a ∼260–300 kyr window. This practice was not optimal for verification of model-predicted SSTs, as models provide estimates of Pliocene SSTs in equilibrium with a set of time-specific boundary conditions/forcings (Haywood et al. 2016).
 |
|
Table 1: Evolution of PRISM boundary conditions and their integration into climate models and PlioMIP. |
Moving beyond PlioMIP1 required an improved chronology for proxy data, and something approaching a true time-slice SST synthesis. Marine isotope stage KM5c (3.205 Myr BP) on the LR04 timescale was chosen as it represented an "interglacial event" within the mPWP, characterized by an almost identical orbital forcing to today, thus enhancing the relevance of its study in the context of future climate change (Haywood et al. 2013b). Proximity to a magnetic reversal and major benthic oxygen isotope excursions enhanced the ability to recognize the time-slice in high-resolution proxy records (Dowsett et al. 2016).
PlioMIP2 outcomes to date
Based on 16 of 17 available climate models that contributed simulations to the PlioMIP2 project, Haywood et al. (2020) determined that the range of global mean surface air temperatures increase was 1.7 to 5.2°C relative to the pre-industrial (multi-model mean 3.2°C), with warming polewards of 60°N and 60°S exceeding the global mean warming by a factor of 2.3 (Fig. 1). Sea-ice coverage was reduced by an average of 53%, with 11 of 16 models simulating ice-free summer conditions (de Nooijer et al. 2020). Later generation models tend to have an increased climate response compared to earlier generation models (Feng et al. 2020; Haywood et al. 2020), potentially related to new aerosol–climate and cloud microphysics schemes included in later models. The UK CMIP6 generation model HadGEM3 was determined to be too warm compared to available proxy data (Williams et al. 2021), with the previous generation UK model (HadGEM2) providing a better overall fit to geological data (Williams et al. 2021). Like in PlioMIP1, the PlioMIP2 ensemble indicates that the global monsoon domain expands, particularly in North Africa, Asia, and Australia (Berntell et al. 2021).
When using new time-slice SST reconstructions, there was broad agreement between data and models at the global scale, with regional differences reflecting ocean circulation and/or proxy signals (McClymont et al. 2020; Haywood et al. 2020). In the Atlantic and Pacific oceans, meridional temperature gradients reduced, while tropical zonal gradients remain largely unchanged. In the Atlantic this leads to a simulated reduction of interannual-to-decadal SST variability (Pontes et al. 2020). For the AMOC, in contrast to PlioMIP1, all models simulated an intensified mid-Pliocene AMOC, but no consistent response in the simulated Atlantic Ocean heat transport (Zhang et al. 2021). This consistent change in AMOC is potentially related to the closing of the Bering Strait/Canadian Archipelago in the PRISM4 reconstruction (Zhang et al. 2021). ENSO amplitude was reduced in the ensemble mean (–24%), with 15 of 17 individual models showing a reduction (Oldeman et al. 2021). The ensemble mean ESS is 67% greater than the ECS; which is larger than the increase of 47% obtained in PlioMIP1. An ECS range of 2.6–4.8°C accords with values presented in previous IPCC assessments (Haywood et al. 2020).
Going forward
PlioMIP2 will complete its planned analyses/publications within the next year and is beginning to address the necessary experiment planning in order to underpin a third phase of the project. This will include consideration of new CO2 and CH4 estimates (de la Vega et al. 2020; Hopcroft et al. 2020), uncertainties in paleogeographic reconstruction, as well as strategies to improve the availability of proxy data relevant to the PlioMIP time-slice. The project will continue to place a balanced emphasis on studies designed to improve our understanding of Pliocene climate, as well as studies which translate our knowledge of the past to better understand future climate change.
Affiliations
1School of Earth and Environment, University of Leeds, UK
2Florence Bascom Geoscience Center, US Geological Survey, Reston, VA, USA
contact
Alan Haywood: A.M.Haywood leeds.ac.uk
references
Berntell E et al. (2021) Clim Past Discuss, doi:10.5194/cp-2021-16
Chandler M et al. (1994) Glob Planet Change 9: 197-219
Corvec S, Fletcher CG (2017) Clim Past 13: 135-147
de la Vega E et al. (2020) Sci Rep 10: 11002
de Nooijer W et al. (2020) Clim Past Discuss, doi:10.5194/cp-2020-64
Dowsett HJ et al. (1994) Glob Planet Change 9: 169-195
Dowsett HJ et al. (1996) Mar Micropaleontol 27: 13-25
Dowsett HJ et al. (1999) U.S. Geological Survey Open File Report 99-535
Dowsett HJ et al. (2010) Stratigraphy 7: 123-139
Dowsett HJ et al. (2013) Sci Rep 3: 2013
Dowsett HJ et al. (2016) Clim Past 12: 1519-1538
Feng R et al. (2020) J Adv Model Earth Syst 12: e2019MS002033
Hargreaves JC, Annan JD (2016) Clim Past 12: 1591-1599
Haywood AM et al. (2000) Glob Planet Change 25: 239-256
Haywood AM et al. (2010) Geosci Model Dev 3: 227-242
Haywood AM et al. (2013a) Clim Past 9: 191-209
Haywood AM et al. (2013b) Philos Trans R Soc A 371: 20120515
Haywood AM et al. (2016) Clim Past 12: 663-675
Haywood AM et al. (2020) Clim Past 16: 2095-2123
Hill DJ et al. (2014) Clim Past 10: 79-90
Hopcroft PO et al. (2020) Proc Natl Acad Sci USA 117: 23401-23407
Howell FW et al. (2016) Clim Past 12: 749-767
Li X et al. (2015) Adv Atmos Sci 32: 909-923
Li X et al. (2018) Palaeogeogr Palaeoclimatol Palaeoecol 512: 56-70
McClymont EL et al. (2020) Clim Past 16: 1599-1615
Oldeman AM et al. (2021) Clim Past Discuss, doi:10.5194/cp-2021-58
Pontes GM et al. (2020) Sci Rep 10: 13458
Salzmann U et al. (2013) Nat Clim Change 3: 969-974
Sloan LC et al. (1996) Mar Micropaleontol 27: 51-61
Williams CJR et al. (2021) Clim Past Discuss, doi:10.5194/cp-2021-40
Yan Q et al. (2016) Proc Natl Acad Sci USA 113: 12963-12967
Zhang R et al. (2013) Clim Past 9: 2085-2099
Zhang R et al. (2016) Adv Atmos Sci 33: 1061-1070