Sea ice in the satellite era


Walter N. Meier![]()
Sea ice during the modern satellite observational record shows a stark contrast between the Arctic and Antarctic. The Arctic is undergoing profound change with significant declines in extent and thickness. The Antarctic is marked by strong variability and small trends.
Indigenous populations have been exploring the Arctic environment since they arrived in the region thousands of years ago. Recorded observations of sea ice date to the time of the first European exploration of the polar regions, taken from on the ice or from ships, as early as the 1600s. Antarctic observations are more recent, with little data before the early 1900s. The advent of aircraft brought the ability to do aerial reconnaissance, and this, along with ship observations, provided the basis for early sea-ice charts that date back to the 1920s in some regions (Walsh et al. 2017). Beginning in the mid-1960s, early satellite data from visible and infrared sensors provided the first views of sea ice from space (Meier et al. 2013). Other satellite sensors provided intermittent coverage through the mid-1970s. However, the modern satellite record began with the advent of multi-frequency passive microwave sensors, beginning with the launch of the Scanning Multichannel Microwave Radiometer (SMMR) on the NASA Nimbus-7 platform in October 1978. SMMR was succeeded by a series of similar instruments on U.S. Defense Department platforms that continue to operate today.
Passive microwave sensors are particularly useful for polar sea ice (Steffen et al. 1992). First, they sense the Earth's emitted microwave radiation, and thus, unlike visible sensors, they do not rely on solar illumination. Second, the frequencies employed are generally transparent to clouds. This allows for retrieval of sea-ice information in all sky conditions, including through clouds and in darkness. The sensors view the polar regions at least once per day, except for a region surrounding the pole (the size of which has varied over time). This has provided a near-complete and continuous record of sea-ice concentration and extent for over 40 years. There are some limitations to passive microwave records of sea ice. The spatial resolution is relatively low over much of the record, on the order of 25 km. Also, retrievals can be biased in some conditions, particularly summer melt, thin/new ice, and near the ice edge. Nonetheless, the data are robust for hemispheric or regional assessments of the sea-ice cover (e.g. Parkinson and DiGirolamo 2021; Comiso et al. 2017).
 |
|
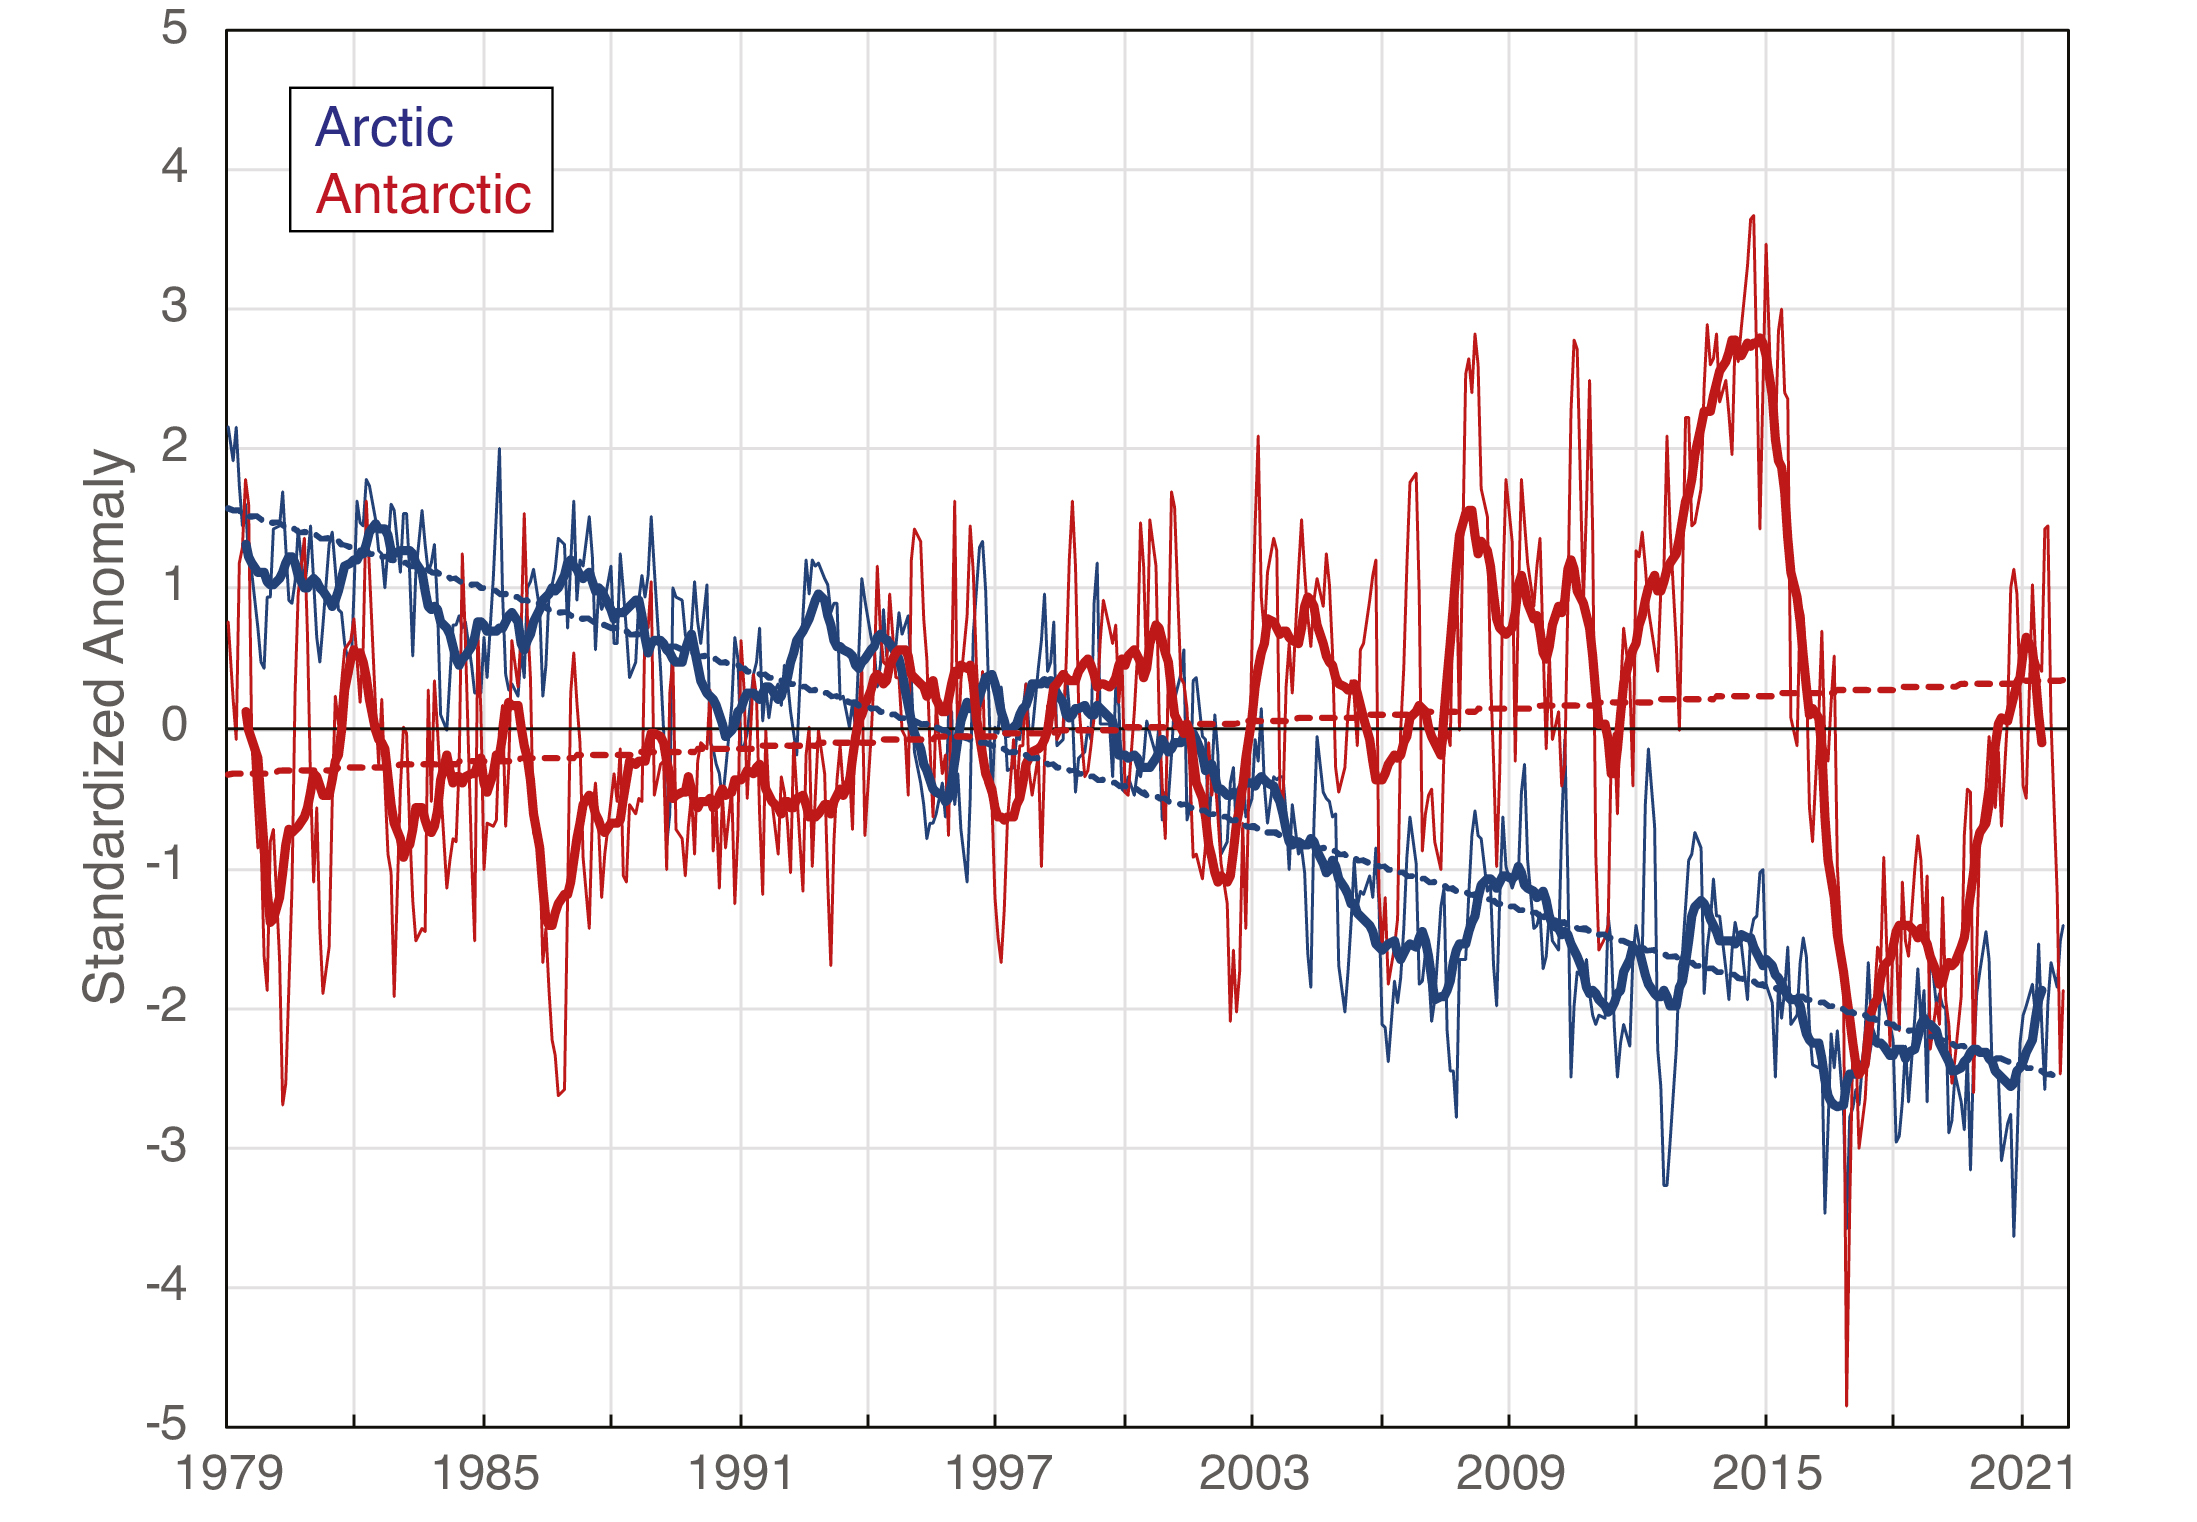
Figure 1: Monthly standardized sea-ice extent anomalies (thin solid lines) for the Arctic (blue) and Antarctic (red) for January 1979 through December 2021 (x-axis) with 12-month running averages (thick solid lines) and trend (dashed lines). Data from the NSIDC Sea Ice Index (Fetterer et al. 2017). |
Sea-ice concentration and extent trends
The most common climate indicators from sea ice are concentration and extent. Concentration is the fraction coverage (usually in percent) of ice in a given region. Extent is the total area that is covered by ice above a given concentration threshold (often 15%, as is used here); using a threshold ameliorates the effect of the concentration bias due to melt and thin ice.
Here we use estimates from the NSIDC Sea Ice Index (Fetterer et al. 2017), based on the NASA Team algorithm (Cavalieri et al. 1984), to examine changes in the sea-ice cover during the passive microwave satellite record. First, we present trends in monthly average extent over the full 43-year record January 1979 through December 2021. We use a standardized anomaly approach, where the monthly anomalies (relative to the 1981 to 2010 climatology) are normalized by the standard deviation for each month (over the climatology period). This approach accounts for the large seasonal variation in extent through the year. The extent trends (Fig. 1) illustrate the difference between the Arctic and Antarctic sea-ice evolution over the satellite record. While there is interannual variability in the Arctic sea-ice extent, there is a clear downward trend. In contrast, the Antarctic has a small upward trend in extent, but with high interannual variability. Particularly notable in the Antarctic is a sharp drop between 2015 and 2017, where the anomaly went from a record high in the satellite record to a record low; this has been associated with changes in atmospheric circulation (Wang et al. 2019).
The contrast is also evident in extent trends for individual months. For example, the Arctic extent trend (±2 standard deviations) is -39,800 ± 6,300 km2/yr for March and -81,100 ± 13,000 km2/yr for September. Both of these months, and indeed all months, are statistically significant at the p < 0.05 level. In contrast, the Antarctic extent trend is +7,900 ± 13,300 km2/yr for March and +8,700 ± 10,100 km2/yr for September. The monthly trends for the Antarctic are either not significant at the p < 0.05 level or only marginally significant.
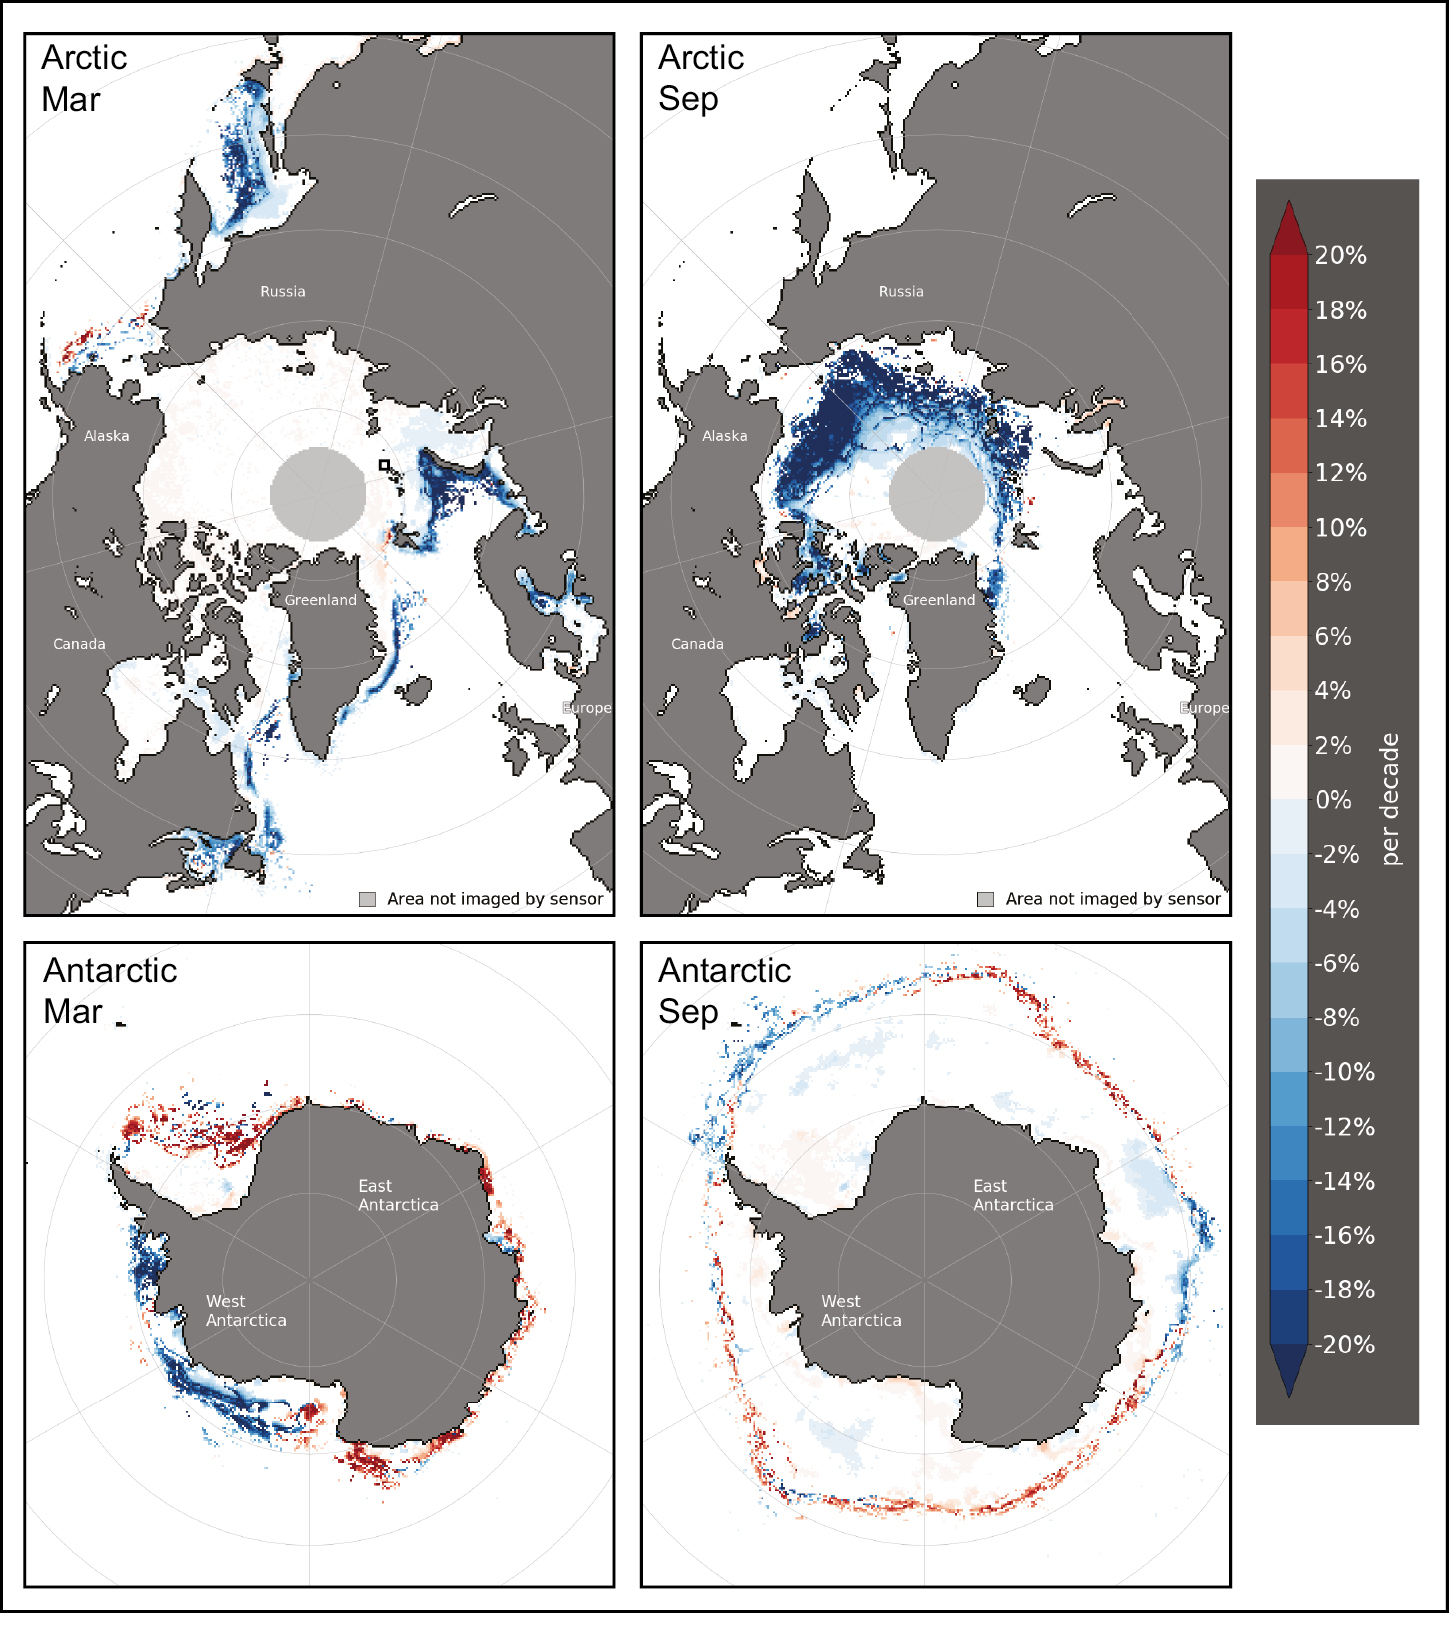
The spatial distribution of the changes in the sea-ice cover are also distinctly different between the north and the south, as seen in concentration trends (Fig. 2). The Arctic shows decreasing concentration in virtually all regions where there is interannual variability. In the Antarctic, some regions show an increase in concentration, while others show a decrease, consistent with the near-zero overall extent trends.
 |
|
Figure 2: Concentration trends (% per decade) for the Arctic and Antarctic for March and September. Only trends at the p < 0.05 significance level are shown. Adapted from the NSIDC Sea Ice Index (Fetterer et al. 2017). |
Sea-ice age and thickness
Sea-ice extent and concentration data provide information about the surface of the ice, but these are only a partial indication of changes in the ice cover. What is missing is the third dimension: thickness and volume. Unfortunately, long-term data on thickness and volume are limited, with only intermittent and sparse thickness measurements from submarine sonars or drill holes at field camps. The longest complete records, starting in the early 1980s, rely on proxy estimates using ice type or ice age and are typically only available for the Arctic. Older ice is generally thicker ice, so changes in the age of the ice indicate changes in thickness. One such age product indicates a nearly complete loss of Arctic ice older than four years (Tschudi et al. 2020). Such ice once comprised over 30% of the Arctic Ocean in the mid-1980s, but now covers less than 5% of the region.
More recently, satellite altimeters have facilitated direct estimates of thickness (e.g. Petty et al. 2020; Laxon et al. 2013). The algorithms to derive thickness from the surface elevation data are still not completely mature, and there are potentially large uncertainties, particularly due to lack of information on the overlying snow cover. However, the data can now provide reasonable estimates of interannual variability and trends in Arctic thickness and volume. Since 2003, a substantial thinning of the ice cover has been observed (e.g. Kacimi and Kwok 2022), which is consistent with the loss of the older ice types. Augmenting the satellite data with earlier submarine data shows a long-term loss of thickness since the 1970s (Kwok 2018).
Unfortunately, due to the nature of Antarctic sea ice (thinner ice, thicker snow cover, substantial melt), altimetry data are not reliable, and tracking of age is less effective. So, there is little information on sea-ice age or thickness trends. However, because much of the Antarctic sea-ice cover is seasonal (i.e. melts completely each summer) and the trends in extent and concentration are small, changes in thickness and volume are likely similarly small.
Summary
Over the period of the continuous satellite record, Antarctic sea ice is marked by regional and interannual variability, with minimal trends in the ice cover. In contrast, Arctic sea-ice extent and concentration are significantly decreasing throughout the region; the ice is thinning, and older ice types are disappearing. In short, Arctic sea ice is an environment in transformation. It is undergoing changes far beyond natural variability in response to increases in temperature. If such warming trends continue, it is likely that the Arctic Ocean will become largely seasonally ice-free in the coming decades.
affiliation
National Snow and Ice Data Center, Cooperative Institute for Research in Environmental Sciences, University of Colorado, Boulder, USA
contact
Walter N. Meier: walt colorado.edu
references
Cavalieri DJ et al. (1984) J Geophys Res 89: 5355-5369
Comiso JC et al. (2017) J Geophys Res 122: 6883-6900
Kacimi S, Kwok R (2022) Geophys Res Lett 49: e2021GL097448
Kwok R (2018) Env Res Lett 13: 105005
Laxon SW et al. (2013) Geophys Res Lett 40: 732-737
Meier WN et al. (2013) Cryosphere 7: 699-705
Parkinson CL, DiGirolamo NE (2021) Rem Sens Environ 267: 112753
Petty AA et al. (2020) J Geophys Res 125: e2019JC015764
Tschudi MA et al. (2020) Cryosphere 14: 1519-1536