- Home
- Publications
- PAGES Magazine
- Understanding Differences In Antarctic Sea-ice-extent Reconstructions In The Ross, Amundsen, and Bellingshausen Seas Since 1900
Understanding differences in Antarctic sea-ice-extent reconstructions in the Ross, Amundsen, and Bellingshausen seas since 1900
Fogt RL, Dalaiden Q & Zarembka MS
Past Global Changes Magazine
30(22)
74-75
2022
Antarctic sea-ice-extent reconstructions provide needed historical context to the large variability depicted in the short satellite observations. However, it is important to be mindful of their uncertainties, especially when comparing reconstructions based on paleoclimatological and instrumental data.
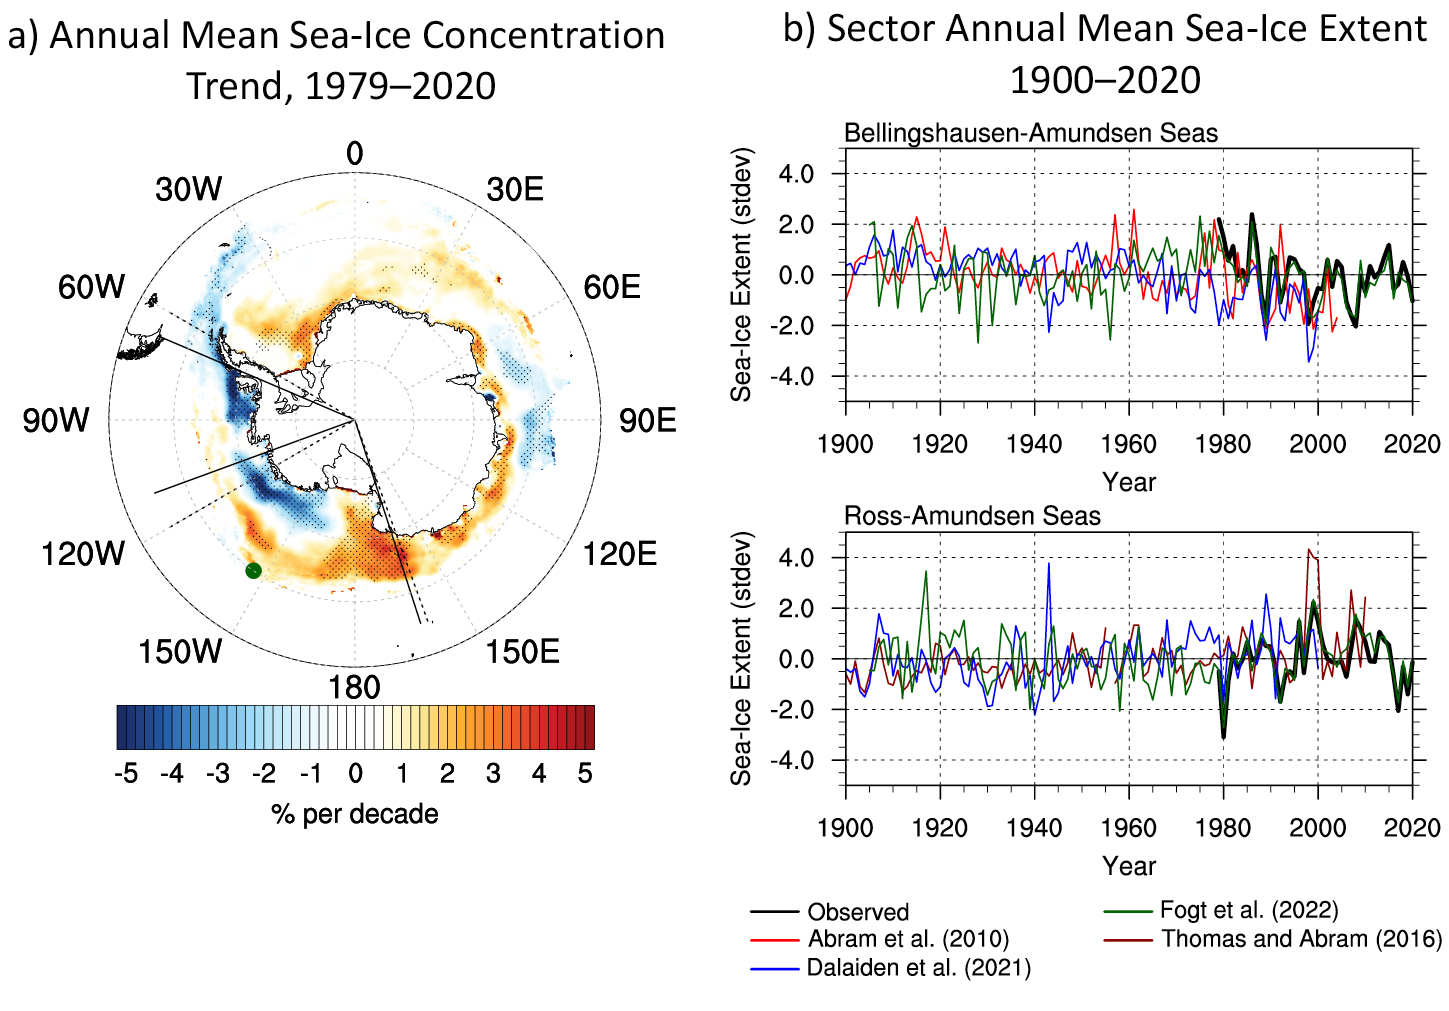
The South Pacific sector of the Antarctic coastline, consisting of the (moving east from the dateline) Ross, Amundsen, and Bellingshausen seas, has demonstrated some of the strongest trends in Antarctic sea-ice extent since the satellite era (1979; Parkinson 2019). The annual mean sea-ice concentration trends (expressed as % per decade) from 1979–2020 (Fig. 1a) show statistically significant increases in the western Ross Sea and decreases in the Bellingshausen Sea near the Antarctic Peninsula. Even with significant trends, these regions are marked with strong interannual sea-ice variability partly influenced by teleconnections from the tropics (Holland and Kwok 2012; Meehl et al. 2016; Purich et al. 2016).
To help place the trends depicted by the short time period of satellite observations in a longer historical context, several sea-ice reconstructions for the South Pacific sector based on both paleoclimatological records and instrumental observations have been created. Abram et al. (2010) used the chemical information from an ice core from the Antarctic Peninsula to reconstruct the annual sea-ice edge in the Bellingshausen Sea (70°W–110°W) in the years 1900–2004. Similarly, a later study by Thomas and Abram (2016) reconstructed the annual mean sea-ice edge at 146°W for the years 1702–2010, marked as a green dot in Figure 1a.
To understand processes behind the sea-ice-extent changes on longer timescales, Dalaiden et al. (2021) combined ice-core and tree-ring-width records with an Earth system model through a data assimilation method to provide annual historical estimates of not only sea-ice extent and concentration, but also the atmospheric circulation (temperature, pressure, winds) during the years 1800–2000. More recently, Fogt et al. (2022) reconstructed seasonal sea-ice extent in the sectors from Raphael and Hobbs (2014) from 1905–2020 using a principal component regression technique that employed observations of pressure and temperature across the Southern Hemisphere, and indices from leading modes of climate variability known to influence Antarctic sea-ice extent. Despite the potential to increase the understanding of historical sea-ice variations from these reconstructions, Fogt et al. (2022) noted a very weak interannual correlation between these datasets, making it challenging to know the reliability and usefulness of each dataset; yet understanding these uncertainties and differences is fundamental to ensure a correct application of the reconstructions.
South Pacific Antarctic sea-ice extent since 1900
Figure 1b shows the annual mean (approximately related to the August–October values for the Abram et al. (2010) reconstruction) sea-ice reconstructions for the Amundsen–Bellingshausen seas (top panel) and Ross–Amundsen seas, along with satellite observations. Importantly, the Fogt et al. (2022) reconstruction was explicitly calibrated to the satellite observations, so it is not surprising that it agrees the best with the observed values in both regions. In contrast, the Dalaiden et al. (2021) reconstructions are not calibrated to observations, but rather are extracted (here, using the Raphael and Hobbs (2014) sectors) from the climate model simulation that is guided by paleoclimatological data. These differences in methodology certainly contribute to the differences among the various reconstructions, since there is more agreement between the paleo-based reconstructions (all except Fogt et al. 2022) than between the paleo-based and instrument-based (only Fogt et al. 2022) reconstructions.
Nonetheless, the recent changes are captured to varying degrees by all the reconstructions, showing decreases after 1979 in the Amundsen–Bellingshausen seas, and increases in the Ross-Amundsen seas (Fig. 1b). Prior to 1979, however, there are notable differences in the average sea-ice conditions, with opposite behavior between the paleo-based and Fogt et al. (2022) reconstructions. In the Amundsen–Bellingshausen seas, the paleo-based reconstructions frequently indicate above average sea-ice extent in the early-to-mid 20th century, whereas the Fogt et al. (2022) reconstruction indicates below average sea-ice extent during this time (Fig. 1b, top). The variability is opposite in the Ross-Amundsen seas: here the paleo-based reconstructions frequently indicate below average sea-ice extent in the early-to-mid 20th century, while the Fogt et al. (2022) reconstruction indicates above average sea-ice extent prior to the onset of satellite observations (Fig. 1b, bottom). Perhaps surprisingly, the correlations with observed sea-ice concentration are all fairly similar spatially (not shown), which suggests that the various regions represented by each reconstruction is a smaller contributing factor to the disagreement in the reconstructions.
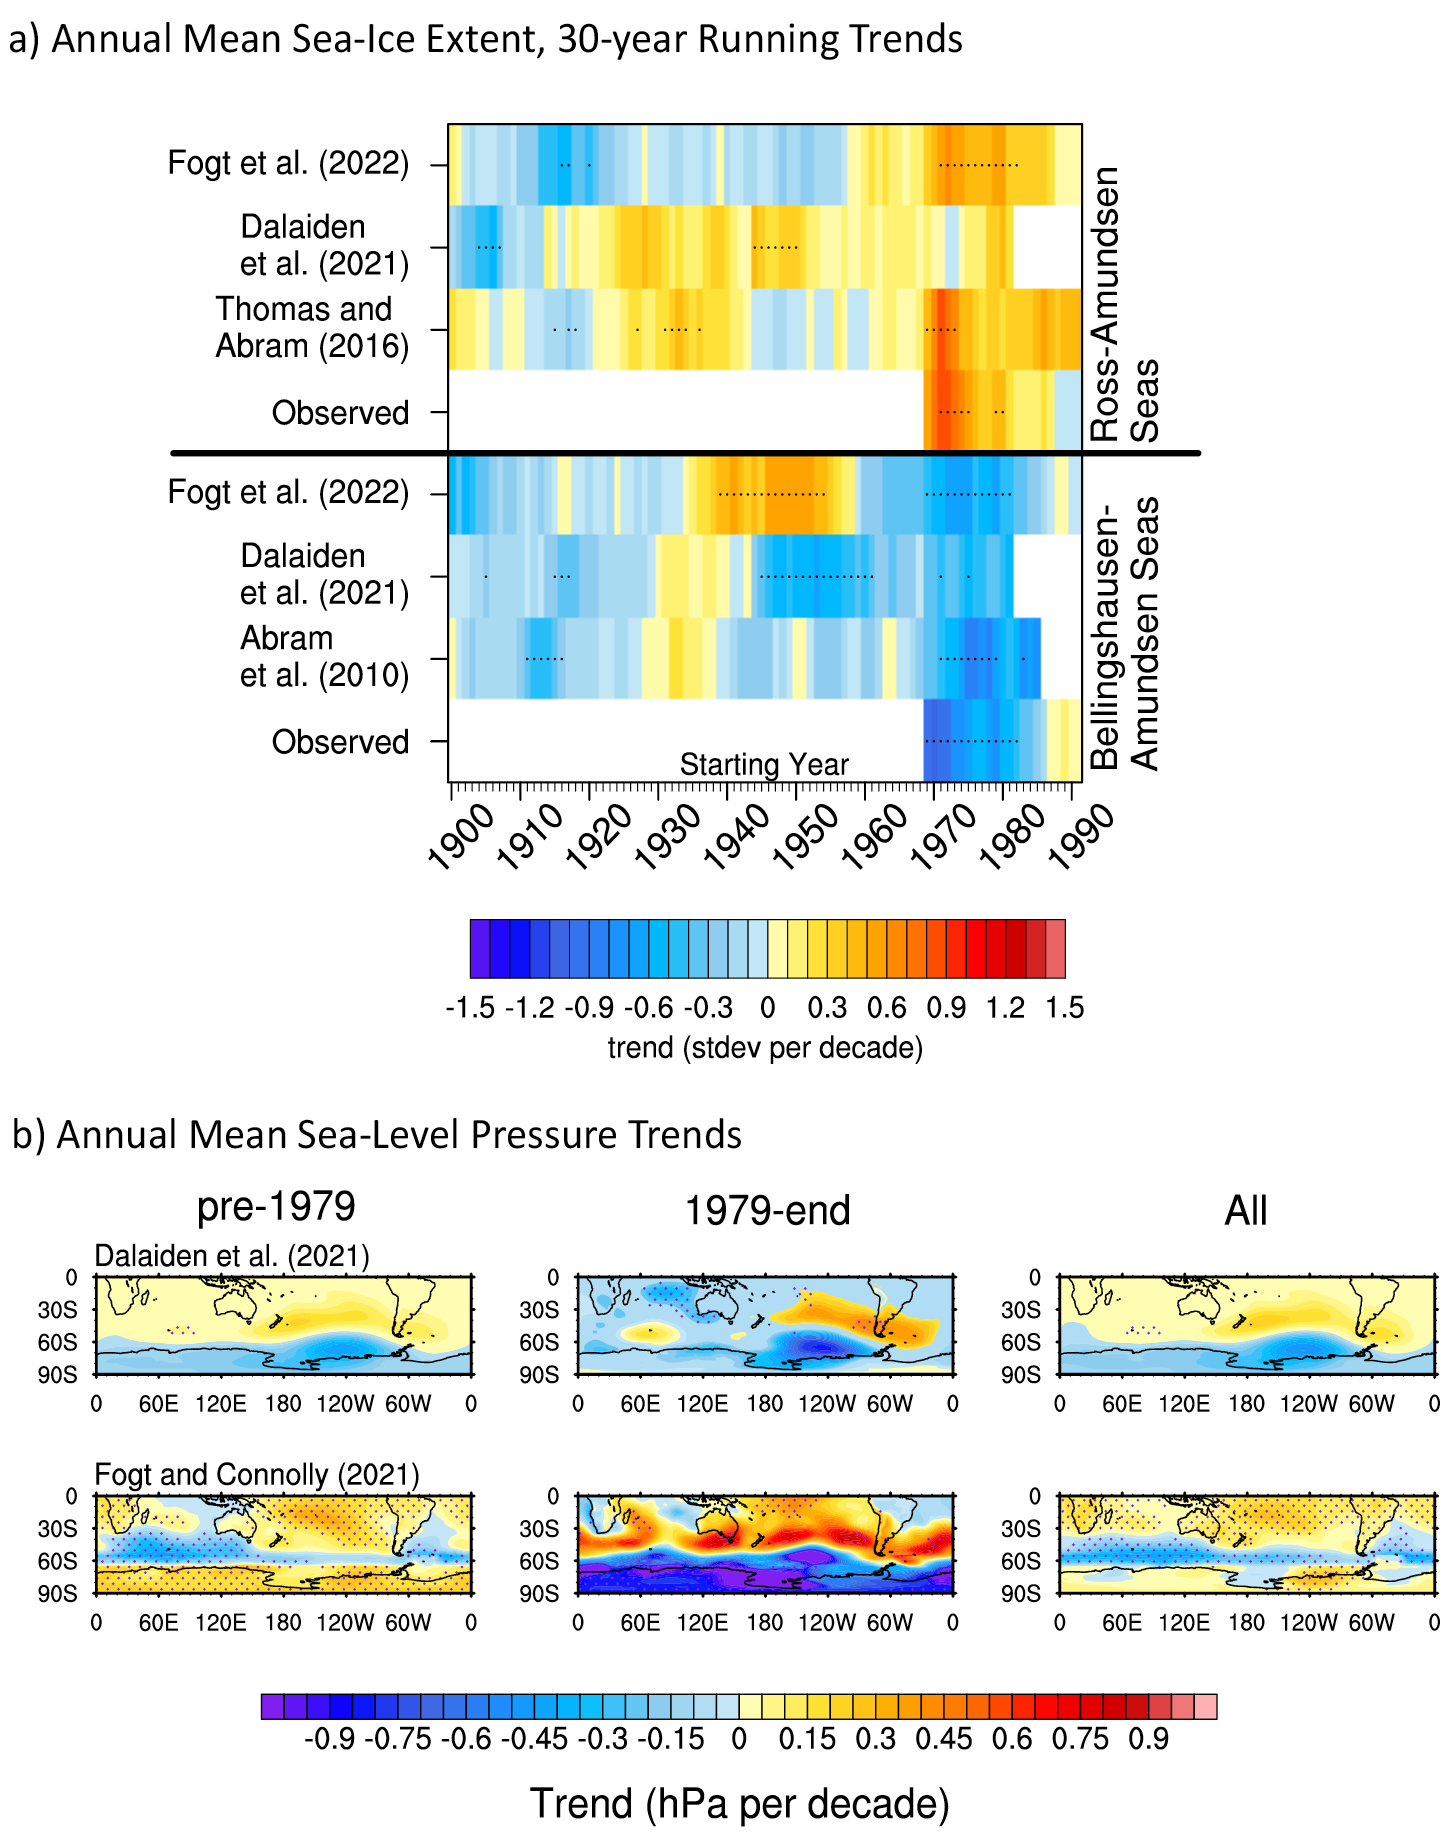
To highlight the differences further, 30-year running trends of the annual mean reconstructions are provided in Figure 2a. Notably, the paleo-based reconstructions all suggest that the sign (and often statistical significance) of the observed trends for the two regions continue throughout the 20th century. In contrast, the Fogt et al. (2022) trends indicate a change in the sign (and often statistical significance) of the trends prior to 1979.
The role of atmospheric circulation
Since Dalaiden et al. (2021) reconstructed the historical changes of the atmosphere, it is possible to also investigate changes in the atmospheric circulation in relation to sea-ice trends. Additionally, Fogt and Connolly (2021) provide another pressure dataset, which employs a seasonal, spatially complete reconstruction poleward of 60°S (Fogt et al. 2019) and the National Oceanic and Atmospheric Administration 20th-century reanalysis (Slivinski et al. 2019) equatorward of 60°S. Importantly, the Fogt and Connolly (2021) merged pressure dataset avoids large artificial trends in other datasets over Antarctica prior to 1957 and, therefore, likely provides a more robust estimate of 20th-century pressure trends (Fogt and Connolly 2021). Annual sea-level pressure trends from the two datasets are displayed in Figure 2b. In agreement with the sea-ice trends, the pressure trends from Dalaiden et al. (2021) are the same throughout the 20th century, although not statistically significant prior to 1979. In contrast, but consistent with the instrument-based sea-ice reconstructions of Fogt et al. (2022), the pressure trends in the merged pressure dataset from Fogt and Connolly (2021) show a reversal in pressure trends across Antarctica before and after 1979. Since a large portion of the Antarctic sea-ice extent in this region is driven by the atmospheric circulation, Figure 2b demonstrates that changes in the atmospheric circulation give rise to the differences between the Fogt et al. (2022) reconstructions and those derived from paleoclimatological data.
Discussion
Further work is planned to better understand the origin of these differences, with particular attention paid to the atmospheric circulation reconstruction. In contrast with the paleo-based reconstruction, the instrument-based reconstruction strongly relies on large-scale climate patterns depicted in the observations, but may not fully represent the regional and highly variable Antarctic weather that may be better captured by ice cores closer to the Antarctic sea-ice edge. Therefore, the impact of the geographical locations of the observations used in the reconstructions will be analyzed through several sensitivity experiments by including additional records, such as the near-surface air temperature and surface-pressure records from Antarctic weather stations – available since 1958 – and coral records situated in the tropical Pacific. These sensitivity experiments will aid in unlocking the contribution to regional Antarctic sea-ice variations from large-scale teleconnections, including tropical teleconnections, which have been demonstrated to play a substantial role in the Antarctic climate over the instrumental period (Holland and Kwok 2012; Meehl et al. 2016; Purich et al. 2016) on much longer timescales.
affiliations
1Department of Geography and Scalia Laboratory for Atmospheric Analysis, Ohio University, Athens, USA
2Université catholique de Louvain (UCLouvain), Earth and Life Institute (ELI), Louvain-la-Neuve, Belgium
3Fonds de la Recherche Scientifique FRS-FNRS, Brussels, Belgium
contact
Ryan Fogt: fogtr ohio.edu
references
Abram NJ et al. (2010) J Geophys Res 115: D23101
Dalaiden Q et al. (2021) Clim Dyn 57: 3479-3503
Fogt RL, Connolly CJ (2021) J Clim 34: 5795-5811
Fogt RL et al. (2019) Clim Dyn 53: 1435-1452
Fogt RL et al. (2022) Nat Clim Chang 12: 54-62
Holland PR, Kwok R (2012) Nat Geosci 5: 872-875
Meehl GA et al. (2016) Nat Geosci 9: 590-595
Parkinson CL (2019) Proc Natl Acad Sci USA 116: 14,414-14,423
Purich A et al. (2016) J Clim 29: 8931-8948
Raphael MN, Hobbs W (2014) Geophys Res Lett 41: 5037-5045
Slivinski LC et al. (2019) Q J R Meteorol Soc 145: 2876-2908


