Past and future contexts for climate and water-cycle variability, and consequences for the biosphere
Pascale Braconnot1 and Françoise Vimeux1,2
The Earth's climate has changed in the past and is expected to continue to change in the future with implications for water resources, ecosystems, and human societies. Climate models are now reaching a level of complexity that makes them more useful to understand the linkages between climate and environment, and to connect global and regional changes.
Temperature projections for the 21st century
Human activity, by modifying the atmospheric composition (greenhouse gases and aerosols) and the land surface (agriculture and deforestation), affects the Earth's energetics. Future perturbations are characterized by Representative Concentration Pathways (RCPs) indicating the amount of energetic change by 2100. Simulations with climate models able to predict the evolution of the climate system on timescales of seasons to decades and longer have become references to inform decisions regarding adaptation and mitigation. Temperature projections exhibit robust spatial patterns and consistent upward evolution over the 21st century. They all show a gradual increase in temperature everywhere, regardless of which RCPs are considered, with more pronounced changes in high latitudes than in the tropics. In all projections, the magnitude of changes after 2050 depends on the future greenhouse gas emissions and changes in land use. Note that uncertainties associated with model output for a given emission pathway are actually lower than the uncertainties concerning the evolution of human activities.
 |
|
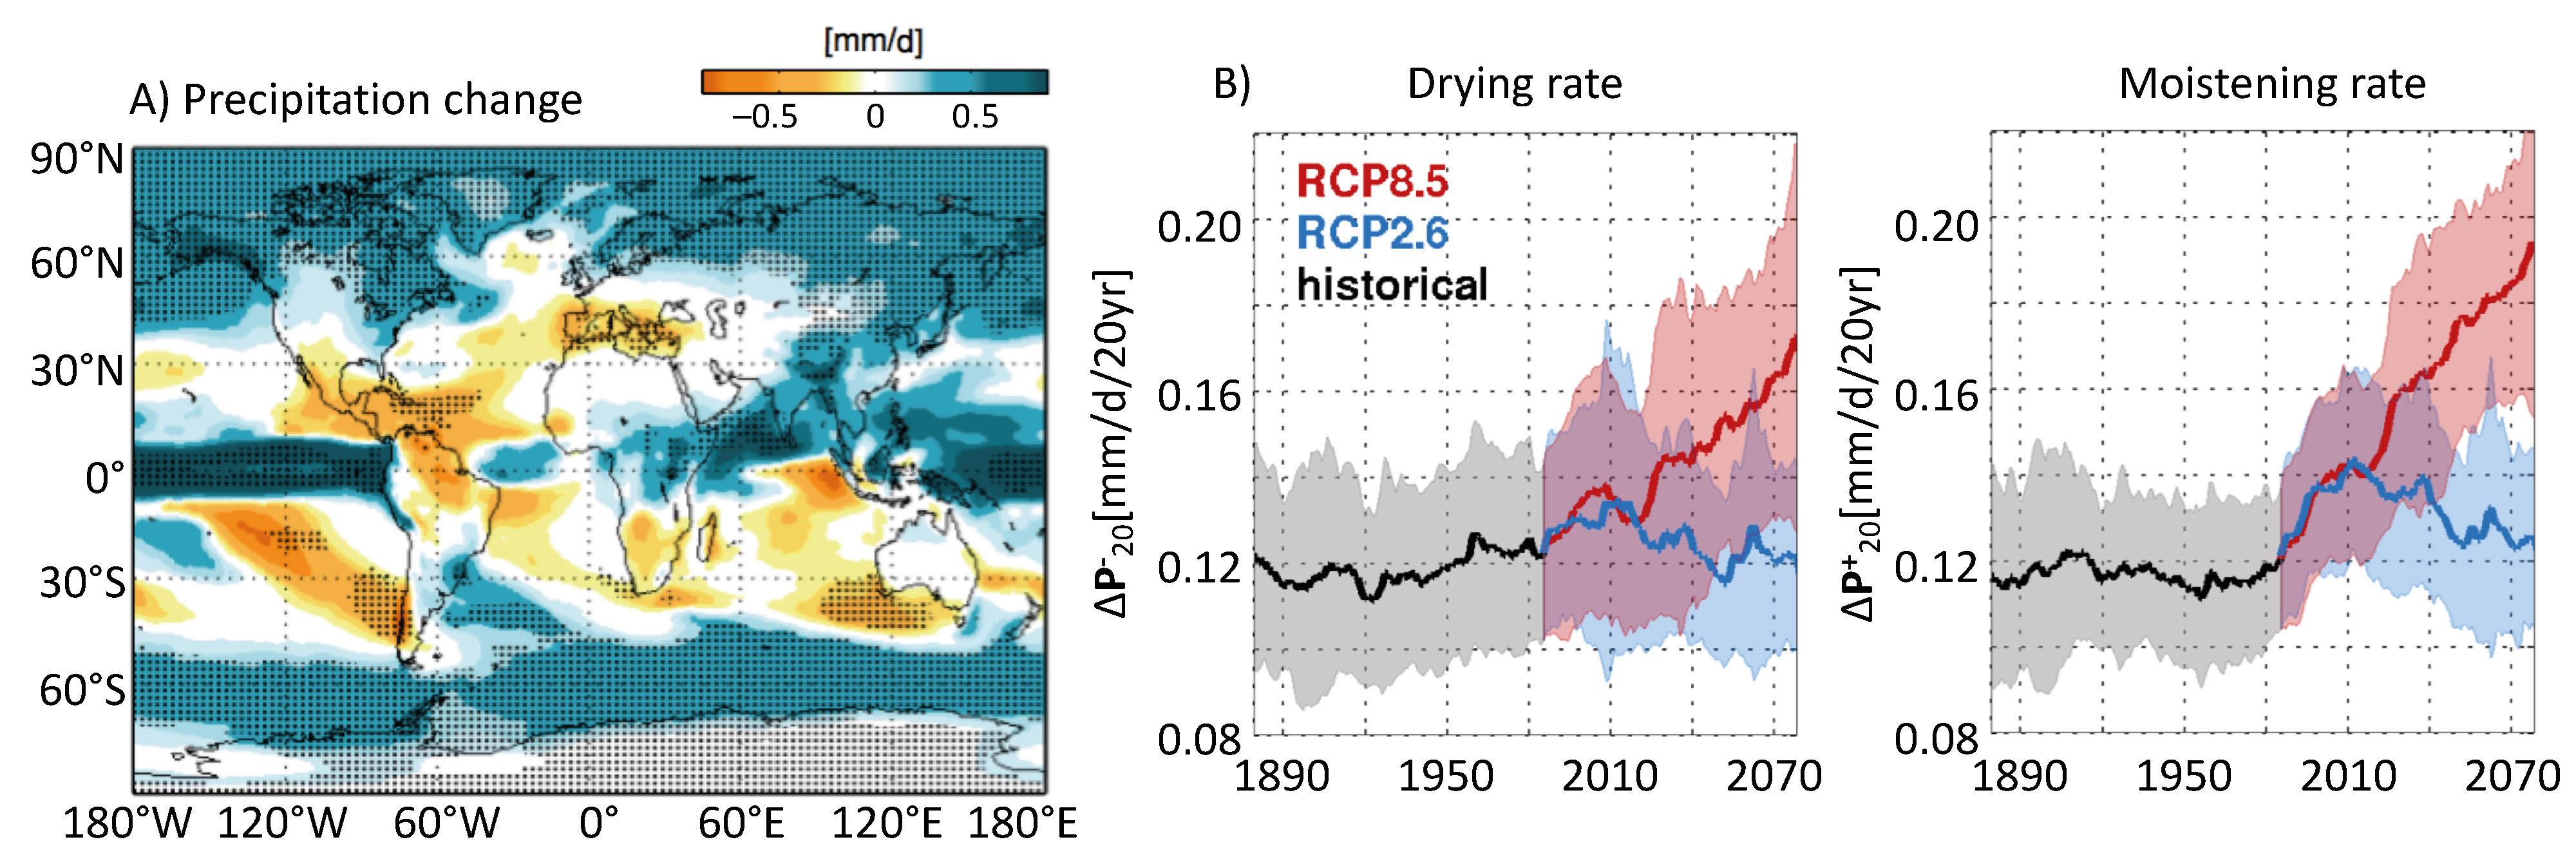
Figure 1: (A) Multi-model ensemble mean of the absolute change of annual mean precipitation (in mm/day) between the end of the 20th century (1986-2005) and the end of the 21st century (2081-2100) for RCP 8.5. When dots are drawn, 90% of models agree on the sign of the change and the later exceeds at least two times the internal variability; (B) Multi-model ensemble mean evolution of the drying (left) and moistening (right) precipitation rate (mm/day per 20 years). The number of runs is given in parenthesis. Adapted from Chavaillaz et al. (2016). |
Precipitation projections for the 21st century
While water vapor increases in the atmosphere by about 7% for each degree Celsius of warming, following the Clausius-Clapeyron thermodynamic law, global precipitation is estimated to increase at a lower rate of about 3%/°C (Collins et al. 2013). This precipitation trend simulated over the 21st century is associated with large spatial disparities as shown in Fig. 1a (Chavaillaz et al. 2016). Globally, we observe an increasing contrast between regions of moisture convergence and divergence: additional precipitation is expected in tropical and mid-to-high latitudes (up to 50% more compared to the end of the 20th century), whereas less precipitation is simulated in subtropics. This arises from atmospheric thermodynamics and changes in the atmospheric dynamics that lead to the counterintuitive result of increasing heat export from the tropics associated with a slowdown of the Hadley-Walker circulation (Chadwick et al. 2013). Some regions also exhibit more pronounced trends, such as the drying of the Mediterranean area (by as much as 30% less precipitation).
Still positive, the rate of precipitation changes throughout the 21st century clearly depends on the RCPs (Fig. 1b). Under RCP 2.6 (the strongest mitigation pathway), the rate of the precipitation change stabilizes both in drying and moistening regions, and even reduces at the end of the 21st century to return to historical values. In contrast, for RCP 8.5 (considered as the "business-as-usual" emission pathway), the rate of the precipitation change continuously increases during the 21st century (Fig. 1b), both in drying and moistening regions, leading to a doubling of the rate of change in mean precipitation by 2080. This reflects an acceleration of precipitation changes regardless if it is in a drying or a moistening region. As a consequence of small discrepancies between precipitation rate in moistening and drying regions (Fig. 1b), the fraction of moistening regions changes during the 21st century: under RCP 8.5, it tends to increase slightly by a few percent and to stabilize in the mid-21st century whereas under RCP 2.6, moistening region area clearly decreases by almost 10% by 2080.
In addition, as stated in the 5th Assessment Report of the IPCC (IPCC 2013), there are regions and climate variables for which model projections remain particularly uncertain. This is the case for tropical precipitation projections, which are critically important for assessing the social impacts of climate change (tropical areas are among the most populated and the most vulnerable regions of the world), but for which no consensus emerges among climate models (Meehl and Washington 2012). The large spread among models illustrates important differences in climate sensitivity and biases (Dufresne and Bony 2008). Over tropical continents, not only the magnitude of the changes differs among models but also their sign (e.g. Douville et al. 2006; Sun et al. 2007; IPCC 2013).
As a consequence of climate change, vegetation is also expected to evolve during the 21st century with a potential decrease of the forest cover (e.g. in the tropics) or increase (e.g. in high latitudes). As a consequence of the expected climate change, some plant species are also expected to expand northward and towards higher altitudes with a modified growth season (e.g. Harsch et al. 2009; Savage and Vellend 2015; Pecl et al. 2017). Furthermore, simulations with interactive vegetation have confirmed the observed biophysical feedbacks associated with large-scale changes in vegetation.
Future changes in relation to past changes
These rapid changes are part of a longer history that has shaped our modern environment, and for which the major forcing was not trace gases such as CO2 but changes in the incoming solar radiation at the top of the atmosphere related to slow changes in the Earth's orbit. The current generation of global climate models, such as the one used for the future climate projections presented above, can now be used to investigate the interplay between the long-term evolution of the external forcing, temperature, precipitation, and vegetation in different regions, though still in a simplified way (Braconnot et al. 2019; Dallmeyer et al. 2020). Figure 2 illustrates this long-term evolution. The IPSL climate model was only forced by Earth's orbital parameters and trace gases, ignoring human land use, volcanism, and solar irradiance variability. As it only considers natural vegetation, results cannot be fully compared to observations in the last part of the record.
 |
|
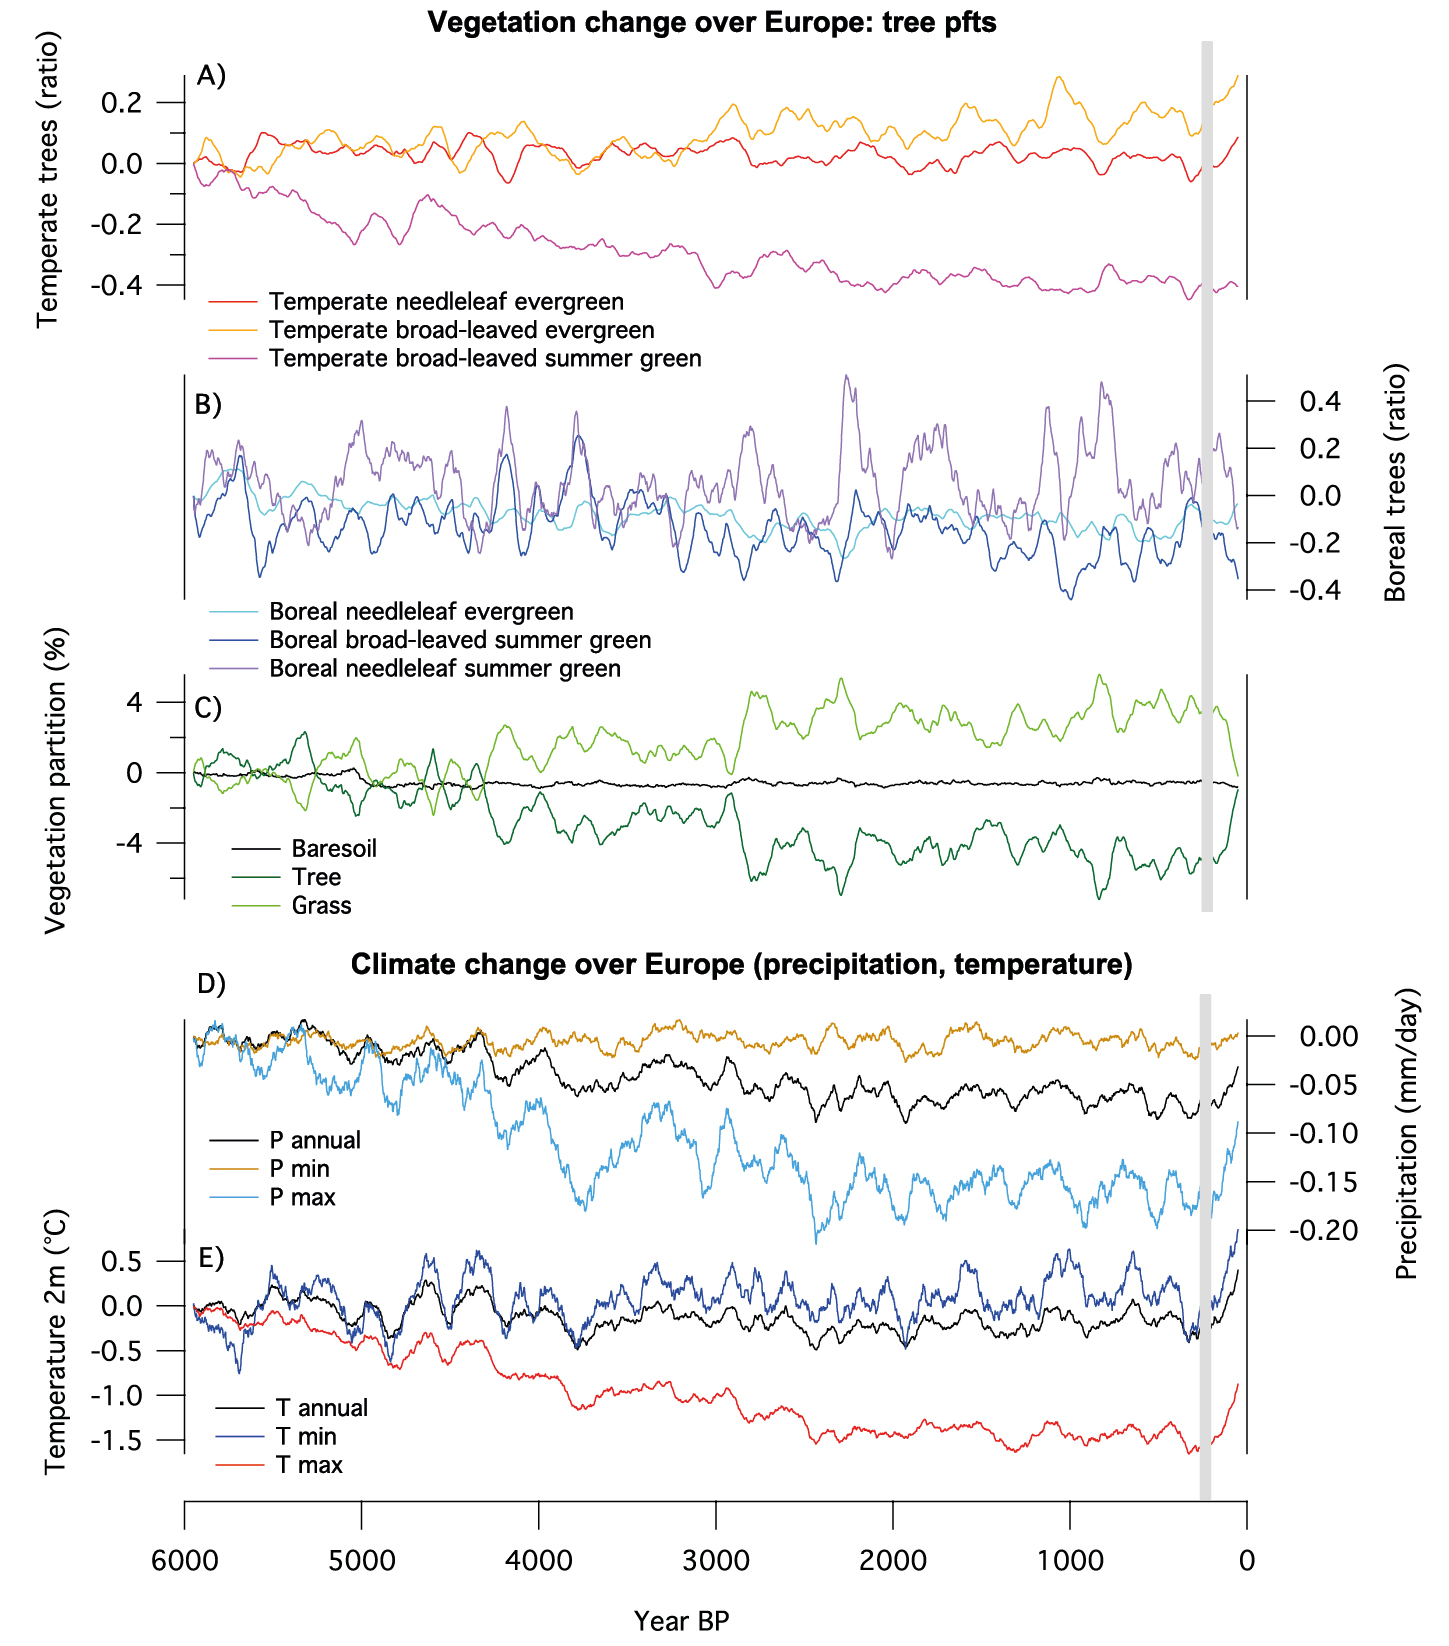
Figure 2: Evolution of climate conditions and vegetation over Europe, as simulated over the last 6000 years with the IPSL model. The different panels from top to bottom represent (A) the evolution of the temperate and (B) boreal tree fractions, expressed as a ratio to their initial cover; (C) parallel evolution of the total area (% of total land surface) covered by tree, grass, and bare soil, expressed as a deviation from the first 100-year average of the total area covered in the initial mid-Holocene state; (D) annual mean, annual monthly minimum (driest month), and annual monthly maximum (wettest month) precipitation (mm/day), and (E) annual mean, annual monthly minimum (coldest month), and annual monthly maximum (warmest month) 2-m air temperature. All curves have been smoothed by a 100-year running mean. The gray bar shows the pre-industrial period in 1750. |
Figure 2 clearly highlights the fact that despite the slow change in insolation forcing, the long-term trend in all variables is punctuated by substantial variability. The long-term temperature cooling is a direct response to the insolation forcing, associated with a simultaneous decrease of the tree fraction, which is consistent with paleo reconstructions over Europe (Davis et al. 2003; Marsicek et al. 2018; Mauri et al. 2015). These changes are associated with a long-term precipitation decrease that is well depicted in the reduction of both maximum monthly and annual mean precipitation (Fig. 2). This aridification is associated with a decrease in temperature seasonality induced by insolation and mainly driven by warmest-month temperature. The relationship between humidity, precipitation, and temperature changes discussed for future projections at global scale is only found when these variables are averaged over the Northern Hemisphere (Braconnot et al. 2019).
However, the pace of change varies with time, and the largest trends are found between about 5000 years BP and 3000 years BP. During the last 200 years of the simulation, the rapid increase of greenhouse gases (mainly CO2) induces rapid changes in climate variables and vegetation that counteract their long-term evolution; this represents about half of the signal for climate and, in the case of total tree cover, most of the signal for vegetation over Europe. This stresses the fact that the linkages between ecosystems and climate cannot simply be deduced from past trends behavior, and that major differences are expected in the interplay between climate and vegetation in the future, with many unknowns compared to past climate evolution.
Another important message is that periods of several decades or centuries are characterized by both large climate and vegetation variations. Even though most of the curves in Figure 2 exhibit similar large variations, there is no systematic correspondence in the relative magnitude and duration of the temperature and precipitation events, or between climate and vegetation fluctuations. One reason is that climate variations need to be large enough to cross a threshold and impact the environment, and that different types of ecosystems react to different thresholds. In this respect, the total tree fractions over Europe also mask different dynamics between the different tree plant functional types (pfts). The different simulated pfts provide a more dynamic view of changes in ecosystem diversity. In this simulation, only the temperate broad-leaved summer green tree pft declines with time, whereas the other pfts show a more chaotic behavior and do not systematically exhibit synchronous variability. They respond differently to the different events, depending on their sensitivity to temperature or precipitation or to specific patterns of climate events over Europe that may or may not affect their geographical range.
Even though such long simulations are still imperfect, and model biases are large and prevent detailed explanations of reconstructed changes, they highlight the different spatio-temporal scale that need to be accounted for to properly anticipate future climate change. Introduction of land use is also an important factor to better characterize the Holocene impact of human activity in addition to the rapid increase in greenhouse gases. This additional human effect is modifying regional climate characteristics (Harrison et al. 2020). Ensembles of such long simulations will soon be available to the community, providing new opportunities to understand the evolution of both the water cycle and ecosystems.
affiliations
1Institut Pierre Simon Laplace (IPSL), Laboratoire des Sciences du Climat et de l'Environnement (LSCE), Gif-sur-Yvette, France
2Institut de Recherche pour le Développement, Laboratoire HydroSciences Montpellier, France
contact
Pascale Braconnot: pascale.braconnot lsce.ipsl.fr
references
Braconnot P et al. (2019) Clim Past 15: 997-1024
Chadwick R et al. (2013) J Clim 26:3803-3822
Chavaillaz Y et al. (2016) Clim Dyn 47: 951-965
Dallmeyer A et al. (2020) Clim Past 16: 117-140
Davis BAS et al. (2003) Quat Sci Rev 22: 1701-1716
Douville H et al. (2006) Clim Dyn 26: 367-385
Dufresne J-L, Bony S (2008) J Clim 21: 5135-5144
Harrison SP et al. (2020) Geosci Model Dev 13: 805-824
Harsch MA et al. (2009) Ecol Lett 12: 1040-1049
IPCC (2013) Climate Change 2013: The Physical Science Basis. Cambridge University Press, 1535 pp
Marsicek J et al. (2018) Nature 554: 92-96
Mauri A et al. (2015) Quat Sci Rev 112: 109-127
Meehl G, Washington W (2012) J Clim 25: 3661-3683
Pecl GT et al. (2017) Science 355: eaai9214