Mapping ice microstructure: Advancements in Large Area Scanning Microscopy techniques
A. Lamott2,
S. Kipfstuhl
D. Dahl-Jensen
Microstructure of polar ice cores provides useful information about past climate conditions, improving our understanding of Earth's history and future climate changes. The development of automated imaging systems provides efficient and high-resolution insights into ice-core microstructure and its evolution.
Deep polar ice cores drilled in Greenland and Antarctica have been used to study the Earth’s past climate, the evolution of the ice microstructure through an ice sheet, and the processes that control ice flow. As snow accumulates and turns into ice, it begins to deform and flow under the weight of the overlying snow and ice. This process, known as glacial flow, is driven by a combination of gravity and the mechanical properties of the ice itself (Binder et al. 2013; Cuffey and Paterson 2010).
Microstructure analysis of ice cores provides valuable information on the evolution of the ice sheet over time. By studying the size, shape, and orientation of individual ice crystals, we learn about the processes that control ice flow, such as deformation and recrystallization. This information helps us better understand how ice sheets respond to changes in temperature and other environmental conditions.
Over the last few decades, significant advances in computing power and digital imaging techniques have revolutionized the way we study and analyze polar ice cores. These new tools enable us to perform tasks that were once considered unfeasible or extremely time consuming, such as processing and analyzing vast amounts of data or creating continuous high-resolution images of ice-core microstructures.
From still cameras to line scanner
Recent developments in microstructure mapping have seen significant improvements: from the use of traditional still cameras and optical microscopy methods to the use of computer-controlled microscopic imaging systems. Kipfstuhl et al. (2006) provided an overview of the evolution of microstructure mapping, and how the advances in computing power and digital imaging techniques have revolutionized the way we study and analyze polar ice cores.
Early studies, such as Arnaud et al. (1998) and Nishida and Narita (1996), used still cameras to capture images of microstructures in firn and bubbly ice. Optical microscopes were also used to gather statistical data on air bubbles (Bendel et al. 2013) and air hydrates in ice (Kipfstuhl et al. 2001; Lipenkov 2000; Uchida et al. 1994). However, the use of traditional still cameras and optical microscopes had limitations in terms of image quality control and systematic mapping of microstructures.
Kipfstuhl et al. (2006) improved the process of microstructure mapping by setting up and testing a computer-controlled microscopic imaging system. The aim was to streamline and automate the microscopic observation process, resulting in scanning an ice section with dimensions of 5–10 cm x 10 cm, and generating digital images at microscopic resolution within the hour, while drilling operations were still in progress.
While the initial goal of the system was air-bubble and air-hydrate studies, Kipfstuhl et al. (2006) found that after the ice-core surface was exposed to sublimation, the method was also able to record boundaries between the ice crystals (grain boundaries) as well as a wide variety of deformation-induced features.
The microstructure analysis of ice cores dates back to 1960 when studies conducted on Camp Century and Byrd ice cores from Greenland and Antarctica, respectively, focused primarily on average grain sizes and crystal orientations (Faria et al. 2014). Later, comprehensive grain-boundary studies by Kipfstuhl et al. (2006) and Weikusat et al. (2009) led the way to the development of the first Large Area Scanning Microscope (LASM) in industry by Schäfter & Kirchoff GmbH (S+K). Subsequently, Binder et al. (2013) and Binder (2014) introduced a specialized image analysis software capable of extracting and parameterizing grain-boundary networks from LASM images.
The LASM allows for a more efficient analysis of grain boundaries. Unlike the optical microscope that requires XY translation to capture and stitch together 1500 micrographs into a map, the LASM utilizes a line scan camera, which captures images line by line, instead of a whole picture at once, and covers a larger area in a single scan (Krischke et al. 2015). Although the LASM does not need thousands of micrographs, there is still a need to stitch tens of images to cover the length of a single core (55 cm). Moreover, both systems require manual focus adjustments due to variations in the ice-sample height (Binder 2014).
The LASM, together with the Image Microstructure Analyzer software developed by Binder et al. (2014), has excellent capabilities for reconstructing the grain boundaries of the ice. This enables a detailed analysis of the spatial arrangements and characteristics of the ice grains. However, the complex sample preparation process and computationally intensive software highlight the need for further enhancements to streamline ice-core microstructure analysis.
|
|
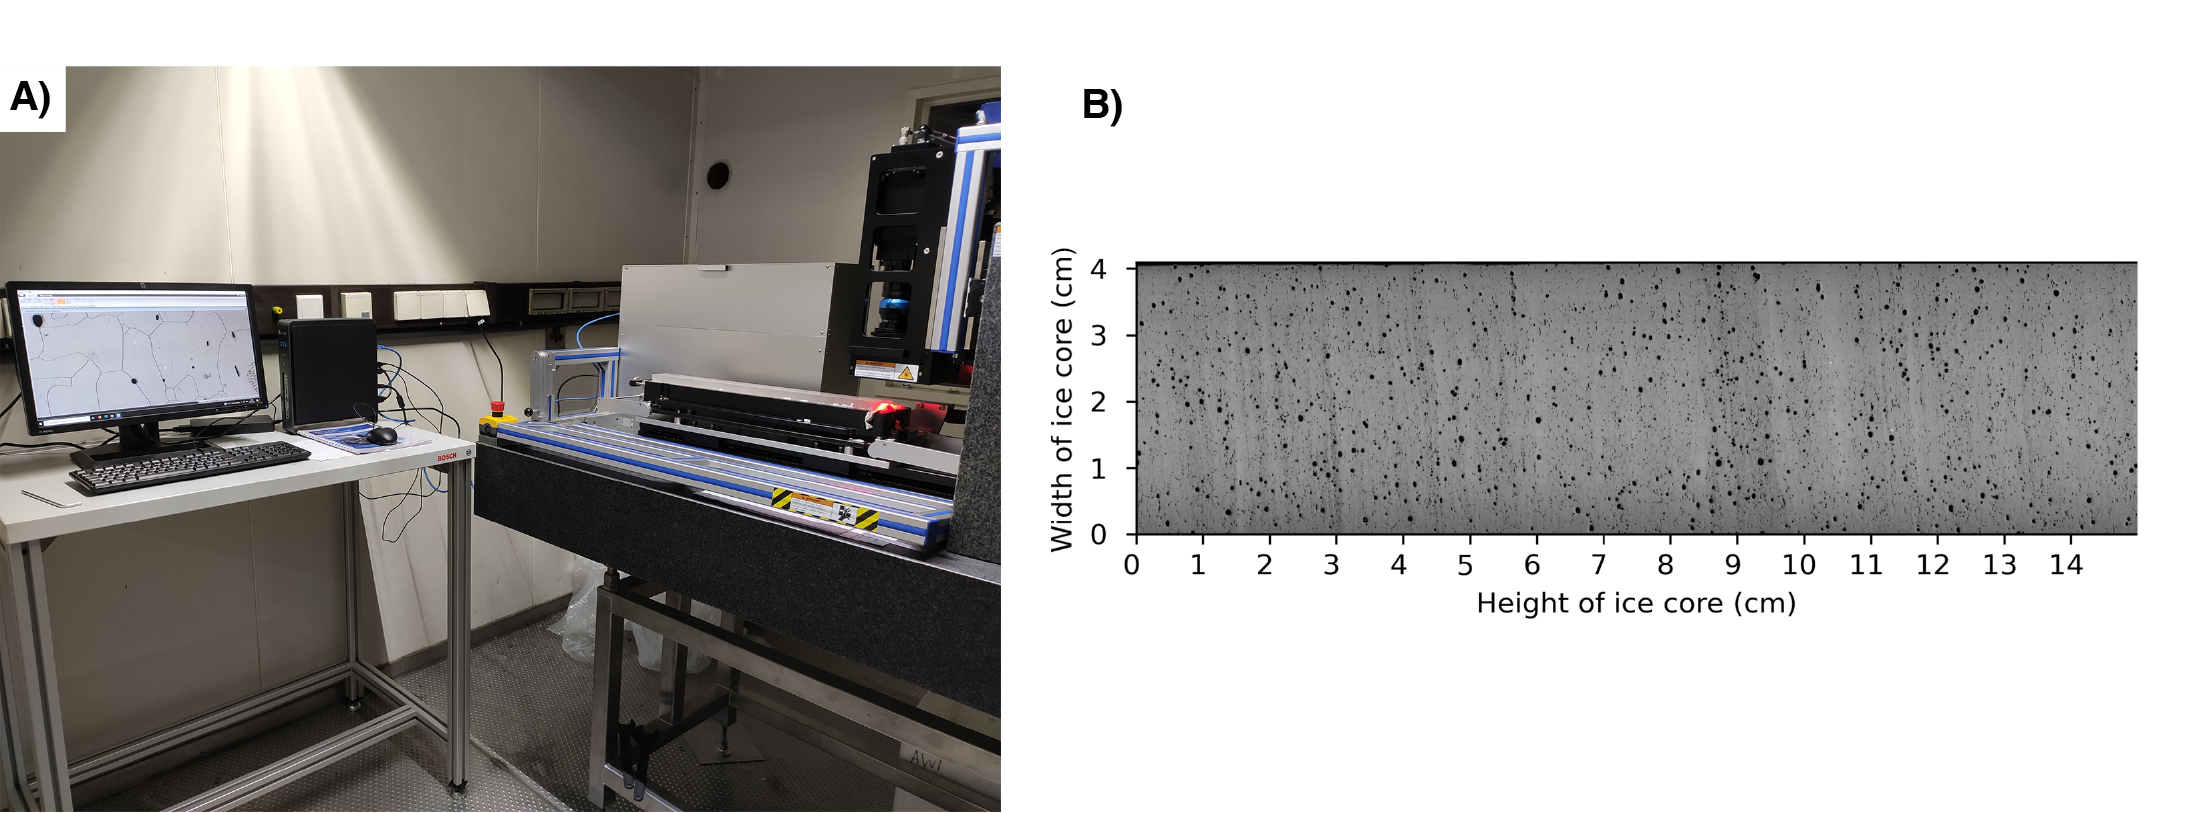
Figure 1: (A) Three-axis xLASM for the analysis of the microstructure of polar ice cores. (B) Output example of a full core scanned with xLASM from the NEEM ice core. |
Current developments in ice-core microstructure mapping
To address the issues mentioned above, ongoing testing of a second Large Area Scanning Microscope (xLASM) (Fig. 1a), which operates on three axes, aims to scan complete ice cores in a single operation. With a larger mapping area, the need for image alignment and matching is eliminated, significantly reducing computing time. Furthermore, the xLASM enables the automation of the height-focusing process.
The xLASM employs bright-field illumination. A scan of the NEEM ice core, a deep ice-core project in the Greenlandic ice cap, is shown in Figure 1b. This technique utilizes light that interacts with various components of the ice-core surface, such as grain boundaries and other microstructural features, leading to differential absorption, or scattering, of light. The transmitted light is collected by the lens and generates an image of the scanned surface. Bright regions of the sample correspond to areas that absorb or scatter light less, while darker regions correspond to areas that absorb or scatter the light more. The ice-core surface is imaged in reflection and three consecutive images of 5 μm resolution are produced in 15 minutes.
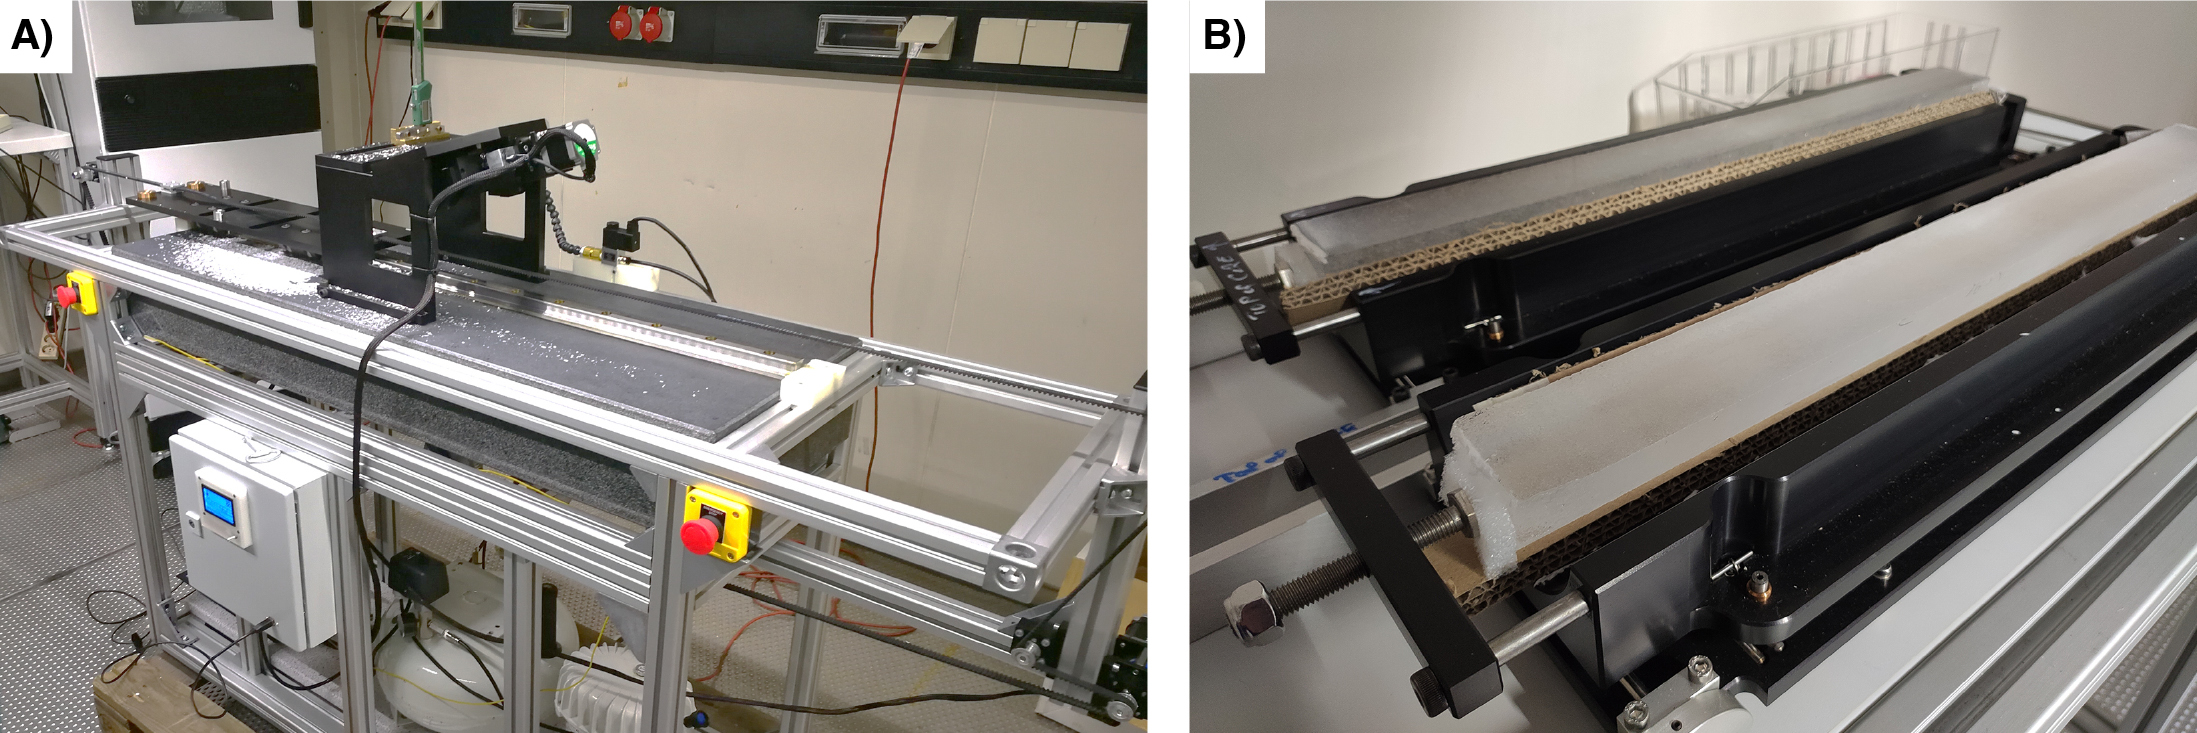
The development and optimization of the xLASM for continuous observation of crystal size structures requires a precise and smooth ice-core surface to maintain the line scanner focus. To achieve this, we have devised an experimental setup featuring an automated microtome (Fig. 2a). By sampling the entire ice core (Fig. 2b), we can streamline the labor-intensive ice-sample preparation process, minimize inconsistencies during sublimation, scan under different imaging conditions, and eliminate the image stitching procedure.
|
|
Figure 2: (A) Picture of the automated microtome, which comprises a granite plate, a linear guide for horizontal motion, and a portal housing the surgical blades. (B) Photograph of mounted ice cores left to sublimate at -20ºC after being microtomed. |
Outlook
A significant advantage of employing line scan cameras in LASMs is their ability to rapidly capture high-resolution images of ice-core microstructures with excellent contrast. Unlike the standard microscopic method, which is time consuming and computationally intensive, the innovative LASMs developed by S+K can generate high resolution ice-surface images within just 5–10 minutes. Ongoing tests involving the new xLASM, coupled with an automated microtome, enable the sampling of whole ice cores through a new processing framework.
The current setup has been tested in a cold room at -20ºC using samples from the NEEM ice core. The process of mounting, microtoming, and scanning ice cores allows for the processing of eight to 10 deep ice cores per day, aiming for more continuous ice microstructure analysis. The main time constraint is the sublimation needed to remove surface artifacts to ensure high quality data. The measurements and continuous observations obtained from the xLASM technology applied to ice cores enable the investigation of ice rheology and its impact on ice deformation. By utilizing this data, it is possible to obtain better insights on folds and disturbances in deep ice layers. This analysis is being conducted on existing ice cores and is anticipated to be applied to future ice cores obtained from the Beyond EPICA Oldest Ice Core project in Antarctica.
affiliationS
1Physics of Ice, Climate, and Earth, Niels Bohr Institute, University of Copenhagen, Denmark
2Schäfter + Kirchhoff GmbH, Germany
3Alfred Wegener Institute, Helmholtz Centre for Polar and Marine Research, Bremerhaven, Germany
4Centre for Earth Observation Science, University of Manitoba, Winnipeg, Canada
contact
Miguel Moreno: miguel.moreno nbi.ku.dk
references
Arnaud L et al. (1998) J Glaciol 44: 326-332
Bendel V et al. (2013) J Glaciol 59: 972-980
Binder T et al. (2013) J Microsc 250: 130-141
Faria SH et al. (2014) J Struct Geol 61: 2-20
Kipfstuhl S et al. (2001) Geophys Res Lett 28: 591-594
Kipfstuhl S et al. (2006) J Glaciol 52(178): 398-406
Krischke A et al. (2015) Optik & Photonik 10: 32-35
Lipenkov VY (2000) In Hondoh T (Eds) Physics of Ice Core Records. Hokkaido University Press, 327-358
Nishida K, Narita H (1996) J Geophys Res 101: 21311-21317