Exploring the origin of Antarctic precipitation for an improved climatic interpretation of ice-core records
L.C. Sime1,
M. Werner3 and
E. Capron4
To refine moisture-source and site-temperature reconstructions inferred from measurements from ice cores, we must understand moisture provenance from which Antarctic precipitation originates. Here, we discuss our current understanding of Antarctic precipitation origins and some recent modeling developments.
Why study Antarctic precipitation?
Antarctic precipitation is crucial to many aspects of the climate system. Firstly, Antarctic snowfall influences sea level through freshwater storage and ice-dynamic discharge. For instance, increased Antarctic snowfall might have mitigated global mean sea-level rise by ~10 mm during the 20th century (Medley and Thomas 2018). Secondly, enhanced atmospheric heat transport associated with increased Antarctic precipitation could promote polar amplification (Hahn et al. 2021). In addition, deep ice cores drilled in Antarctica enable us to understand how the Antarctic and global climates varied over hundreds of thousands of years. Water isotope (δ18O and δD) measurements from these ice cores have been used to infer past surface climate changes (e.g. Jouzel et al. 2007). By obtaining information about evaporation conditions of the precipitation, such as relative humidity and wind speed, we can tackle some key uncertainties in the interpretation of these isotopic measurements from ice cores.
How do we investigate Antarctic precipitation and its origin?
Because of its importance, continental and regional variations in Antarctic precipitation have been studied from daily to inter-annual timescales for many decades. For example, daily snowfall has been measured using a wooden platform at EPICA Dome Concordia (Dome C) since 2006 (Schlosser et al. 2016). Similarly, individual site measurements, which use snow stakes across Antarctica, allow observations of precipitation changes across the continent (Lenaerts et al. 2019). Invaluable larger-scale satellite measurements of precipitation over Antarctica have been available since the launch of CloudSat in 2006, though these measurements remain subject to calibration uncertainties (Palerme et al. 2014).
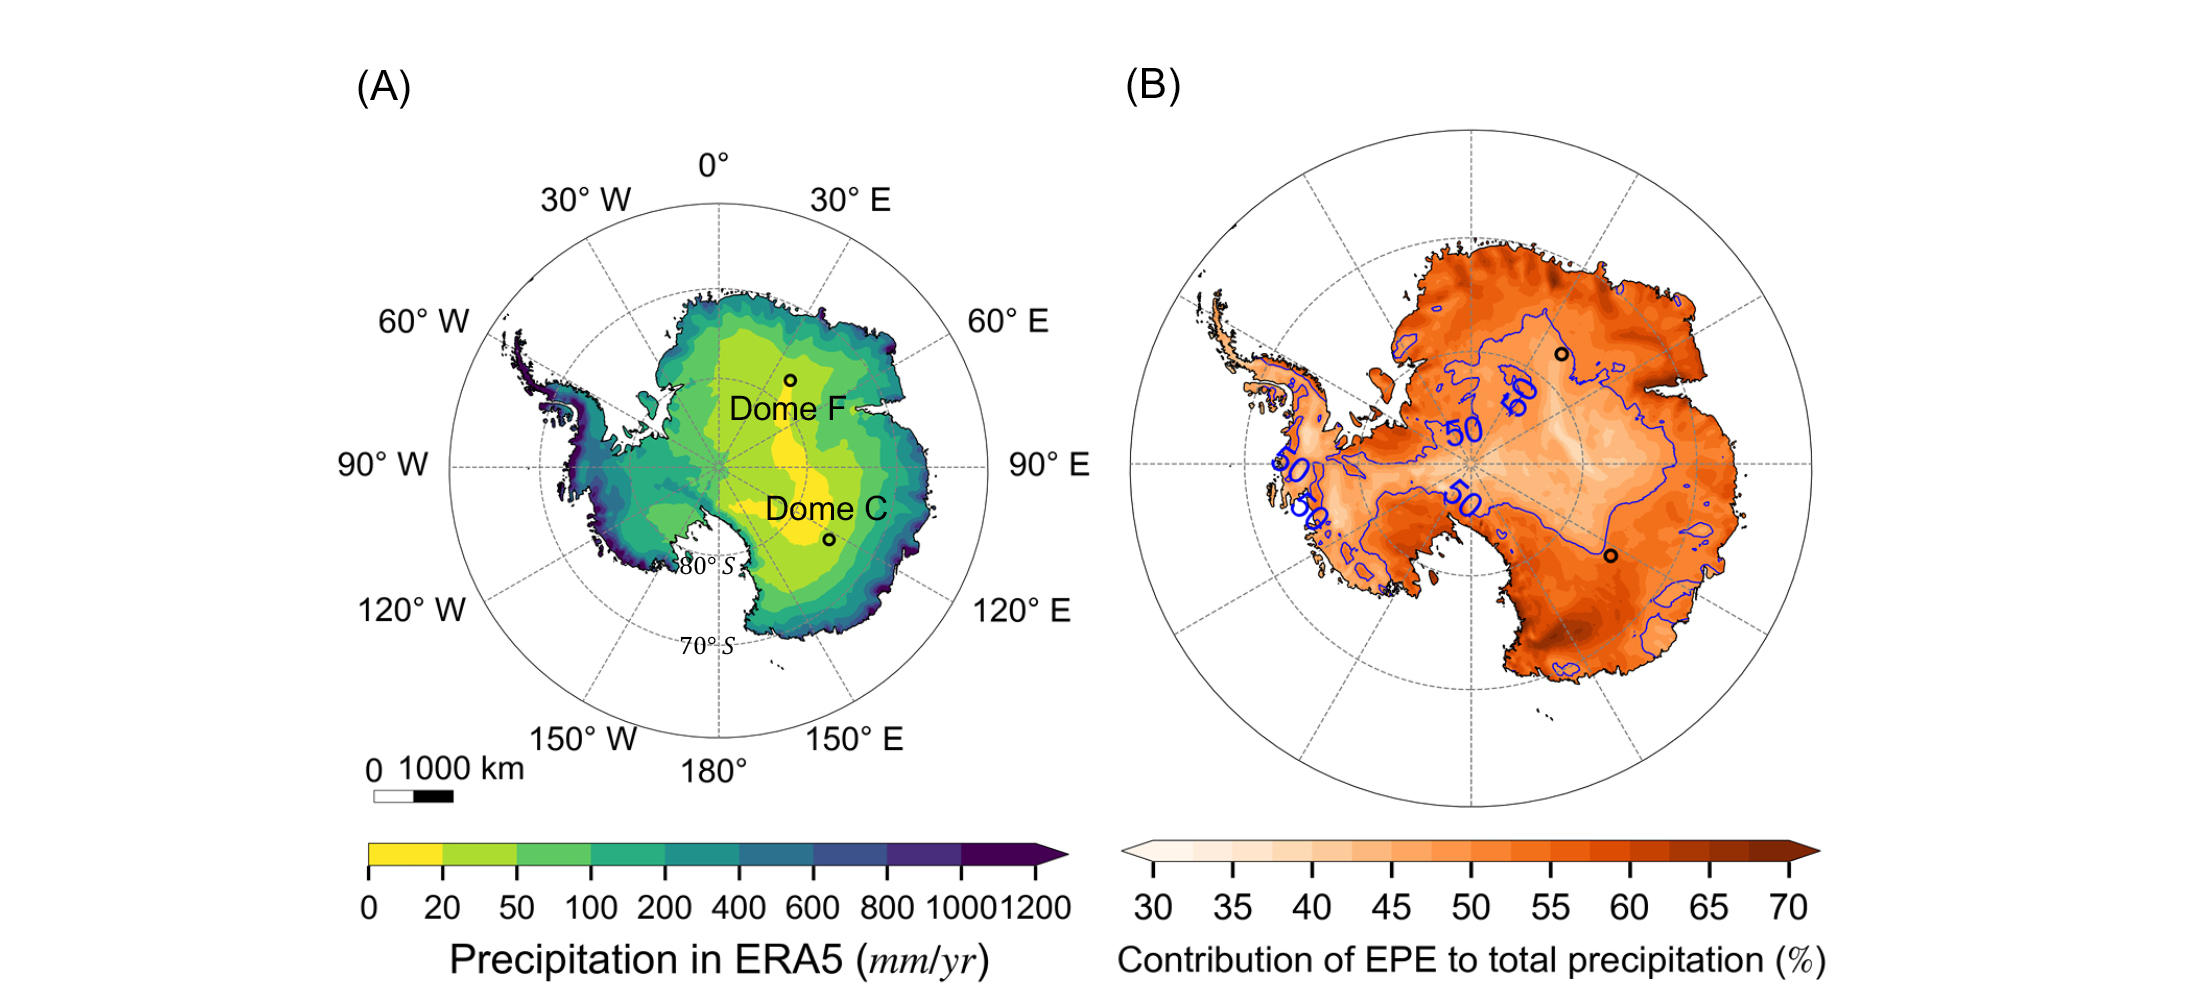
Complementary to observations, atmospheric general circulation models, which are sometimes run using data assimilation techniques, have provided precipitation and other relevant climate data for Antarctica. The European Centre for Medium-Range Weather Forecasts (ECMWF) combined numerous observations and a weather forecast model to produce the ECMWF Reanalysis v5 (ERA5, Hersbach et al. 2020). Based on the ERA5 dataset (1979–2022), average precipitation over the Antarctic Ice Sheet is ~175 mm/yr, and it decreases from coastal regions towards the Antarctic interior (Fig. 1a). Using multiple model simulations, Frieler et al. (2015) quantified the impact of a thermodynamic factor, i.e. the higher water holding capacity of a warmer atmosphere, on Antarctic precipitation. They found that, at the continental scale, Antarctic accumulation increases with temperature at a rate of ~5 %/K.
Combining ice-core data and reanalyses, Medley and Thomas (2018) investigated the Southern Annular Mode (SAM), which is the primary mode of atmospheric circulation variability in the southern mid-to-high latitudes. They found that SAM exerts regionally different controls over precipitation across Antarctica through modified moisture fluxes. Using a regional climate model, Turner et al. (2019) found that extreme precipitation events (EPE) contribute significantly to the amount and variability of Antarctic precipitation (Fig. 1b). It appeals for the study of dynamic drivers of EPE to project its future changes and impacts on Antarctic climate.
 |
|
Figure 1: (A) Annual mean precipitation over Antarctica from the ERA5 reanalysis (1979–2022, Hersbach et al. 2020). (B) Contribution of extreme precipitation events (EPE) to total precipitation amount in the ERA5. Here EPE is defined as the top 10% heavy precipitation days following Turner et al. (2019). To help visual interpretation, blue lines show contours of 50% EPE contribution. |
Alongside these thermodynamic and dynamic controls, it is valuable to understand how the evaporative sources, and changes in these source properties, impact Antarctic precipitation. Water sources of Antarctic precipitation have thus been investigated using three different techniques.
Firstly, water isotope fractionation models can be applied to infer source temperature during evaporation processes based on deuterium excess data in Antarctic surface snow (Stenni et al. 2010). The deuterium excess is defined as the difference between the abundance of deuterium and 18O in water isotopes: d = δD – 8δ18O. This method relies on multiple assumptions, such as idealized moisture transport trajectories. Secondly, Lagrangian trajectory diagnostics can attribute moisture sources by identifying humidity changes along the transport of air parcels (Sodemann and Stohl 2009). However, even using 20-day backward trajectories instead of five-day trajectories as commonly used, moisture sources can be identified for only ~90% of total precipitation. Thirdly, atmospheric general circulation models simulate the global water cycle and are, thus, suitable for moisture-source attribution. A technique called "water tracing" in atmospheric models tracks moisture evaporated from prescribed regions until it precipitates. Traditionally, the globe is divided into multiple complementary regions, and then the contribution of each region to total precipitation at any location can be quantified. While the traditional approach has some downsides, such as being computationally expensive, recent progress in modeling developments has helped alleviate these issues, as discussed below.
Modeling advances in identifying moisture sources
Fiorella et al. (2021) developed a new and improved method for using water tracers in atmospheric models. This new method involves complex mathematical transformations throughout the water cycle, in addition to traditional water tracing. These new tracers allow for more precise inferences of environmental conditions during evaporation, transport, and condensation, making it possible to infer mass-weighted mean evaporation surface temperature and other parameters. This new approach is also much less computationally expensive.
Following on from this, we further developed and implemented this water-tracing approach in the state-of-the-art atmospheric model ECHAM6. We are also implementing the same water-tracing diagnostics in the Hadley Centre Global Environment Model version 3 (HadGEM3). Our water tracers provide abundant new information on moisture-source locations and evaporation-related properties of precipitation across Antarctica.
Figure 2 shows monthly precipitation and its evaporative source conditions at Dome C and Dome Fuji (Dome F). We find that annual mean oceanic-sourced precipitation has a source latitude of 37.6°S at Dome C and 35.1°S at Dome F (Fig. 2b). The source latitude reaches the most northern locations during December and January at both sites, and the most southern locations between March and May. Source sea-surface temperature (SST) of annual mean oceanic-source precipitation is approximately 14.7°C at Dome C and 16.1°C at Dome F (Fig. 2d). Note that annual mean oceanic-source precipitation is from more equatorward (by 2.5° in latitude) and warmer (by 1.4°C) waters at Dome F than at Dome C. Annual cycles of source SST are different from annual cycles of source latitude despite predominant meridional temperature gradients, mainly because of seasonal variations of SST at mid-latitudes. That is, at both sites, the source SST of monthly precipitation peaks in Austral summer (December to February) and is at its minimum in Austral winter (July to September). Although both sites receive moisture primarily from the west, the moisture source is located much further west for Dome F (~60°) than for Dome C (~10°).
 |
|
Figure 2: (A) Monthly mean precipitation at Dome C and Dome F. Panels show the (B) source latitude, (C) relative source longitude, and (D) source SST of monthly mean precipitation which originates from the open ocean. Data are from a preindustrial simulation using the atmospheric model ECHAM6. Moisture source information of precipitation at Dome C and Dome F is derived from our water-tracing diagnostics implemented in ECHAM6. Horizontal dashed lines represent annual mean values. |
Based on our moisture-source diagnostics, EPE derives its moisture from more northern regions by 3.0° and 3.7° than the rest of precipitation at Dome C and Dome F, respectively. The different moisture sources reflect distinct dynamic controls, which might imprint on water-isotope records.
Our current research aims to apply the water tracers to the study of paleoclimate. Indeed, measured water isotopes from Antarctic ice cores and the derived parameter deuterium excess have been interpreted for evaporation-source and precipitation-site temperature, based on simple water-isotope models (Landais et al. 2021). However, it is very challenging to quantify with atmospheric models the uncertainties associated with this method due to a lack of moisture-source information. Thanks to our new quantitative information on moisture sources, we will be able to refine uncertainty estimates attached to ice-core-based past temperature reconstructions from ice cores. In particular, future research will apply these new modeling tools to constrain local surface-temperature reconstructions from the ice core currently drilled at Little Dome C in the framework of the Beyond EPICA Oldest Ice Core project.
affiliationS
1Ice Dynamics and Paleoclimate, British Antarctic Survey, Cambridge, UK
2Department of Earth Sciences, University of Cambridge, UK
3Alfred Wegener Institute, Helmholtz Centre for Polar and Marine Research, Bremerhaven, Germany
4Institute of Environmental Geosciences, University of Grenoble Alpes, France
contact
Qinggang Gao: qino bas.ac.uk
references
Fiorella RP et al. (2021) J Adv Model Earth Syst 13: e2021MS002648
Frieler K et al. (2015) Nat Clim Chang 5: 348-352
Hahn LC et al. (2021) Front Earth Sci 9: 725
Hersbach H et al. (2020) Qua J Roy Met Soc 146: 1999-2049
Jouzel J et al. (2007) Science 317: 793-796
Landais A et al. (2021) Nat Geosci 14: 918-923
Lenaerts JTM et al. (2019) Rev Geophys 57: 376-420
Medley B, Thomas ER (2018) Nat Clim Chang 9: 34-39
Palerme C et al. (2014) Cryo 8: 1577-1587
Schlosser E et al. (2016) Atmos Chem Phys 16: 4757-4770
Sodemann H, Stohl A (2009) Geophys Res Lett 36: L22803