Extracting paleoclimate information from stratigraphically disturbed “oldest ice”
Researchers have found ice as old as 2.7 million years in East Antarctica, but such ice has a disturbed stratigraphy and a complicated age–depth relationship. Nevertheless, innovative data analyses and sampling plans can still reveal valuable paleoclimate information.
Oldest ice, but in stratigraphically disturbed form
Ice cores contain a wealth of information about the Earth’s climate history. The oldest continuous ice-core record comes from Dome C on the East Antarctic Plateau, with ice near the bottom dating back to approximately 800 kyr (EPICA community members 2004). A “holy grail” of the ice-core community is to obtain a record that extends to 1.5 Myr (Dahl-Jensen 2018), a time when the Earth’s glacial cycles showed a shorter periodicty of 41 kyr and a smaller amplitude of changes than their more recent counterparts (Raymo and Huybers 2008).
While efforts to recover a 1.5-Myr-old ice core are currently underway in East Antarctica, researchers have obtained shallow ice cores near the ice-sheet margin that date as far back as 2.7 Myr (Yan et al. 2019). The ice came from the Allan Hills blue ice areas, where sublimation and a subglacial mountain range contribute to the movement of old ice toward the surface (Spaulding et al. 2012). Yet, interpreting the data from the "oldest ice" is challenging due to disrupted age–depth relationships (Higgins et al. 2015), uncertainties related to absolute dating methods (Bender et al. 2008), and alterations to the chemical composition of the trapped gases near the bottom (Yan et al. 2019).
If classic ice-core records are like a movie, disturbed ice resembles random, separate snapshots of the film. However, innovative data treatments and sampling plans can still extract valuable paleoclimate information from these “climate snapshots.”
Asking different questions
The key to interpreting stratigraphically ordered deep ice-core records is the ability to convert depth into age continuously. This accounts for the biases due to the different accumulation rates between glacial and interglacial intervals. However, when ice stratigraphy is no longer continuous, such biases can greatly affect our observations. For example, from the Allan Hills ice dating back to 1.5 Myr, there are 33 discrete CO2 measurements yielding an average CO2 concentration of 232 ppm (Yan et al. 2019). This value does not necessarily represent the true average CO2 concentration of the 41-kyr glacial cycles due to potentially incomplete or biased sampling from the disturbed stratigraphy.
Consequently, we need to reevaluate the data through a different lens. Instead of means and standard deviations, what other types of information can we learn from the individual climate snapshots?
One answer is the range of data, defined as the difference between the maximum and minimum values. While the problem of incomplete sampling remains, now we can quantitatively estimate what fraction of the true data range a certain number of points can capture. Critical to this question are the shape of the true CO2 time-series and the relative abundance of interglacial- versus glacial-CO2 samples preserved in the ice.
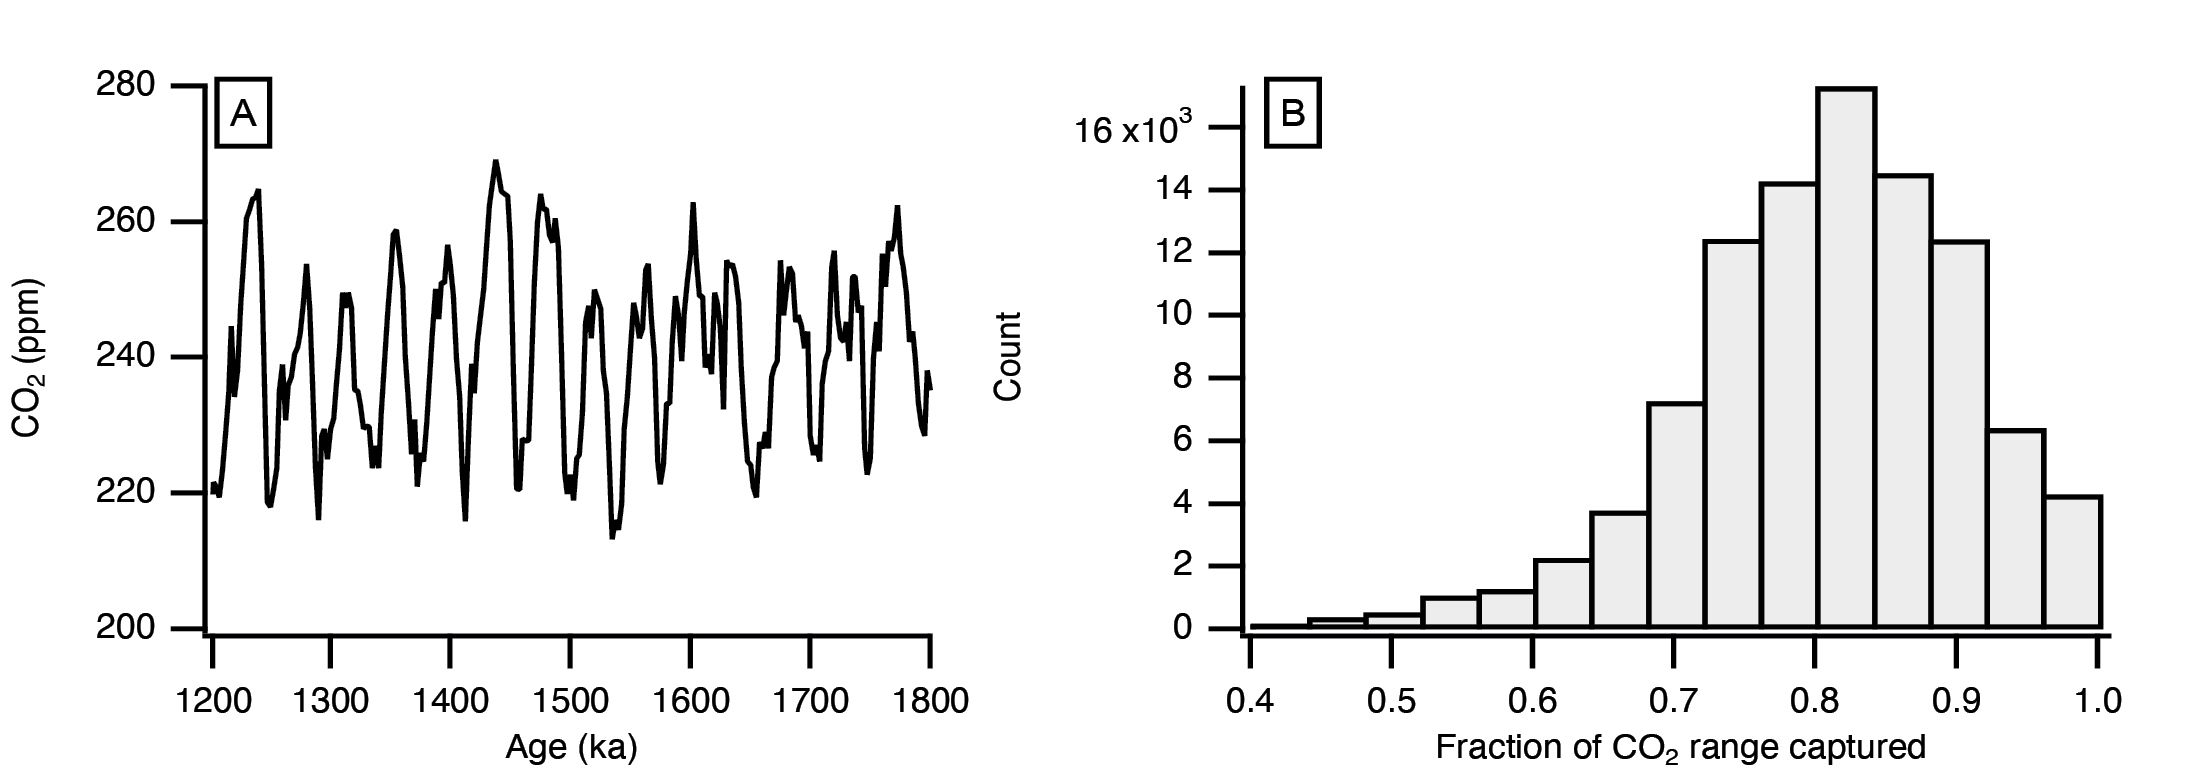
In the case of Allan Hills samples, Yan et al. (2019) constructed a synthetic CO2 timeseries based on the climate records from ocean sediments. Assuming that ice from interglacial periods is over-represented by a factor of 10 in the Allan Hills ice (Yan et al. 2021), we estimated that 33 discrete samples capture 81% of the true range (95% confidence interval: 56–99%; Fig. 1). Since the observed range of the 33 CO2 samples from the 1.5 Myr ice is 65 ppm (from 214 to 279 ppm), the true glacial–interglacial range of CO2 is estimated to be between 206 and 287 ppm, assuming that glacial and interglacial extremes are equally absent.
|
|
Figure 1: (A) Synthetic CO2 time-series between 1.2 and 1.8 Myr, modified from Yan et al (2019). (B) Counts of the fraction of the recovered CO2 variability (observed range/true range) of the synthetic CO2 record by 33 discrete samples in Monte Carlo simulations (105 iterations). In each iteration, a 10-fold over-representation of interglacial periods in the ice was assumed. |
By comparison, atmospheric CO2 varied between 300 and 180 ppm over the past 800 kyr. The result suggests a smaller CO2 variability 1.5 million years ago, resembling the smaller temperature variability of glacial cycles at that time. The last 800 kyr’s greater glacial–interglacial CO2 range primarily resulted from a lower glacial CO2 level (Yan et al. 2019).
Scatter plots instead of time-series
Another way to examine stratigraphically disturbed ice that is out of chronological order is to make property-versus-property plots. Measurements of different properties taken from the same depth should have a similar age regardless of the ice stratigraphy, making this approach particularly useful in evaluating the relationship between two properties of interest, such as CO2 and Antarctic temperature proxies (Yan et al. 2019).
In addition to greenhouse gases, the composition of major gases trapped in polar ice reveals useful paleoclimate information. An empirical relationship between the oxygen-to-nitrogen ratio, expressed as δO2/N2, and local summer insolation has been established for over two decades (Bender 2002). Higher insolation corresponds to lower δO2/N2 values. By using δO2/N2 as an insolation proxy, we can evaluate the relationship between Antarctic temperature and local solar forcing. The isotopic composition of the hydrogen molecules in the ice, expressed as δDice, indicates local temperature.
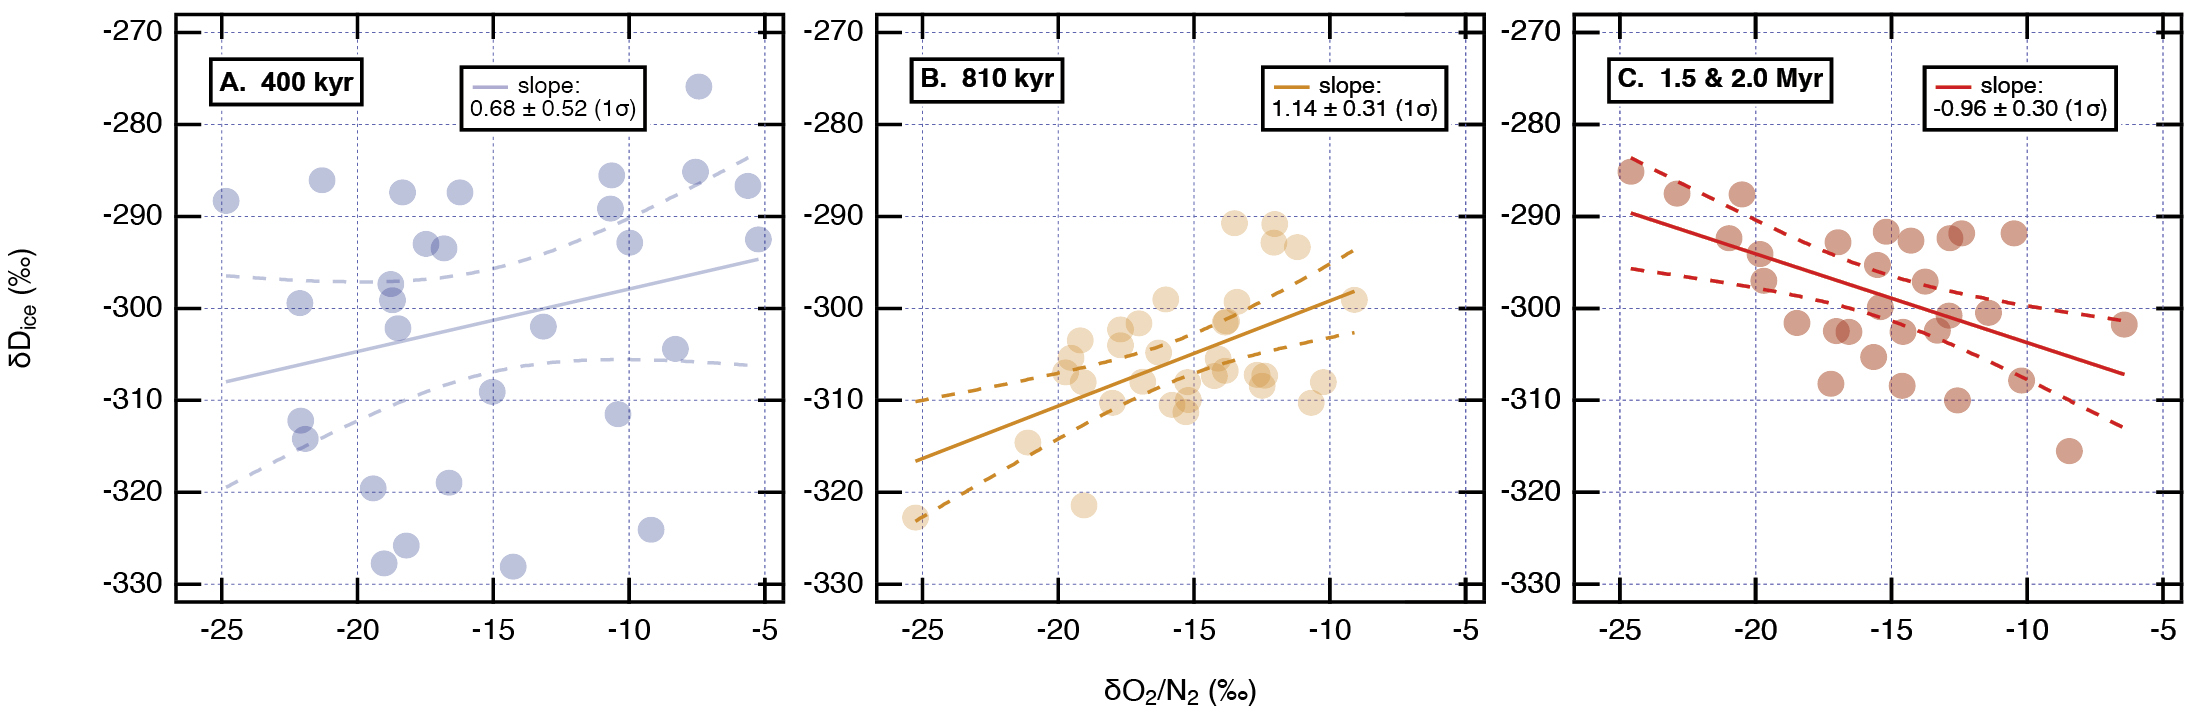
Over the past 800 kyr, Northern Hemisphere insolation has paced Antarctic temperature on orbital timescales (Bazin et al. 2016; Kawamura et al. 2007). In this time period, a scatter plot between δO2/N2 and δDice measured on Antarctic ice shows a positive correlation (Figs. 2a-b), which means lower Antarctic temperature was associated with higher local insolation.
On the contrary, correlation between the δO2/N2 and δDice data obtained from the 1.5- and 2-Myr ice shows a statistically significant negative correlation (Fig. 2c), meaning that a warm Antarctica occurred during intervals with high local summer insolation. The most reasonable explanation is that Southern Hemisphere insolation paced Antarctic temperature in those 41-kyr glacial cycles (Yan et al. 2023). The result here supports the hypothesis that there were no precession-related ice-age cycles 1.5 Myr ago globally, because precession forcings are out-of-phase between the two individual hemispheres (Raymo et al. 2006).
|
|
Figure 2: Relationship betewen the isotopic composition of the hydrogen in Allan Hills ice molecules (δDice) and δO2/N2 measured on ice dating back to (A) 400 ± 70 kyr (95% CI), (B) 810 ± 100 kyr, and (C) 1.5 ± 0.1 and 2.0 ± 0.1 Myr, modified from Yan et al (2023). The uncertainty associated with age arises from the fact that 40Ar dating could not fully resolve the chronology of the blue ice, so the data are binned together to form a series of “climate snapshots”. |
More robust approach with large diameter samples
The examples above have a catch, however: limited ice availability means that the depths of measurements that determined gas composition differ slightly from those that constrained the age of the ice. As a result, certain assumptions had to be made about the age of the gas data, such as linking it to the nearest absolute age-control point. However, this assumption might not always hold true, since stratigraphic disturbance could occur between two age-control points.
Fortunately, engineers have developed a solution in the form of a large-diameter ice drill designed specifically for blue ice (Kuhl et al. 2014). This drill produces ice-core samples with an inner diameter of 241 mm, allowing for multiple measurements at the exact same depth. Although we still need to make the assumption that stratigraphic layers are perpendicular to the vertical axis of the cores, having an age-control point from the same depth is more accurate than attaching the data to the nearest age control points. In two austral summer field seasons (2019–20 and 2022–23), one such large-diameter drill was deployed in Allan Hills. A number of ice cores were succesfully retrieved, and analyses are currently underway.
Conclusions
Ice older than 1 Myr has been found in blue ice areas in East Antarctica, but the disturbed stratigraphy prevents the establishment of a conventional timeseries. Rather, the blue ice data represent a series of “climate snapshots”. Consequently, we must ask different questions about the data, or take advantage of the fact that properties measured at the same depth have similar age. Lessons learned from these climate snapshots preserved in the blue ice could prove useful in case stratigraphic disturbance is observed near the bottom of the future deep Antarctic ice cores dating back to 1.5 Myr.
ACKNOWLEDGEMENTS
The author thanks Dr. Sarah Shackleton for reviewing the section on the large-diameter ice drill. Yuzhen Yan is supported by the Fundamental Research Funds for the Central Universities.
affiliation
State Key Laboratory of Marine Geology, Tongji University, Shanghai, China
contact
Yuzhen Yan: yanyuzhen tongji.edu.cn
references
Bazin L et al. (2016) Clim Past 12: 729-748
Bender ML (2002) Earth Planet Sci Lett 204: 275-289
Bender ML et al. (2008) Proc Natl Acad Sci 105: 8232-8237
Dahl-Jensen D (2018) Nat Geosci 11: 703-704
EPICA community members (2004) Nature 429: 623-628
Higgins JA et al. (2015) Proc Natl Acad Sci 112: 6887-6891
Kawamura K et al. (2007) Nature 448: 912-916
Kuhl T et al. (2014) J Glaciol 68: 1-6
Raymo ME, Huybers P (2008) Nature 451: 284-285
Raymo ME et al. (2006) Science 313: 492-495
Spaulding NE et al. (2012) J Glaciol 58: 399-406
Yan Y et al. (2019) Nature 574: 663-666