Combining remote sensing, geophysics, and paleoseismology to study earthquakes on the Idrija Fault in Slovenia
Grützner C.![]()
Slow faults only rarely produce large earthquakes, we often know little about their past activity, and they are difficult to study. Here, I show how using a combination of different tools helps to reveal past fault-surface ruptures in Slovenia.
Slow-moving faults are difficult beasts
Faults with high slip rates of several millimeters, or even centimeters, per year can host large earthquakes with typical recurrence intervals of a few hundred years. Good examples are the Alpine Fault in New Zealand, the North Anatolian Fault in Türkiye, or the San Andreas Fault System in California (e.g. Onderdonk et al. 2018). Living in such regions comes with the obvious problem of frequent strong quakes. However, perhaps surprisingly, there is also good news: people know about the seismic hazard because the last strong event was not long ago, and they are usually prepared. Chile, for example, was struck by a subduction earthquake moment magnitude (Mw) 8.8 in 2010, yet less than 600 people lost their lives—remarkable for the sixth strongest earthquake ever measured. The same is true for Japan. Slow-moving faults, on the other hand, cause infrequent strong quakes (Liu and Stein 2016). We saw this in Morocco on 8 September 2023, when an earthquake of Mw 6.8 occurred in a region of low instrumental and historical seismicity, and tragically caused thousands of deaths. In fact, more people have been killed by earthquakes in continental interiors than by those that occurred on plate boundaries (England and Jackson 2011).
Apart from the issues with estimating the seismic hazard of areas that are slowly deforming, slow faults come with another problem: their movement often leaves only subtle traces in the landscape because it is outpaced by other processes such as erosion, sedimentation and modification by humans. Studying their tectonic activity, slip rate etc. can, therefore, be very difficult (Diercks et al. 2023; Grützner et al. 2017).
The Idrija Fault in Slovenia
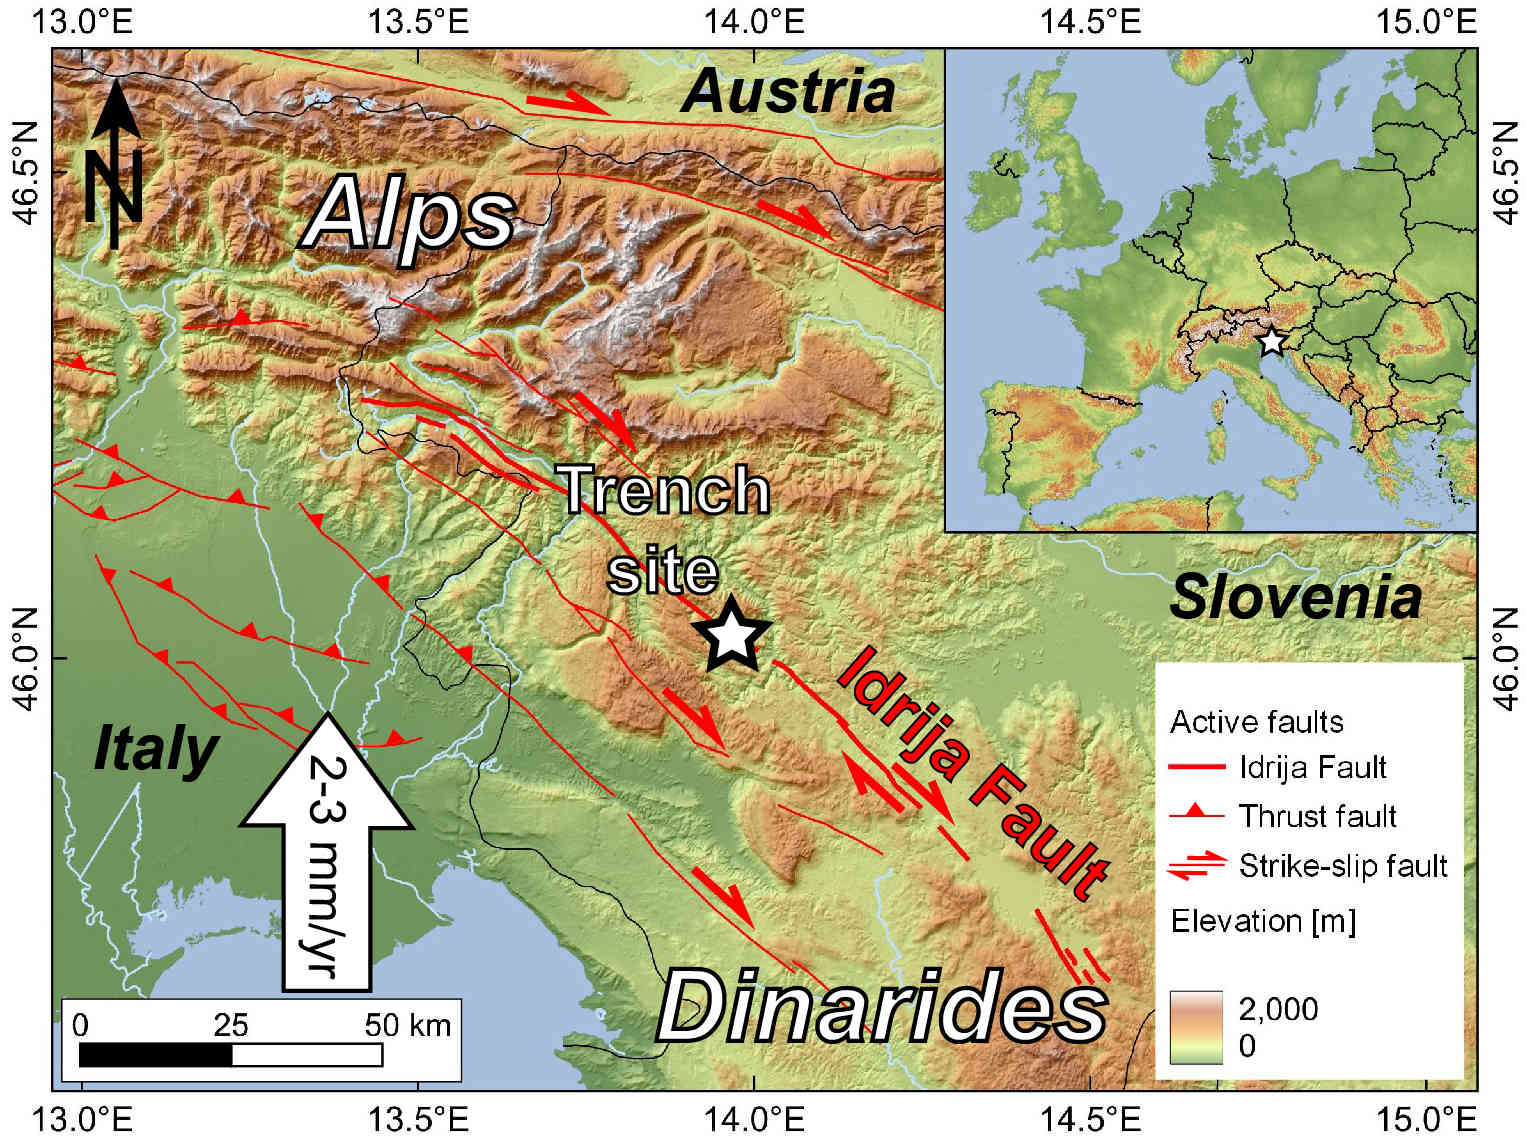
In the framework of the German Priority Program "SPP2017 – Mountain Building Processes in 4D" we looked into the tectonic activity of the Alps-Dinarides junction (Fig. 1). Here, the northward motion of the Adriatic Plate of about 2–3 mm/yr, with respect to stable Europe, is accommodated by a strike-slip fault system in Western Slovenia. The system is made up of at least four major faults and several smaller ones. They strike NW–SE and are parallel to each other (Fig. 1). Seismicity is low to moderate and only one of these faults had strong instrumental earthquakes of magnitudes Mw 5.7 and Mw 5.2 in 1998 CE and 2004 CE, respectively. Swarm activity, however, has been proven for the largest faults (Vičič et al. 2019).
 |
|
Figure 1: Map of the study area in Slovenia. Faults (simplified) in red, the Idrija Fault in bold. Adria moves north with respect to Eurasia with 2–3 mm/yr. |
A destructive earthquake in 1511 CE devastated the city of Idrija, back then an important mercury mining town. Still, there is debate as to whether this quake occurred on the Idrija Fault, the longest fault of the system (~100 km), or on another fault in Italy (Falcucci et al. 2018; Fitzko et al. 2005). The quake’s magnitude was perhaps close to MW 7. Because of the slow motion of Adria, individual faults in our study area have low slip rates, probably not exceeding 1 mm/yr (Atanackov et al. 2021; Grützner et al. 2021; Moulin et al. 2016). This, in return, means that it may take thousands of years before enough strain is accummulated to be released in a major earthquake in which the fault slips by a meter or more, and which breaks the surface. One therefore has to go beyond the instrumental and historical record to investigate the Idrija Fault’s earthquake history.
While a few studies could prove fault activity during the Late Quaternary and estimated the slip rate, only one attempt has been made to date the last major earthquake on the fault by paleoseismological trenching—that is, excavating the fault zone and dating offset or deformed geological layers (Bavec et al. 2013). The results of this study imply that the Idrija Fault ruptured in 1511 CE. But how often do these large earthquakes happen? In order to find out, we decided to open another paleoseismological trench across the fault, but choosing the right place is not an easy task.
Combining different methods helps to reveal past earthquakes
A suitable trench site needs to fulfill a couple of prerequisites. First, there needs to be young geological units that have recorded fault motion. We therefore had to find a site with Late Quaternary sediments and constant sediment input. The idea is that dating the youngest deformed units and the oldest non-deformed units enables bracketing the date of the earthquake. Second, we need to find sediments that can actually be dated by radiocarbon, luminescence, or other methods. Third, the trench needs to hit the actual fault zone. Fourth, the logistics must work: Can I reach the site with an excavator? Is the site within a National Park? Does the landowner agree? Will I need to pump groundwater?
After mapping the fault trace using a 1 m digital elevation model created from airborne laserscanning data (ARSO 2015), we ran an extensive geophysics campaign and collected kilometers of georadar and geoelectrics profiles across the fault.
 |
|
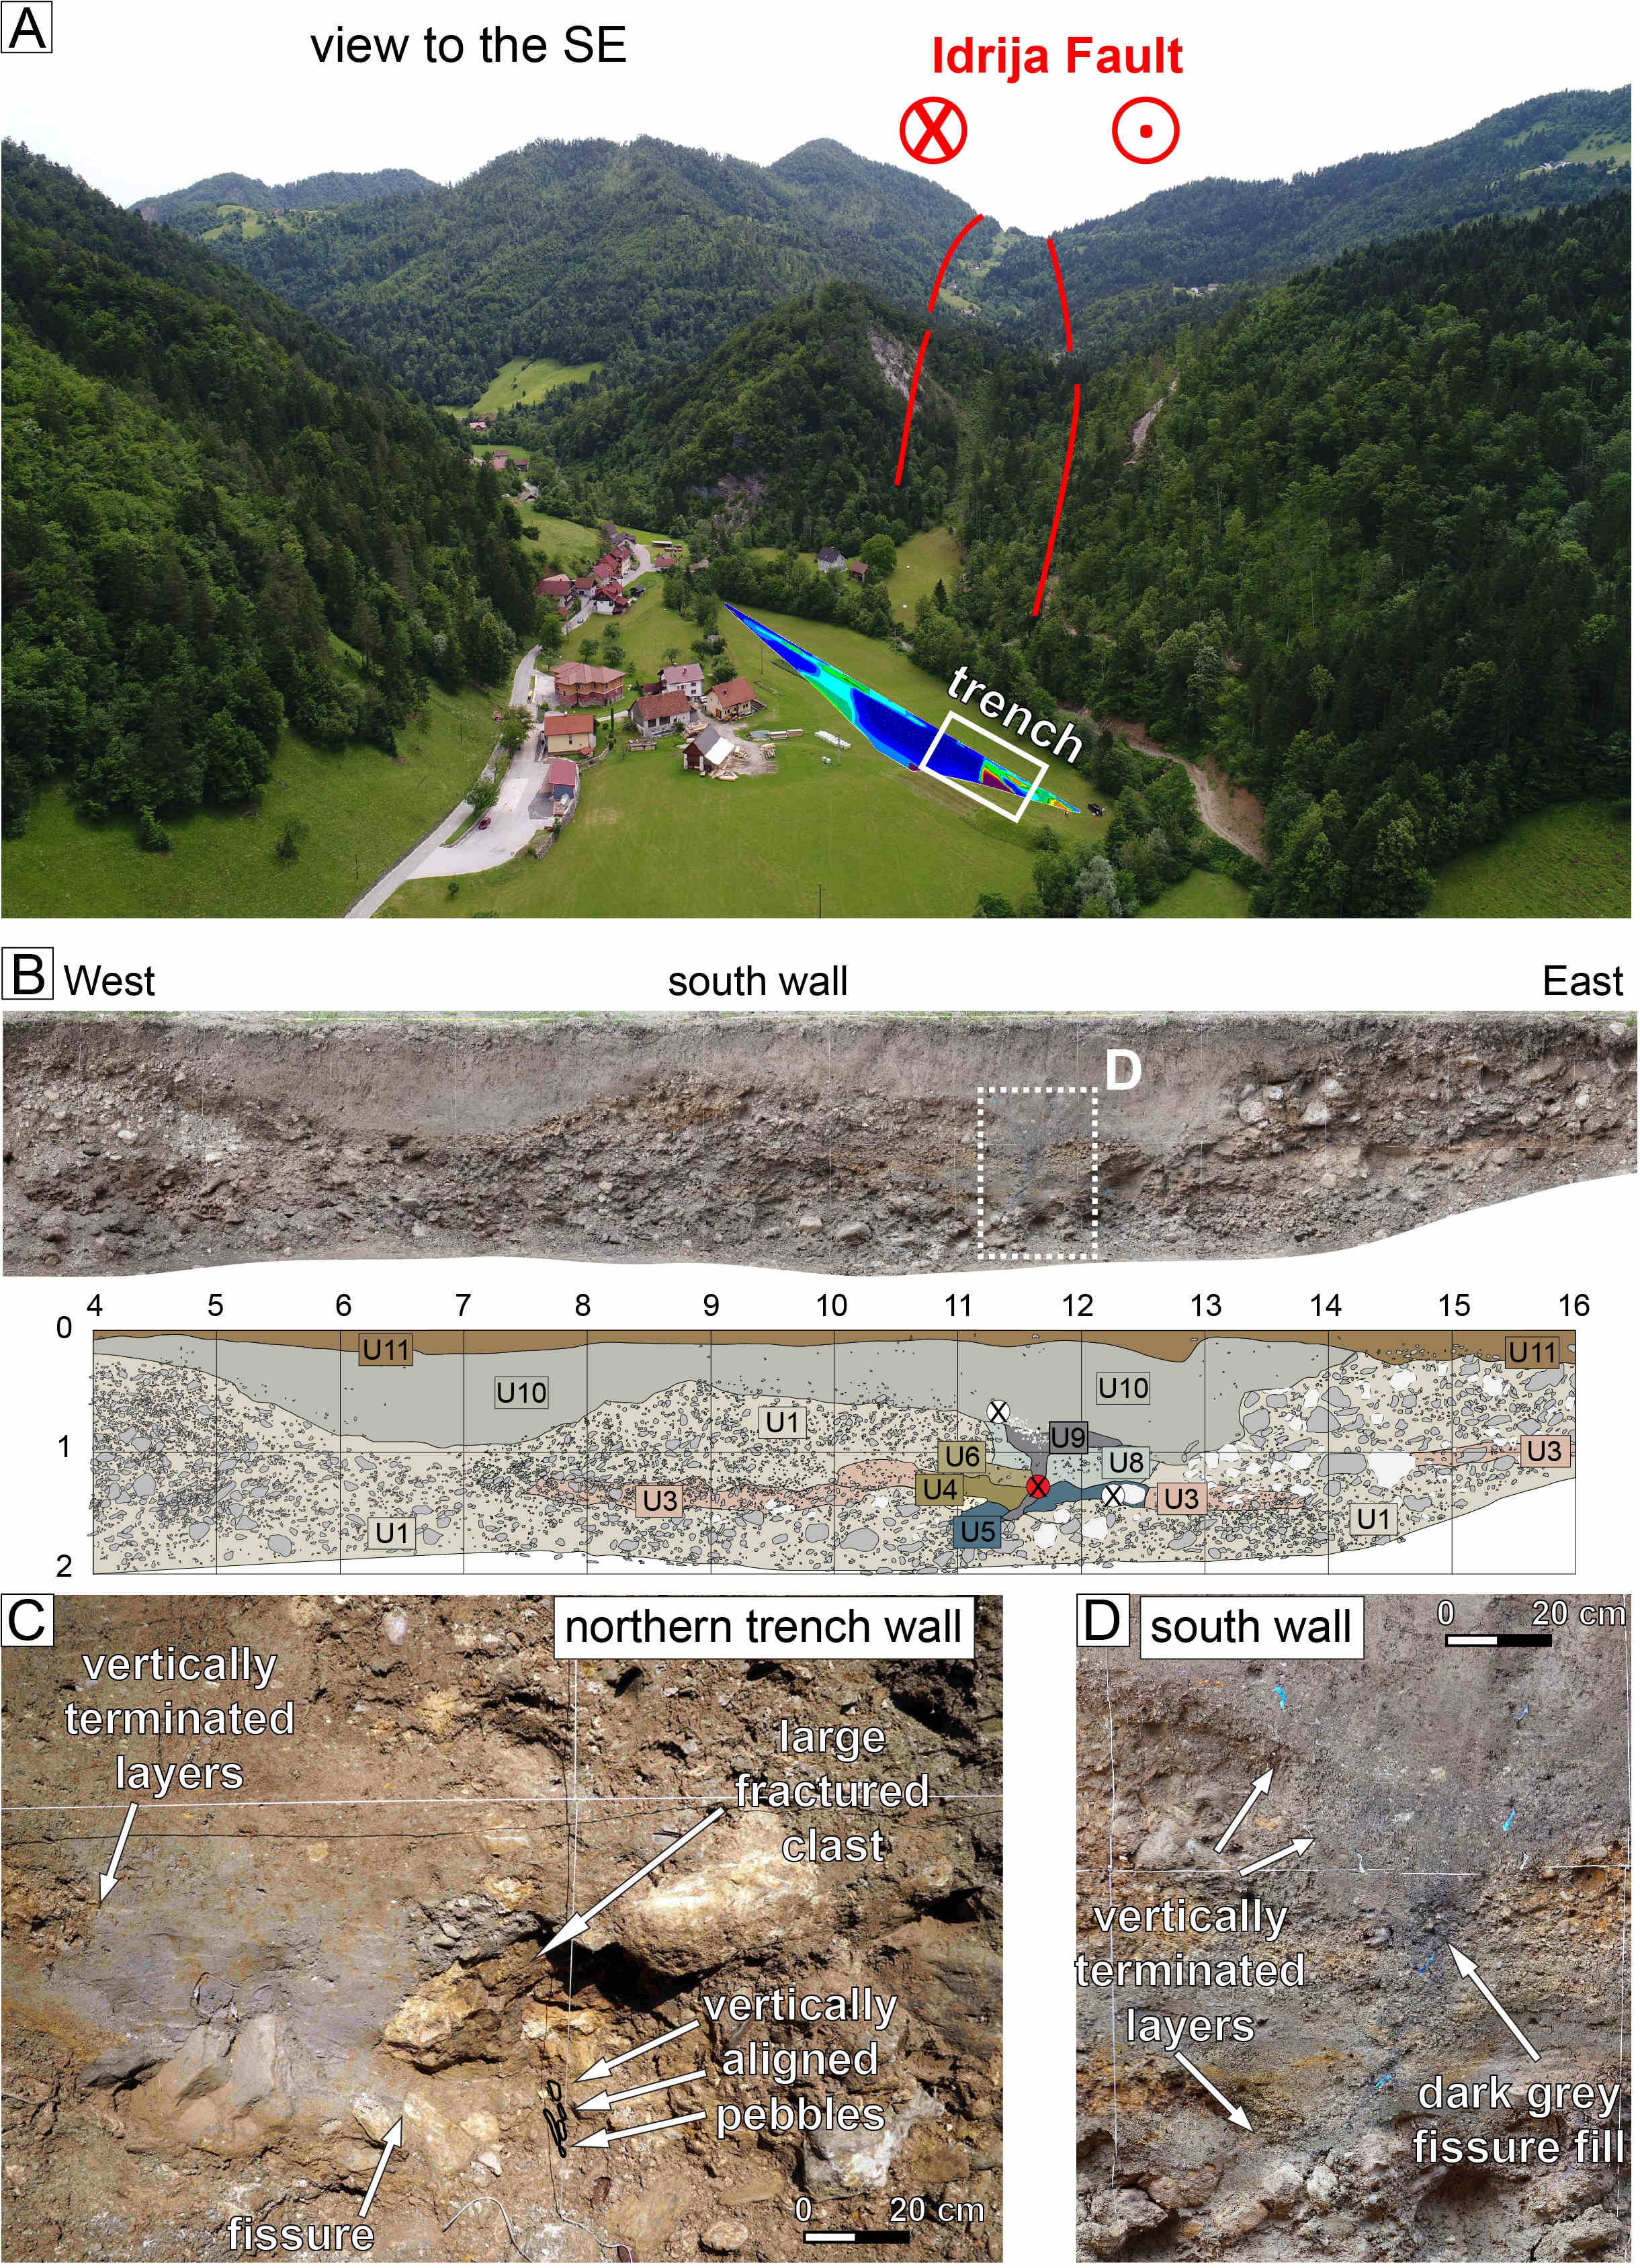
Figure 2: The trench site at Srednja Kanomlja, near Idrija. (A) Panoramic view of the trench site with the fault trace in the background and results of the geoelectrics measurements (blue: low resistivities; red: high resistivities). (B) Photo and 1:10 scale log of the trench wall. Circles with crosses mark sample locations for dating. (C-D) Details from the trench. |
One site fulfilled all requirements—a small basin on the fault trace with a strong contrast of resistivities in the subsurface (Fig. 2a). This contrast indicates that two different types of rocks are juxtaposed, in this case probably bedrock and basin fill, which hints at a tectonic origin of the basin. We opened a 20 m long trench exposing coarse fluvial deposits and channels filled with fine-grained sediment (Fig. 2b). The exposure was cleaned, gridded and photographed in detail. We identified different sediment units based on color, grain size and lithology, and we sketched the entire trench at a scale of 1:10. We found hints for faulting in a zone right on top of the resistivity contrast (Fig. 2c–d). Several fine-grained layers (U4, U6, U8; Fig. 2b) terminate abruptly, indicating they were cut by fault motion. We found a dark gray, funnel-shaped unit (U9) that we interpreted as a fissure filled with material rich in organics (Fig. 2d). Such fissures are commonly observed in strike-slip earthquakes (e.g. Quigley et al. 2010).
On the opposite trench wall, and again right on the projected fault trace, we encountered pebbles that were vertically aligned. Their long axis is vertical instead of (sub-)horizontal, as in undistorted sediments. Such an arrangement is known to be associated with shear motion and has been observed in other strike-slip fault zones (e.g. Zabcı et al. 2017). Finally, a large fractured clast testifies to abrupt fault motion or intense shaking. Since this is the only fractured clast out of hundreds in the trench, localized fault slip is a much more likely explanation. Nowhere else in the trench, other than this narrow zone, did we observe vertically aligned pebbles, abruptly terminating layers, broken clasts, or filled fissures. We sampled pieces of charcoal and bulk organic material for radiocarbon dating. All the units affected by faulting are ca. 2000–2600 years old (U3, U4, U6, U8). The fill of the fissure is not younger than 2300 years and overlain by younger, unfaulted sediments. This means that the last fault motion here happened between 2.3–2.6 kyr cal BP, because the sediments affected by faulting are ca. 2600 years old, and the filling of the fissure must have happened after it opened during the earthquake.
Lessons learned
Our trench shows that the last surface-rupturing earthquake on this fault strand pre-dates the 1511 CE event. This does not mean that the 1511 CE earthquake did not happen on this fault, but we see no evidence for it. Another strand could have moved, or the movement at our trench site could have been too small to be detectable. It is not rare for slip to vary significantly along the strike of a fault. Our example illustrates that a combination of different-techniques can help to look into a slow fault’s earthquake history. High-resolution elevation data helped us map the fault, geophysics allowed narrowing down the best trench site, and paleoseismic trenching combined with radiocarbon dating revealed the age of the last surface-rupturing earthquake (Grützner et al. 2021).
ACKNOWLEDGEMENTS
This work was funded by DFG projects 365171455 and 442570483 within SPP2017 (spp-mountainbuilding.de) and the AlpArray inititative (alparray.ethz.ch).
affiliation
Institute for Geosciences, Friedrich-Schiller University Jena, Germany
contact
Christoph Grützner: christoph.gruetzner uni-jena.de
references
ARSO (2015) Slovenian Environment Agency lidar data
Atanackov J et al. (2021) Front Earth Sci 9: 604388
Diercks ML et al. (2023) Geomorphology 440: 108894
England P, Jackson JA (2011) Nat Geosci 4: 348-349
Falcucci E et al. (2018) Solid Earth 9: 911-922
Fitzko F et al. (2005) Tectonophysics 404: 77-90
Grützner C et al. (2017) Earth Plan Sci Lett 459: 93-104
Grützner C et al. (2021) Solid Earth 12: 2211-2234
Liu M, Stein S (2016) Earth-Sci Rev 162: 364-386
Moulin A et al. (2016) Tectonics 35: 10: 2258-2292
Onderdonk A et al. (2018) Geosphere 14: 2447-2468
Quigley M et al. (2010) Bull New Zealand Soc for Earthquake Eng 43: 236-242