- Home
- Publications
- PAGES Magazine
- Volcanic Eruptions and The Global Hydrological Cycle
Volcanic eruptions and the global hydrological cycle
Carley E. Iles, G.C. Hegerl and A.P. Schurer
Past Global Changes Magazine
23(2)
56-57
2015
Carley E. Iles, G.C. Hegerl and A.P. Schurer
Large, explosive volcanic eruptions cause a decrease in global precipitation and shifts in the position of the Intertropical Convergence Zone. Regionally, the most significant changes include decreases in precipitation in monsoon areas, and more precipitation in dry tropical ocean regions.
Large, explosive volcanic eruptions are an important driver of climate variability. For instance, the 1815 eruption of Mount Tambora in Indonesia was followed, by “the year without a summer” in Europe and North America (Stothers 1984). Volcanic eruptions have also caused decreases in hemispheric and regional temperature over the last millennium, particularly over the Little Ice Age (e.g. Schneider et al. 2009; Schurer et al. 2013), and are even speculated to have contributed to its onset (Miller et al. 2012). Climatically relevant eruptions operate through injecting SO2 into the stratosphere, where it is oxidized into sulfate aerosols, which reflect incoming solar radiation. These aerosols spread out globally following tropical eruptions, or over the hemisphere of eruption for high latitude ones, with a lifetime in the stratosphere of a couple of years. The result is a global cooling response lasting a few years (e.g. Robock 2000 and references therein).
Global precipitation decrease
Volcanic eruptions also affect other components of the climate system, by changing atmospheric circulation, increasing sea ice extent, and reducing global precipitation (e.g. Robock 2000; Timmreck 2012). Precipitation decreases have been found in both observational records and in climate model simulations forced with observed records of volcanic aerosols (e.g. Iles et al. 2013; Iles and Hegerl 2014; Trenberth and Dai 2007). They occur because less short-wave radiation reaches the surface, thereby reducing evaporation and stabilizing the atmosphere, whilst the cooler atmosphere contains less water vapor. This pattern is modulated on regional scales by circulation changes, for example weakened monsoon winds can result from larger post-eruption cooling of the land relative to the ocean, reducing precipitation in monsoon regions (e.g. Joseph and Zeng 2011; Schneider et al. 2009).
Isolating the effect of volcanic eruptions is more difficult for precipitation than for temperature because it demonstrates less spatial and temporal coherence. A technique used to overcome this is termed “superposed epoch analysis” and involves averaging the precipitation response across multiple eruptions in order to reduce climate noise (e.g. Fischer et al. 2007).
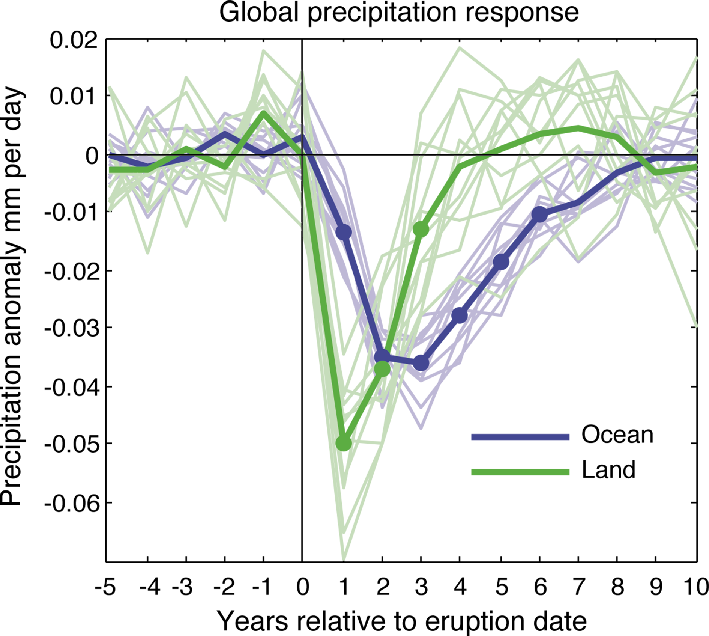
Iles et al. (2013) examined the precipitation response to volcanic eruptions using this technique in both observational data and simulations of the last 600 years using the climate model HadCM3. Figure 1 shows that the model simulated precipitation response over the ocean is longer lived than that over land. Further investigation showed that this is a phenomenon that occurs in all historical simulations of the coupled climate models submitted to CMIP5 (Coupled Model Intercomparison Project Phase 5; Iles et al. 2014). Iles et al. (2013) found that the timing of the ocean precipitation response matched the timing of the post-eruption cooling response over the oceans, implying that precipitation changes could be driven through changing sea surface temperatures. Over land, precipitation reacted faster than temperature, its timing instead consistent with a reduction in land-ocean temperature gradient and the increase in aerosol optical depth, suggesting links to weakening monsoons and a directly forced component respectively.
Spatial pattern of the precipitation response
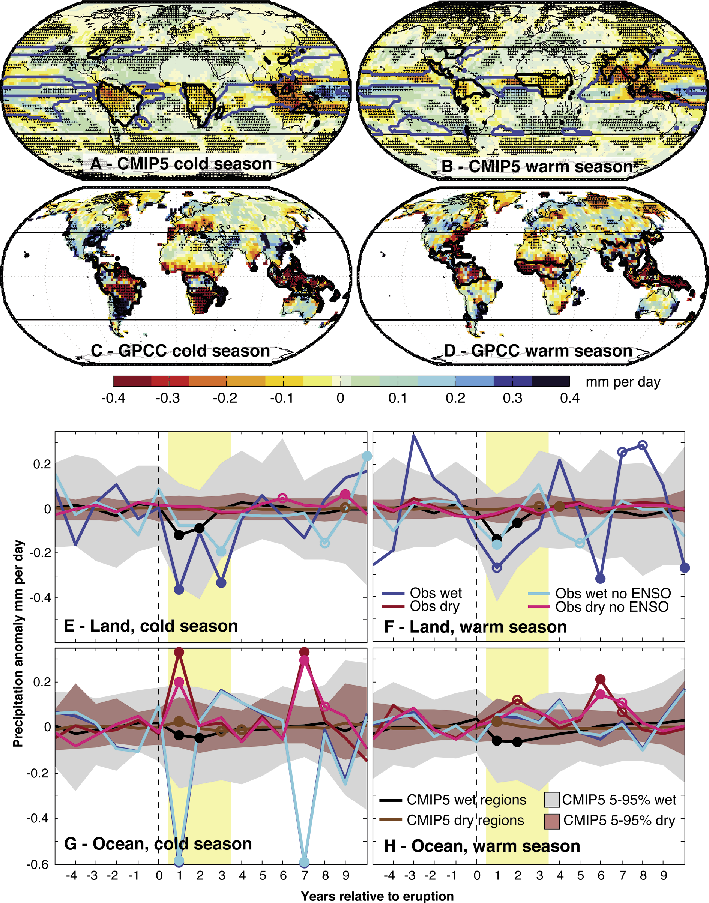
Figures 2a-d show the spatial patterns of precipitation response to five 20th-century eruptions (1902 Santa Maria, 1912 Novarupta, 1963 Agung, 1982 El Chichón, and 1991 Pinatubo) for the CMIP5 multi model mean (a,b) and observational gauge data (c,d) for the cold (Nov-April) and warm (May-Oct) seasons. Model simulated precipitation decreases strongly in tropical-subtropical wet regions (contour lines), including in monsoon regions in their summer season (including SE Asia, central Africa, Northern South America, and Indonesia-northern Australia). Surrounding areas get wetter, and high latitudes get drier (Fig. 2a,b). The tropical drying response shifts between seasons, following the migration of the Intertropical Convergence Zone (ITCZ) and monsoon regions. Observational records also show a drying response in monsoon regions, with the exception of Southeast Asia (Fig. 2c,d).
Figures 2e-f show the precipitation response averaged across the wet tropical-subtropical regions and dry regions over land and ocean separately. Wet regions get significantly drier in models and observations over both land and ocean, with the exception of observed ocean precipitation in the warm season. This observational decrease is robust to the removal of the influence of the El Niño Southern Oscillation (ENSO), which also has a large influence on precipitation, tending to shift it from land to ocean during El Niño years. Three of the five 20th-century eruptions examined are followed by El Niño events. Conversely, dry ocean regions get wetter in both the models and the observations, although this phenomenon is less detectible over land. Models appear to underestimate the size of the response in the cold season, with the observations lying outside of the 5-95% range of the ensemble members (Fig 2e,g), a finding confirmed through a detection analysis by Iles et al. (2014). In response to individual eruptions, Iles et al. (2014) found that in the CMIP5 multi model mean, the ITCZ shifts away from the hemisphere with the higher concentration of volcanic aerosols.
A positive phase of the North Atlantic Oscillation (NAO) has been observed on average in the winters following tropical eruptions, with associated winter warming over northern hemispheric continents (e.g. Robock and Mao 1992). Figure 2c shows a positive NAO precipitation pattern in observational data, with drying over southern Europe and wetter conditions over Northern Europe. However, consistent with other studies (e.g. Driscoll et al. 2012), this is not captured in the CMIP5 models (Fig. 2a).
Volcanic eruptions have also been found to affect global streamflow, with a significant decrease observed following the 1991 eruption of Mount Pinatubo, and more moderate decreases following the 1963 Agung and 1982 El Chichón eruptions (Trenberth and Dai 2007). Flow in the Nile and Niger rivers has been observed to decrease following high latitude eruptions (Oman et al. 2006). Recent research suggests a discernible influence of eruptions on observational streamflow records at regional scales over the instrumental period, largely consistent with model-simulated patterns of the precipitation response (Iles and Hegerl 2015).
Conclusion
Volcanic eruptions have caused detectible changes in precipitation. The response appears to be larger than simulated by present climate models, at least in some regions, which contrasts evidence that the temperature response in observations is smaller than simulated (e.g. Schurer et al. 2013), a discrepancy that needs to be understood. When analyzing regional precipitation change, it has proven useful to consider the expected pattern of volcanic response in climate models in order to make best use of the noisy response in observational records. Better understanding of the water cycle response to volcanic eruptions is important in understanding past variations in precipitation and to improve predictions of the impact of future eruptions, as well as that of shortwave geoengineering schemes (e.g. Tilmes et al. 2015), on global water availability.
affiliation
School of Geosciences, University of Edinburgh, UK
contact
Carley E. Iles: carley.iles ed.ac.uk
references
Driscoll S et al. (2012) J Geophys Res 117, doi: 10.1029/2012JD017607
Fischer EM et al. (2007) Geophys Res Lett 34, doi: 10.1029/2006GL027992
Iles C, Hegerl G (2014) Environ Res Lett 9, doi: 10.1088/1748-9326/9/10/104012
Iles C et al. (2013) J Geophys Res Atmos 118: 8770-8786
Miller G et al. (2012) Geophys Res Lett 39, doi:10.1029/2011GL050168
Oman LA et al. (2006) Geophys Res Lett 33, doi:10.1029/2006GL027665
Robock A (2000) Rev Geophys 38: 191-219
Robock A, Mao J (1992) Geophys Res Lett 19: 2405-2408
Schneider D et al. (2009) J Geophys Res Atmos 114, doi: 10.1029/2008JD011222
Schurer AP et al. (2013) J Clim 26: 6954-6973
Stothers R (1984) Science 224: 1191-1198
Tilmes S et al (2015) Geosci Model Dev 8, doi:10.5194/gmd-8-43-2015
Timmreck C (2012) WIREs Clim Change 3: 545-564
Trenberth K, Dai A (2007) Geophys Res Lett 34, doi:10.1029/2007GL030524


