How to compare modeled fire dynamics with charcoal records?
Tim Brücher1, V. Brovkin1, S. Kloster1, J.R. Marlon2 and M.J. Power3
An Earth system model of intermediate complexity and a land surface model are used to simulate natural fire activity over the last 8000 years. We demonstrate the benefits of using Z-scores as a metric for validating model output with transformed charcoal records.
Fire is an important process that affects climate through changes in CO2 emissions, albedo, and aerosols (Ward et al. 2012). Fire-history reconstructions from charcoal accumulations in sediment indicate that biomass burning has increased since the Last Glacial Maximum (Power et al. 2008; Marlon et al. 2013). Recent comparisons with transient climate model output suggest that this increase in global fire activity is linked primarily to variations in temperature and secondarily to variations in precipitation (Daniau et al. 2012).
Methodology
In this study, we discuss the best way to compare global fire model output with charcoal records. Fire models generate quantitative output for burned area and fire-related emissions of CO2, whereas charcoal data indicate relative changes in biomass burning for specific regions and time periods only. However, models can be used to relate trends in charcoal data to trends in quantitative changes in burned area or fire carbon emissions. Charcoal records are often reported as Z-scores (Power et al. 2008). Since Z-scores are non-linear power transformations of charcoal influxes, we must evaluate if, for example, a two-fold increase in the standardized charcoal reconstruction corresponds to a 2- or 200-fold increase in the area burned. In our study we apply the Z-score metric to the model output. This allows us to test how well the model can quantitatively reproduce the charcoal-based reconstructions and how Z-score metrics affect the statistics of model output.
The Global Charcoal Database (GCD version 2.5; https://www.paleofire.org/index.php) is used to determine regional and global paleofire trends from 218 sedimentary charcoal records covering part or all of the last 8 ka BP. To retrieve regional and global composites of changes in fire activity over the Holocene the time series of Z-scores are linearly averaged to achieve regional composites.
A coupled climate–carbon cycle model, CLIMBA (Brücher et al. 2014), is used for this study. It consists of the CLIMBER-2 Earth system model of intermediate complexity and the JSBACH land component of the Max Planck Institute Earth System Model. The fire algorithm in JSBACH assumes a constant annual lightning cycle as the sole fire ignition mechanism (Arora and Boer 2005). To eliminate data processing differences as a source for potential discrepancies, the processing of both reconstructed and modeled data, including e.g. normalization with respect to a given base period and aggregation of time series was done in exactly the same way. Here, we compare the aggregated time series on a hemispheric scale.
Modeled fire activity vs. reconstructions
 |
|
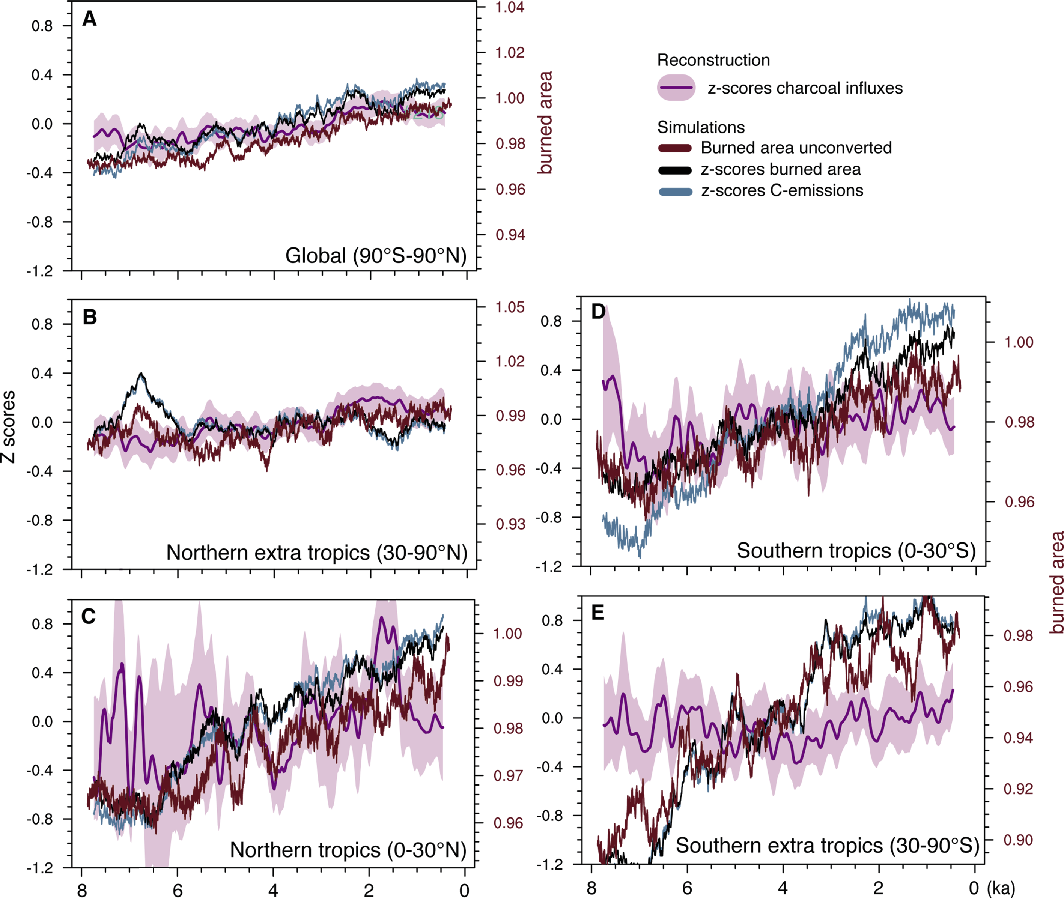
Figure 1: Reconstructed and modeled biomass burning over the last 8 ka. Curves represent zonal averages smoothed with a 250-year running mean on global (A), extra tropical (B, E) and tropical (C, D) scales. Reconstructions are shown by Z-scores of charcoal influxes (pink). Model output is given by untransformed burned area (brown) and by the Z-score transformed values of modeled burned area (black) and fire-related carbon emissions (blue). |
We simulate a global increase of approximately 3% (from 512 to 526 Mha) in burned area over the past 8 ka (Fig. 1A). The burned area is high against present day observations. The model only accounts for fire activity involving natural vegetation because it ignores land use effects. The gradual increase of burned area and the variability on millennial timescales differ between and among regions; however, the modeled time series transformed to Z-scores and the reconstructed charcoal Z-scores agree well within most of the hemispheric regions , except the Southern extra tropics which are dominated by the ocean and therefore only few model grid boxes are available to compare with. Thus, we can state that our model simulates most of the trends in the fire activity reconstructions on millennial scales.
Z-score transformed data do not provide quantitative information about changes in burned area, because the transformation is rank-conserving but not linear. A given difference in Z-score values does not imply the same magnitude in Mha of burned area among Z-scores from a different time interval or region. This suggests that regional averages of transformed and untransformed data may not necessarily result in the same trends. For example two sites with opposite trends e.g. +50% (from 20Mha to 30 Mha) and -50% (from 100 Mha to 50 Mha) would be merged to a constant Z-score of fire activity, in spite of a decrease in the absolute area burned. Thus, with respect to our research question we conclude that it is more meaningful to convert the time series of modeled burned area or carbon emissions to Z-scores for comparing modeled and observed paleofire variability than comparing quantitative data by the model with qualitative trends out of reconstructions. While we do see some general agreement between model results and reconstructions, it is still unclear whether the absolute values of simulated burned area are capturing the right magnitude of past fire activity.
In all regions, the trends in simulated fire-related carbon emissions are higher than trends in simulated burned area (Fig. 1). We propose several reasons for this observation: (i) increasing atmospheric CO2 over the Holocene leads to a higher level of CO2 fertilization. The resulting higher level of carbon stock in the vegetation results in higher emissions per square meter of area burned. (ii) The carbon stock of the fuel can increase with shifts in vegetation type, e.g. from grassland to forest, due to changing climate, or (iii) fire occurrence may be altered by changes in dryness due to climate changes. A rank correlation analysis points to an overall agreement between simulated and observed trends in fire activity over the whole study period, while the rank correlation on 4000-year time segments shows that the model does not match the centennial- or millennial-scale variability (not shown). Model-data agreement on fire variability on these centennial timescales is not necessarily expected. Regional climate affects local fire activity, and due to internal variability there is no reason why the timing of modeled fire events should coincide with the reconstructed timing.
Summary
This study provides a method for validating a model’s capability to simulate past fire activity. Given that our fire model is not tuned by any charcoal data, the overall data-model agreement within climatic zones validates the paleofire activity reconstructions from syntheses of paleofire records in the Global Charcoal Database. Even regions that are sparsely covered by reconstructions correlate positively with the model results. This points to the benefit of using both data and models together to provide more complete spatial coverage of past fire activity.
Further investigations are necessary to test whether the model performs well for the right reasons. If the driving factor for a reconstructed fire trend is known, the factor separation approach can be applied to test the underlying fire algorithm (Kloster et al. 2014). Despite the great work to synthesize all available charcoal records for regional trends, the information is currently limited to quantitative trends, Future studies on model-data comparison should therefore consider transforming model output variables and paleo-proxy data consistently to improve the comparability of simulated and observed data. In this study, we found that the Z-score transformation helped to validate modeled fire occurrence and compare it to charcoal records. From a modelling perspective it would be preferable to get also quantitative information such as type of biomass burning and area burned).
affiliations
1Max Planck Institute for Meteorology, Hamburg, Germany
2School of Forestry and Environmental Studies, Yale University, New Haven, USA
3Natural History Museum of Utah, Department of Geography, University of Utah, Salt Lake City, USA
contact
Tim Brücher: tim.bruecher mpimet.mpg.de
references
Arora VK, Boer GJ (2005) J Geophys Res 110, doi:10.1029/2005JG000042
Brücher T et al. (2014) Clim Past, 10: 811-824
Daniau A-L et al. (2012) Global Biogeochem Cycles 26, doi:10.1029/2011GB004249
Kloster S et al. (2014) Clim Past Discuss, doi:10.5194/cpd-10-4257-2014
Marlon JR et al. (2013) Quat Sci Rev 65: 5-25
Marlon JR et al. (2009) PNAS 106: 2519-2524
Power M et al. (2008) Clim Dyn 30: 887-907
Ward DS et al. (2012) Atmos Chem Phys 12, doi:10.5194acp-12-10857-2012