Freshwater release and volcanic eruptions as drivers of abrupt changes during interglacial climate
D.M. Roche1,2, H. Renssen1, C. Morrill3,4, H. Goosse5 and A. Mairesse5
A suite of model simulations performed within the Past4Future project have investigated the effect of freshwater fluxes and volcanic eruptions on global climate during interglacial climate conditions. Results for the Holocene evidence impacts that persist for centuries to millennia.
Reconstructions of the past climate unambiguously show that climate can shift abruptly on decadal timescales. Evidence of abrupt transitions comes from both the present “Holocene” Interglacial and the Last “Eemian” Interglacial (e.g. Alley et al. 1997; Pol et al. 2014). However, there is still considerable uncertainty concerning the role of the different climate forcings in causing abrupt shifts. Constraining the sensitivity of interglacial climates to each forcing is a pre-requisite for assessing the future risk of abrupt changes and the potential impacts on societies.
To better understand our capacity to reproduce the reconstructed past climate changes, the Past4Future project evaluated the results of large coordinated modeling experiments, including those that exposed interglacial climate to freshwater and volcanic forcing perturbations. We report here on the results regarding (i) the well-known 8.2 kyr cold event and (ii) the effect of volcanic forcing in Holocene transient simulations.
Freshwater forcing of the 8.2 kyr cold spell
The 8.2 kyr event is an abrupt cooling that lasted ~150 years and is clearly identified in water isotopic records from Greenland ice-core records (e.g. Johnsen et al. 1992). It is generally associated in models with a temporary weakening of the Atlantic Meridional Overturning Circulation (AMOC) as a consequence of freshwater forcing pulse; there are data evidences that this is also the case in reality (Kleiven et al. 2008). Though some uncertainties exist on the precise amount, duration, and sequence of the freshwater pulse(s) delivered to the North Atlantic at this time, the cause is generally regarded to be the final drainage of giant North American proglacial lakes that stored deglacial meltwater from the retreating Laurentide ice-sheet (Barber et al. 1999). The largest freshwater contribution into the North Atlantic Ocean likely came from proglacial Lake Agassiz-Ojibway.
The 8.2 kyr event is an easy target for model intercomparison studies because (i) of its short duration, (ii) it occurred at the very end of the deglaciation in a climate relatively similar to our current one, and (iii) of the relatively well-known characteristics of the freshwater pulse. As such, it is accessible for the most recent complex coupled climate models. Additionally, this event is of particular interest since previous modeling studies reported that the resulting oceanic circulation decrease is of comparable magnitude to that obtained in future climate projections by the end of the century (Cheng et al. 2013; LeGrande et al. 2006).
Morrill et al. (2013) analyzed the results of four simulations from three climate models obtained using the 8.2 kyr event simulation scenario proposed within Phase 3 of the Paleoclimate Modelling Intercomparison Project (PMIP3). The three models analyzed are of various complexities and resolution (see Table 1). They show reasonable skill in reproducing the present-day climate, and of particular interest here, the strength of the oceanic circulation. There are, however, notable differences between the models in the regions where deep oceanic waters are formed.
All studied models simulate an AMOC weakening following the imposed forcing anomaly where freshwater was added for one year at a rate of 2.5 Sv (1 Sv = 106 m3 s-1). Generally, the AMOC reduction is a consequence of surface ocean freshening and sea-ice expansion in the North Atlantic. However, the three models show differences in the duration and amount of the AMOC decrease. Two of them show a reduction of 10% of the AMOC and a return to pre-freshwater forcing values within a few decades. However, the third model shows a more substantial 25% AMOC reduction, with a longer lasting response of a century.
 |
|
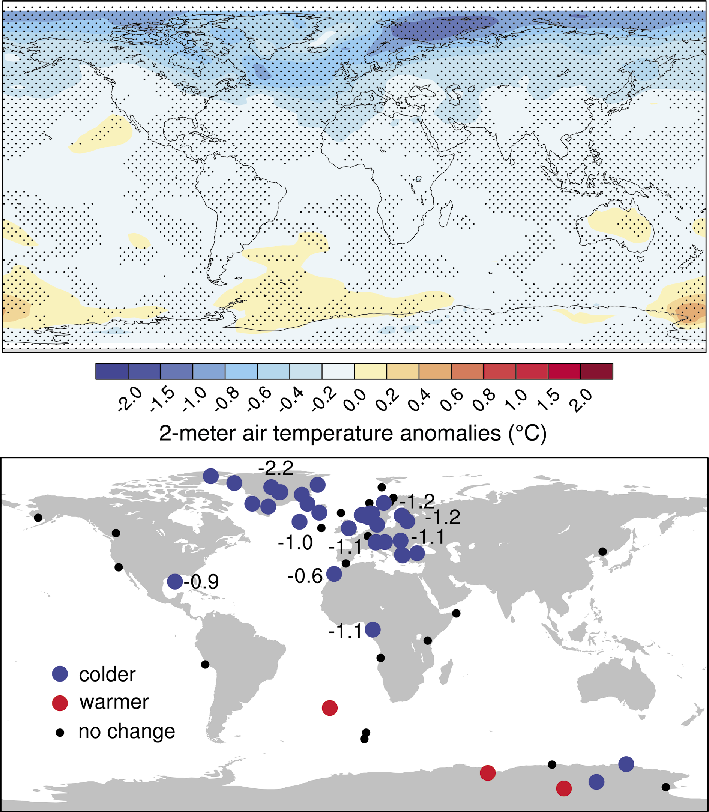
Figure 1: Comparison of mean annual temperature anomalies for the 8.2 kyr event from a multi-model ensemble (top) and proxy evidence (bottom). Stippling shows grid cells where at least three of four simulations agree on the sign of the temperature anomaly. Quantitative estimates of temperature anomalies from proxies are shown in degrees Celsius. |
As a consequence, surface temperature changes are observed in all models (Fig. 1a). Overall, a significant cooling is observed in the Northern Hemisphere, with a reduction in mean annual temperature of less than 0.5°C over most continents and around 1°C over some regions of the North Atlantic. Models also show a consistent pattern of warming of about 0.3°C or less in parts of the Southern Ocean. These features are consistent with the spatial distribution of temperature anomalies from proxy data (Fig. 1b). However, the models generally underestimate the amount of cooling by a factor of two and obtain only a shorter temperature response of just a few decades instead of the observed 150 years.
Analysis of model simulation differences shows that other factors may also influence the model result and account for some of the data-model discrepancies (Morrill et al. 2013). For example, the models may be sensitive to the presence or absence of deep oceanic convection in the Labrador Sea and to the length, amplitude, and other details in the freshwater forcing scenario.
Volcanic forcing of Holocene climate variability
Large volcanic eruptions are, in addition to freshwater releases, another well-known driver of abrupt climate variations. During explosive eruptions, sulphate can be injected into the stratosphere. This yields an enhanced absorption of solar and surface radiation and provokes a net stratospheric heating that in turn results in a net surface cooling. This effect was clearly observed following the Pinatubo eruption in 1991, which cooled lower troposphere temperatures globally by approximately 0.5°C (Dutton and Christy 2012). This cool anomaly lasted up to several years, linked to the lifetime of sulphate aerosols in the stratosphere.
Analysis of historical archives and sulphate deposited on ice-sheets enables us to reconstruct the history of large explosive volcanic eruptions. Volcanic forcing scenarios covering the last 10 kyr were developed to be utilized in climate models, expressed here as radiative impact (Total Solar Irradiance, TSI). The Mt. Tambora eruption in 1815, the largest of the last millennium, had an estimated TSI equivalent impact of 12 W m-2 and large eruptions in the Holocene may have had a magnitude many times greater than that, although the precise number is still uncertain (Mairesse 2014).
 |
|
Figure 2: Global annual mean temperature difference between the simulation with and without volcanism. Gray curve is the unfiltered simulation. Also shown are temperature filtered by a running mean of 101 (red), 251 (blue), 501 (green) and 1001 (pink) years. Note that the vertical scale does not show the whole range of extreme values. The strongest annual global cooling was 6°C (in 6500 BC). |
Using a newly developed volcanic forcing scenario, Mairesse (2014) performed transient fully coupled climate simulations with the LOVECLIM model over the last 10 kyr, with and without including the radiative effect of volcanoes. This enables the impact of large eruptions on Earth's global mean temperature to be analyzed (Fig. 2). The results show a significant (> 0.1 °C) imprint of volcanic eruptions on the simulated global climate. Medium-sized eruptions (injections of ~50 Tg of sulfate) result in recurrent coolings of 0.1 to 0.2°C at the centennial scale. The maximum effect for individual years is much larger but the exact magnitude of the response is still uncertain as the radiative impact of very large eruptions does probably not scale linearly with the sulphate emissions. Without further information, it remains difficult for now to reach a consensus on how to improve the forcing.
Outlook
The reported model experiments suggest that both volcanism and freshwater forcing have a significant impact at the century scale on the Earth's climate during the Holocene. There is a need, however, to refine the relationship between the TSI forcing and the sulfate injections for very large eruptions, since there is no analogue in the instrumental era.
The feedback from human activities on the melting of the Greenland ice-sheet may yield increased freshwater fluxes to the ocean over the course of this century. The strength of the fluxes can in principle be influenced by mitigation measures. While the rate and occurrence of disruptive volcanic eruptions is beyond human control, a risk assessment of their magnitudes and impacts may be useful for planning disaster prevention.
|
Model |
Atmospheric Resolution |
Oceanic Resolution |
Ice-sheet forcing |
pCO2 level |
Meltwater flux |
|
CCSM3 |
T42 (~2.8×2.8°), 26 levels |
1x1°, 40 levels |
Yes/No |
260 ppm |
No/0.05Sv |
|
GISS ModelE-R |
M20 (4×5°), 20 levels |
4x5°, 13 levels |
No |
285 ppm |
No |
|
LOVECLIM1.2 |
T21 (5.625×5.625°), 3 levels |
3x3°, 20 levels |
Yes |
260 ppm |
0.05Sv |
Box 1: Model simulation characteristics. CCSM3 includes two simulations, one with and one without ice-sheet forcing (topography and albedo changes).
affiliations
1Department of Earth Sciences, VU University of Amsterdam, The Netherlands
2Laboratoire des Sciences du Climat et de l’Environnement (LSCE), Gif-sur-Yvette Cedex, France
3Cooperative Institute for Research in Environmental Sciences, University of Colorado, Boulder, USA
4NOAA’s National Climatic Data Center, Boulder, USA
5Georges Lemaître Centre for Earth and Climate Research, Université catholique de Louvain, Louvain-la-Neuve, Belgium
contact
Didier Roche: didier.roche lsce.ipsl.fr
references
Alley RB et al. (1997) Geology 25: 483-486
Barber DC et al. (1999) Nature 400: 344-348
Cheng W et al. (2013) J Clim 26: 7187-7197
Dutton EG, Christy JR (2012) Geophys Res Lett 19: 2313-2316
Johnsen SJ et al. (1992) Nature 359: 311–313
Kleiven HKF et al. (2008) Science 319: 60-64
LeGrande AN et al. (2006) PNAS 103: 837-842
Mairesse A (2014) Analysis of the Holocene climate variability using a data assimilation method applied to the model LOVECLIM, PhD Thesis