“Paleoecological data analysis with R” course for Latin American researchers
Julieta Massaferro1, L. Pérez2, M.E. de Porras3, L. Pérez Becoña4, M. Tonello5 and S. Juggins6
San Carlos de Bariloche, Argentina, 31 March- 6 April 2014
For the first time in Latin America, an intensive one-week course took place on paleoecological data analysis using the free software, R. This course was led by Steve Juggins (Newcastle University, UK), author of the R package “Rioja” for the analysis of Quaternary science data and co-editor of the book Data Handling and Numerical Techniques (Birks et al. 2012).
Twenty early-career paleoecologists from Mexico, Guatemala, Colombia, Chile, Uruguay and Argentina, were selected from over 50 applicants to attend this unique workshop. The course combined theoretical lectures with practicals using datasets from case studies on topics such as exploratory data analysis, data transformation, multiple regression, distance measures and cluster analysis, environmental reconstruction, and age-depth modeling. After the practicals the participants had the opportunity to process their own data. The participants also had the chance to meet other Latin American researchers working with different indicators, and some are now planning to establish an international network to address paleoenvironmental and climatic issues using a multi-proxy approach.
Below we show three examples of analyses made by course participants, illustrating how R was used to analyze preliminary data.
Ordination of pollen samples
 |
|
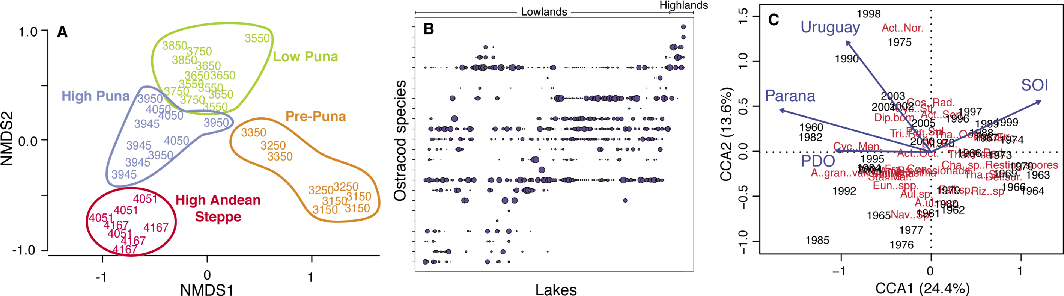
Figure 1: (A) Non-metric multidimensional scaling (NMDS) of a set of pollen samples from modern rodent middens collected along a climatic and vegetation gradient in the Atacama Desert (21°S). The numbers represent the altitudes the samples were taken at. (B) A two-way ordered bubble plot of freshwater ostracods along an altitudinal gradient in Central America. Altitude increases from left to right in the plot, with lowlands <500 and highlands from 500-2000 m a.s.l. Size of dots represents species richness. (C) Canonical Correspondence Analysis of diatom data (1960-2009) in a sediment core from Río de la Plata (red), climate indexes (PDO and SOI), and anomalies in the discharges of the Paraná and Uruguay river discharges (blue arrows). |
María Eugenia de Porras counted pollen in modern rodent middens along a climatic and vegetation gradient from the Atacama Desert to the Altiplano, to identify the modern climate-vegetation signal and develop a modern calibration set. Furthermore, she collected several modern midden samples at every ca. 100 m in altitude to account for pollen signal bias due to the rodent behavior. The results from an ordination analysis (nMDS, Fig. 1A) show that pollen from modern rodent middens reflects a vegetation gradient from the Pre-Puna, to low and high Puna, to High Andean steppe, and therefore the increasing precipitation gradient related to summer rainfalls associated with the South American Summer Monsoon. Furthermore, those samples collected at the same site are grouped together, suggesting that the pollen signal is not biased by the rodent behavior, and thus confirming the potential of middens as paleoclimatic and paleoecological archives.
Ostracods bubble plot
Liseth Pérez established an ostracod training set in Central America across a precipitation and altitudinal gradient to determine the species ecological preferences. The altitudinal distribution of lakes in the study region is strongly skewed towards lowland lakes (Fig. 1B). The highest species abundances and richness are found in the lowlands. There are clearly species restricted to the lowlands and others to the highlands, while few are distributed along the entire altitudinal gradient. Mid-altitude and additional highland lakes will be sampled in future field trips. This type of figure provides a fast overview of species distributional patterns along climatic and environmental gradients.
CCA with diatoms
Laura Pérez Becoña used a Canonical Correspondence Analysis (CCA, Fig. 1C) on diatom data obtained from a sediment core from the Río de la Plata (RdlP), in the inner Uruguayan continental shelf. The analysis combines diatom data (species abundances) for 1960-2009 AD, with instrumental records of climatic (Pacific Decadal Oscillation, PDO and Southern Oscillation Index, SOI) and anomalies in the Paraná and Uruguay River discharges. Positive anomalies in the Paraná and Uruguay River discharges are associated with warm ENSO and PDO phases, which increase the precipitation over the RdlP drainage basin. As a consequence, periods of high river discharge, related to PDO>0 or SOI<0 (El Niño events), are reflected through a higher abundance of freshwater and marine-brackish diatom species in the sedimentary record. In this sense, axis x of the CCA represents a salinity gradient, with fresher conditions (i.e. high RdlP discharge) at the left of the figure moving towards more maritime conditions on the right.
acknowledgements
We thank PAGES, the Municipality of Bariloche, the University of Comahue and the Nahuel Huapi National Park for supporting this course, and the organizing committee, for all the effort. Without their help it would have been impossible for many young scientist to attend the course.
affiliations
1Programa de estudios aplicados a la conservación de la Biodiversidad (CENAC/APN), Bariloche, Argentina
2Instituto de Geología, Universidad Nacional Autónoma de México, México
3Center for Advanced Research in Arid Zones, La Serena, Chile
4Institute of Ecology and Environmental Sciences, University of the Republic, Montevideo, Uruguay
5Institute for Marine and Coastal Research, National University of Mar del Plata, Argentina
6School of Geography, Politics and Sociology, Newcastle University, UK
contact
Julieta Massaferro: julimassaferro hotmail.com
references