Is there a global Holocene climate mode?
Heinz Wanner1,2 and Stefan Brönnimann1,2
The two main millennial-scale Holocene climate patterns or submodes are also significant at the multidecadal to century-scale level.
Large-scale climate patterns and modes are important instruments to characterize prevalent teleconnections and their related processes. Their correlation with forcing factors constitutes an important element of climate diagnostics. The increasing number of data and modeling studies referring to Holocene climate provokes the question whether or not global patterns or modes predominated.
The millennial-scale pattern
 |
|
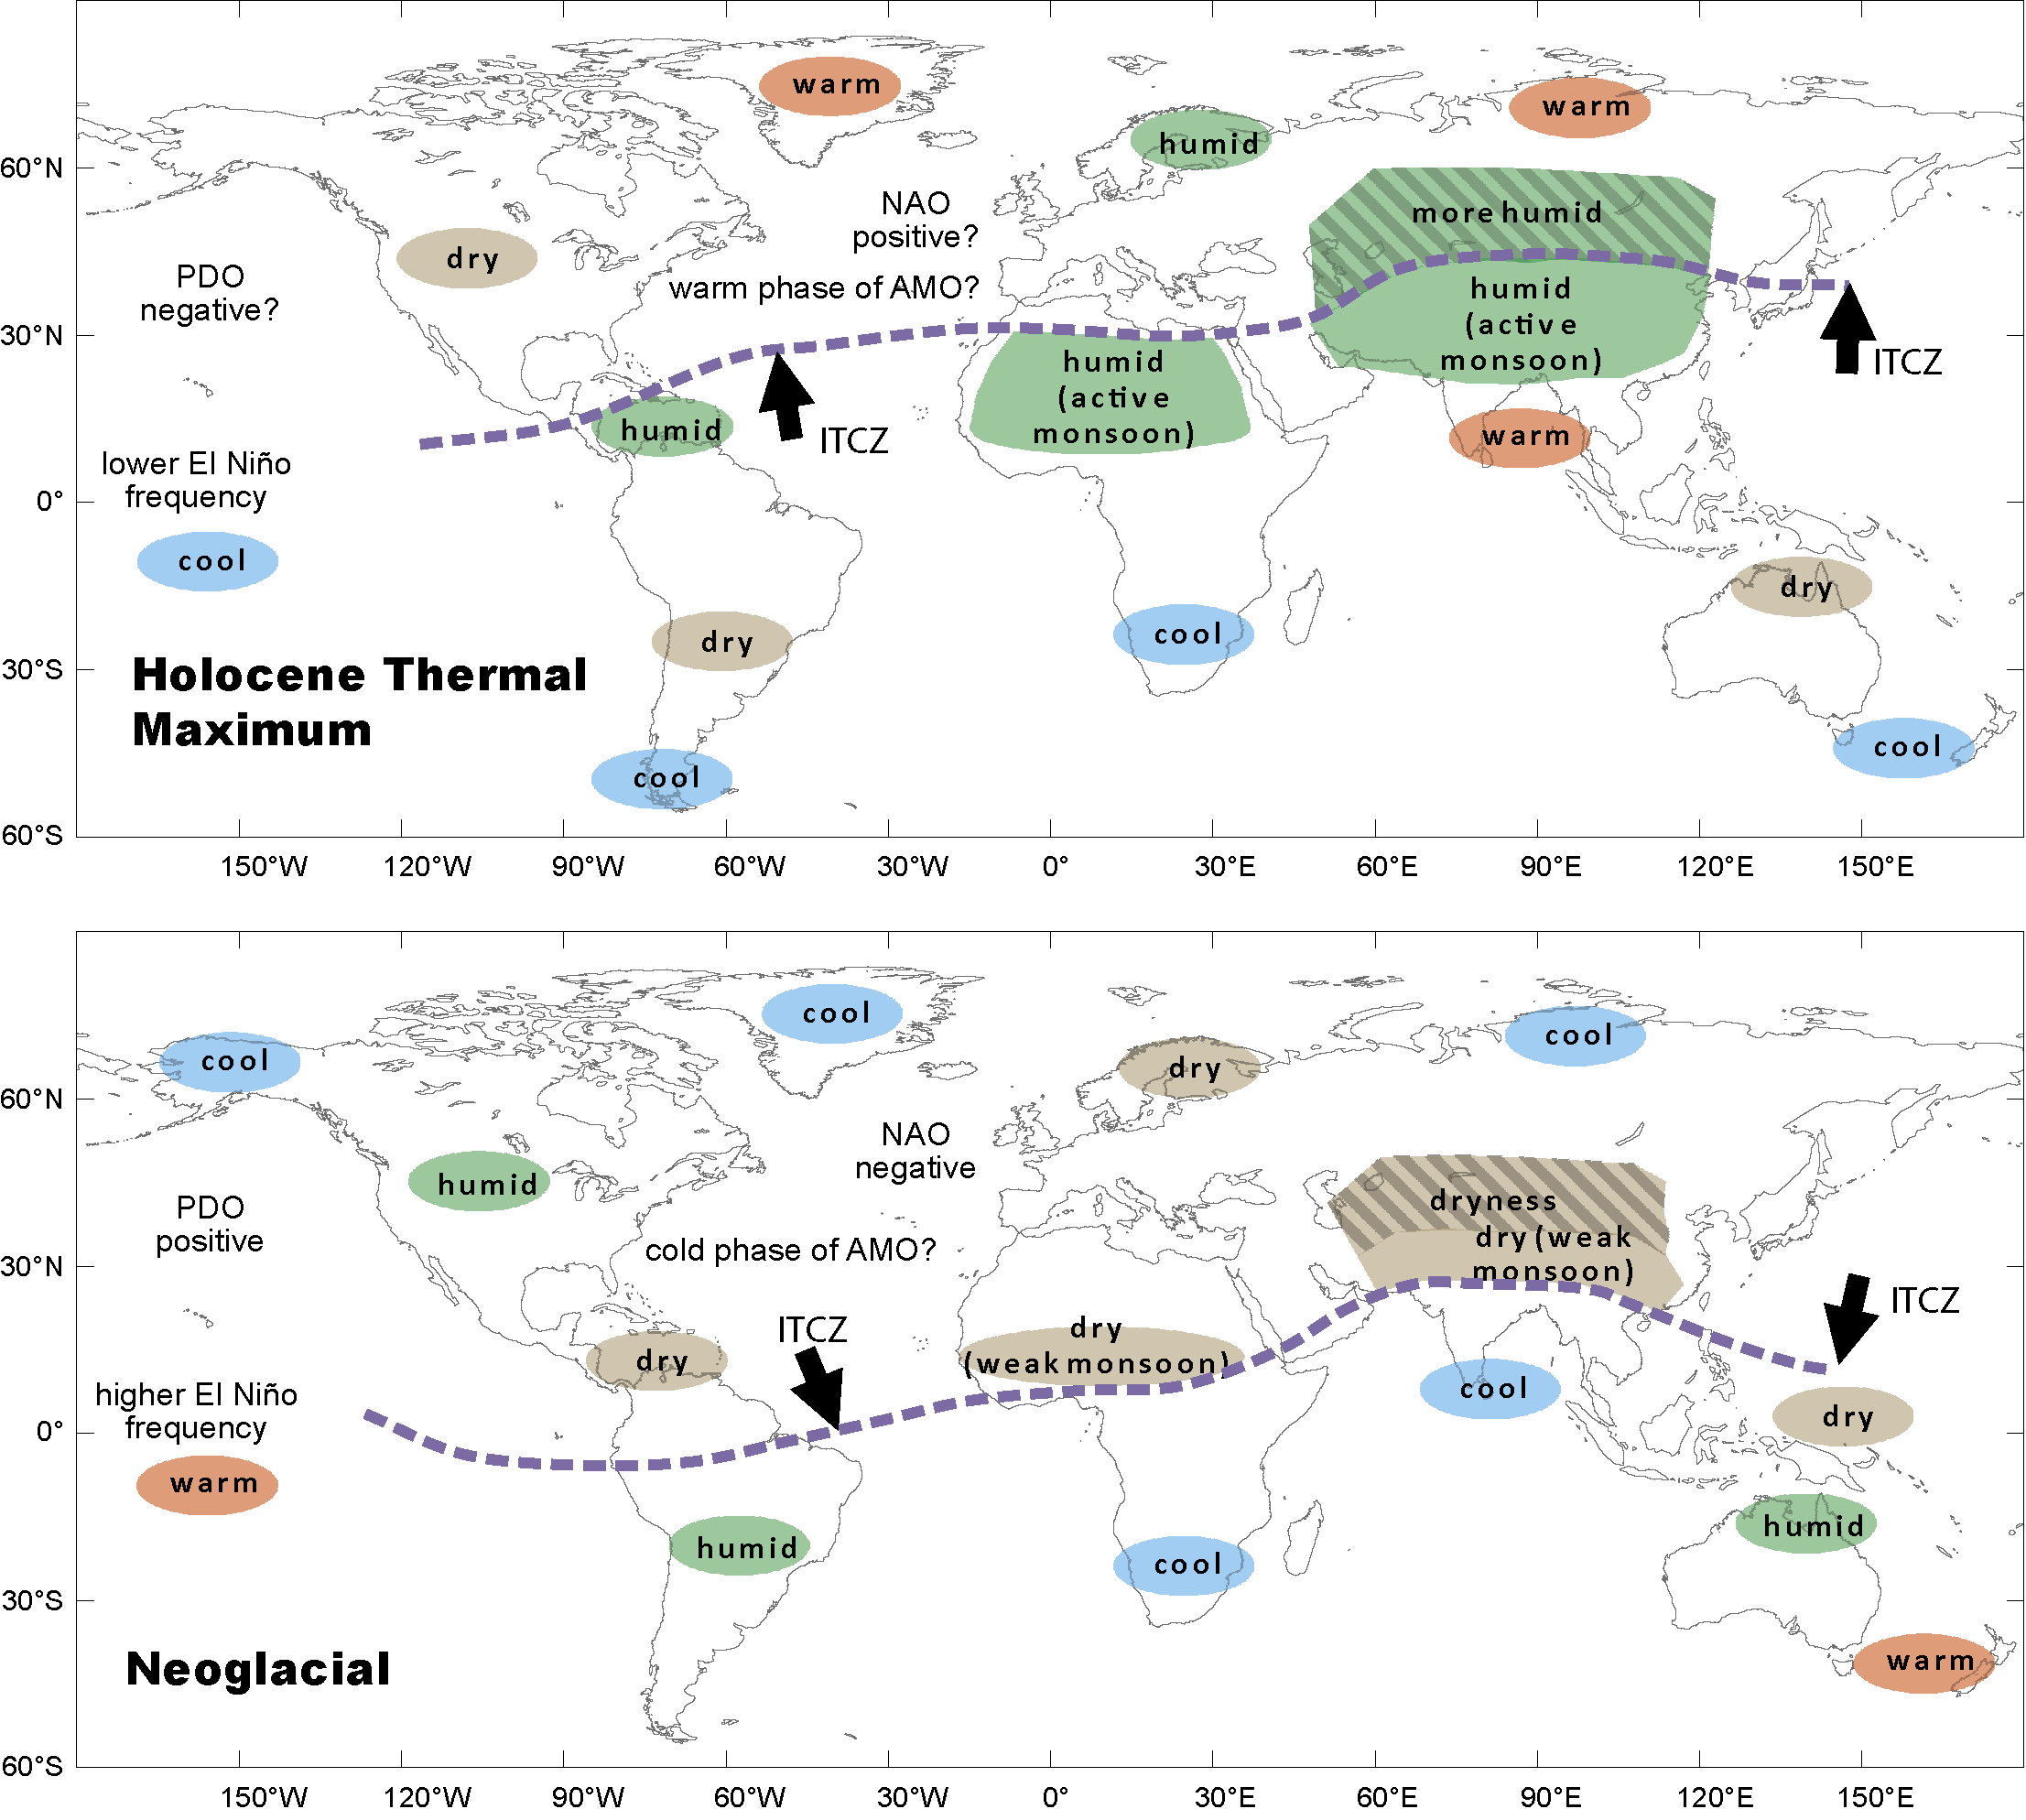
Figure 1: Climate patterns of the Holocene Thermal Maximum (~7-4.5 ka BP; Ljungqvist 2011), and the Neoglacial, which started around 4.2 ka BP and ended with the modern industrialization in the 19th century. Both Figures were outlined based on existing Holocene proxy time series (Wanner et al. 2011). |
The Holocene spans the time period of the last 11.7 ka. During the first 5 ka a reorganization of the hydrographic system due to the melt of the large ice sheets took place (Carlson et al. 2008; Renssen et al. 2007). Apart from the recent decades being influenced by anthropogenic forcing climate change during the period of the last 7 ka was dominated by the decreasing solar insolation in the Northern Hemisphere during boreal summer (Berger 1978; Wanner et al. 2008). Due to this redistribution of solar energy the global climate system experienced rearrangements, which are represented in Figure 1a and b for the Holocene Thermal Maximum (HTM) and the so-called Neoglacial (Wanner et al. 2008).
During the HTM the enhanced heating of the Northern Hemisphere during boreal summer led to a warming generating intensified heat lows and a higher activity of the Afro-Asian summer monsoon systems transporting more moisture to the corresponding continental areas. Positive temperature anomalies in the area of the Indo-Pacific Warm Pool (IPWP) and negative ones in the eastern Pacific area predominated (Xu et al. 2010; Marchitto et al. 2010) and, correspondingly, the El Niño frequency was low (Clement et al. 2000; Rein et al. 2005). For the North Atlantic area some studies (e.g. Rimbu et al. 2003) show that positive North Atlantic Oscillation/Arctic Oscillation (NAO/AO) indices dominated during the early Holocene. No information is available for the Atlantic Multidecadal Oscillation (AMO; Schlesinger and Ramankutty 1994). Even more uncertainties exist in the Southern Hemisphere subtropics and midlatitudes.
An almost opposite pattern existed during the Neoglacial (Fig. 1b). The Intertropical Convergence Zone (ITCZ) shifted to a more southerly position, the Afro-Asian summer monsoon systems were less active, and the corresponding continental areas were exposed to an increasing dryness (Gasse et al. 2000; Haug et al. 2001; Wang et al. 2005). A warmer eastern tropical Pacific and a higher El Niño frequency coincided with predominantly neutral or negative NAO/AO indices and likely led to a more humid climate in the Great Plains and southwestern North America.
A multi-decadal to century-scale Holocene mode explaining climate shifts?
In addition to the orbitally driven solar insolation changes the patterns in Figure 1 were also determined by internal variability, which strongly depends on specific physical boundary conditions, such as land-ocean and sea-ice distribution and topography. In concert with the two other natural forcings (solar, volcanic) characteristic temperature and humidity patterns may have occurred, which could be interpreted as climate modes (Stephenson et al. 2004). One possible way to study long-term global climate variability and change is to investigate the dynamical modes with an annular structure on both hemispheres, expressed by the indices describing the strength of the Westerlies, namely the Antarctic Oscillation (AAO; Thompson and Wallace 2000) and the AO/NAO (Hurrell et al. 2003). The focus of the maps on Figures 1a and b is more directed towards the dynamics in the Atlantic and Pacific areas. The most important mode is located in the Pacific, the area with the highest sea surface temperatures. Its orientation is mostly zonal, and it encompasses the IPWP and the ENSO system, including its connections with the Indian/East Asian monsoon as well as with the Pacific North American Pattern and the Pacific Decadal Oscillation. The orientation of the second mode (NAO/AMO) is rather meridional, including the Atlantic Ocean with the Arctic sea ice and the adjacent continental areas.
How far are ENSO and NAO coupled, and which processes determine the dominating patterns in Figure 1? A first option is to investigate whether or not the two modes are correlated and interact in a systematic manner on short time scales, and then extend the analysis to long time scales. Recent studies (Brönnimann 2007) suggest that a coupling exists, and that it most likely operates through an alteration of the flow over the Pacific-North American-Atlantic sector. However, the coupling is statistically weak and has not been addressed for longer time scales.
A second option is to study the influence of the two major non-orbital natural forcing factors (Shindell et al. 2003): solar and volcanic activity. In case of large tropical volcanic eruptions (Robock and Mao 1995; Fischer et al. 2006) the lower stratosphere is heated more over the tropical regions than near the poles, which accelerates the wintertime polar vortex. Through downward propagation, this can affect the circulation near the ground. Therefore, despite an overall annual mean global surface cooling, the strengthening of the Westerlies (with positive NAO indices) causes higher winter temperatures mainly along the west coasts of the major continents. So-called Grand Solar Minima (GSM; Steinhilber et al. 2009) cause a major cooling especially in the large continental areas of the Northern Hemisphere. Due to their inertia the oceans show a delayed SST response, and negative AO/NAO indices predominate (Shindell et al. 2003; Mann et al. 2009). Whether or not the two forcings affect global climate via altering ENSO is debated (Adams et al. 2003; Mann et al. 2005; Meehl et al. 2009). At least during the early Holocene periods of low solar activity corresponded with El-Niño-like (warm) conditions, weak Asian monsoons and low SSTs in the North Atlantic (Marchitto et al. 2010).
A third option is to study the frequency and the strength of important modes during periods with predominating warm or cold temperature anomalies. On the basis of petrologic tracers in the North Atlantic, Bond et al. (1997 and 2001) postulated a “1500 year” cycle that is supposed to have persisted throughout the Holocene. These cycles were thought to be the Holocene equivalents of the Pleistocene Dansgaard-Oeschger cycles (Alley 2005). Several authors (e.g. Hong et al. 2003; Gupta et al. 2005; Wang et al. 2005) speculated that a link existed between the weak Indian/Asian summer monsoon and the cool North Atlantic climate, which was possibly triggered by solar influence. Recent studies show that different dynamical processes were likely responsible for the existence of the Bond cycles (Wanner and Bütikofer 2009). Prior to the modern warm period with anthropogenic forcing, the last 2 ka included two warmer (Roman Warm Period RWP, Medieval Climate Anomaly MCA) and two cooler periods (Migration Period Cooling MPC, Little Ice Age LIA). It is still debated whether or not those phenomena were global. The solar activity was obviously higher and the volcanic forcing weaker during the RWP and the MCA (Steinhilber et al. 2009), and a shift from positive to negative NAO indices might have occurred during the MCA-LIA transition (Trouet et al. 2009; Mann et al. 2009). Similar to the pattern in Figure 1a multidecadal droughts occurred in southwestern North America during the RWP (Routson et al. 2011) and during the MCA (Seager et al. 2007), possibly linked with La Niña-like conditions and positive NAO indices.
Interestingly, a rapid shift to more humid conditions was observed during the LIA, mainly in the tropics (Wanner and Ritz 2011). Gagan et al. (2004) postulate that the tropical Pacific played a role as a source region of water vapor during the expansion of the LIA glaciers. The LIA was characterized by a coincidence of large explosive volcanic events and strong solar minima (Breitenmoser et al. 2011). While during the MPC a remarkable GSM took place around AD 650 (Steinhilber et al. 2009) the RWP shows neither strong volcanic events nor a GSM. On the other hand the oscillations in the early Holocene (Marchitto et al. 2010) as well as the MCA-LIA transition were exposed to stronger forcings and show patterns similar to the millennial scale ones in Figure 1a and b.
We could therefore pose the question whether or not these patterns represent the features of a characteristic multi-decadal to century scale climate mode. If the two patterns in Figure 1 represent two specific submodes of Holocene climate, the question can be asked whether one of them could dominate in the future under the influence of anthropogenic climate change.
affiliations
1Institute of Geography, University of Bern, Switzerland; wanner oeschger.unibe.ch
2Oeschger Centre for Climate Change Research, University of Bern, Switzerland
selected references
Full reference list online under: http://pastglobalchanges.org/products/newsletters/ref2012_1.pdf
Bond G et al. (2001) Science 278: 1257-1266
Brönnimann S (2007) Reviews of Geophysics 45, doi: 10.1029/2006RG000199
Marchitto TM et al. (2010) Science 330: 1378-1381
Wanner H et al. (2008) Quaternary Science Reviews 27: 1791-1828