Nile flood discharge during the Medieval Climate Anomaly
Fekri A. Hassan
Institute of Archaeology, University College London, UK; fekrihassan hotmail.com
Records of Nile flood discharge from AD 930 to 1450 reveal pronounced variability in the frequency of extreme floods due to differential influence of global climatic forcing mechanisms on the two main catchment areas of the Nile tributaries, namely Equatorial Africa and the Ethiopian Highlands.
 |
|
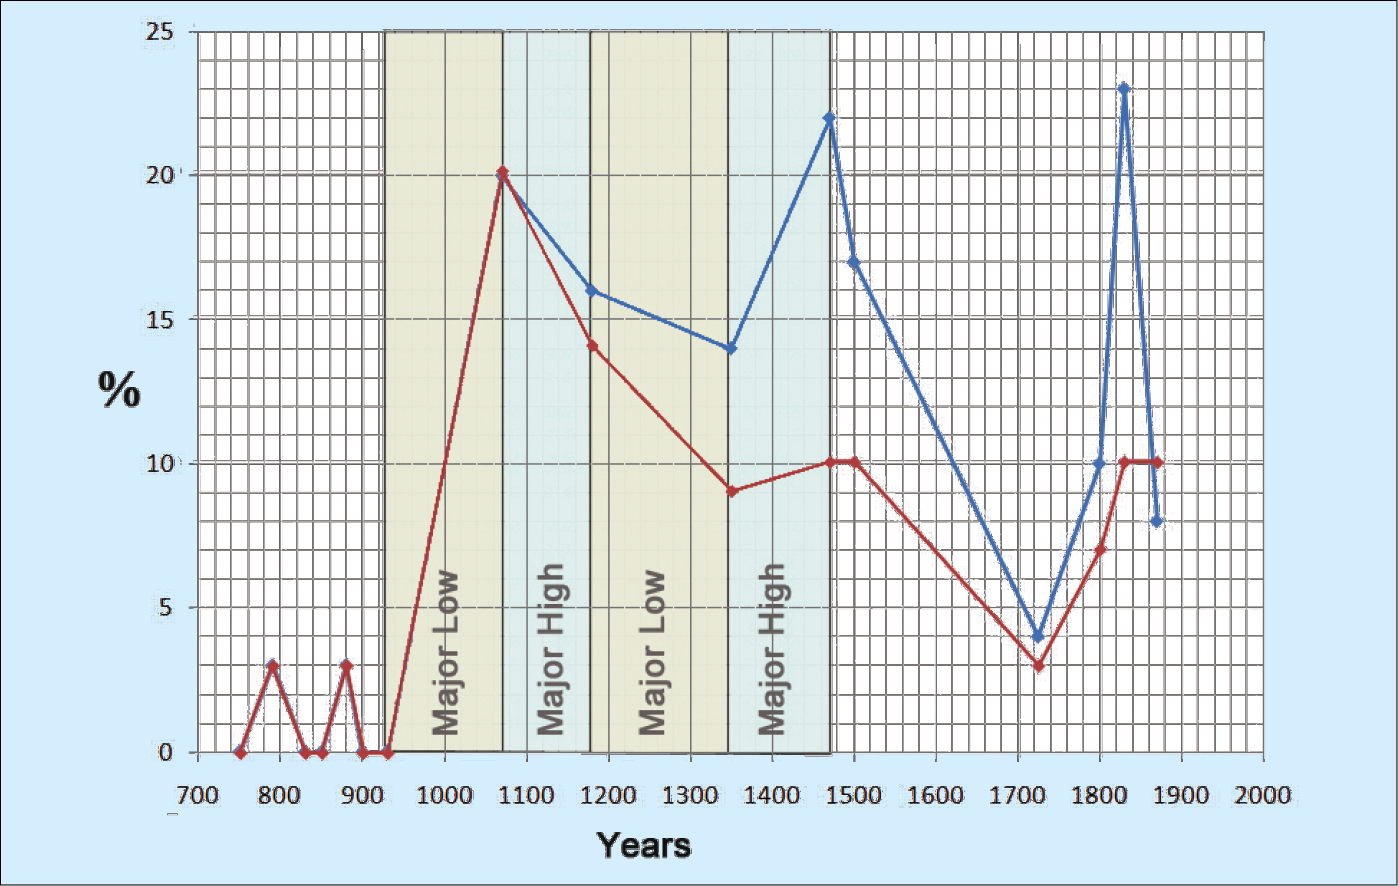
Figure 1: Percentage of anomalously low floods (red) and of both extremely low and high floods (blue) superimposed on the major episodes of low and high Nile flood discharge. |
A record of variations in Nile flood discharge dating back to the 7th century AD (Hassan, 1981) provides a basis for analyzing the relationship between Nile floods, climate change, and famines in Egypt during the Medieval Climate Anomaly (MCA). The volume of Nile flood discharge, as well as its seasonality, is primarily governed by the impact of climate on rainfall over the Nile catchment areas in Ethiopia and Equatorial Africa. Throughout Egyptian history, Nile floods influenced food production, which depended on Nile water for irrigation and the amount of silt annually deposited on the floodplain. Correction and calibration of the primary historical annual records of Nile minimal and maximal flood levels, followed by an analysis of the calibrated data reveal that Nile floods discharge during the MCA interval from AD 930 to 1350 were not constant. Instead, this period is characterized by multi-decadal long episodes of major low Nile flood levels from AD 930 to 1070, and from AD 1180 to 1350, as well as periods of major high Nile flood levels from AD 1070 to 1180 and from AD 1350 to 1470 (Fig. 1).
In addition, examination of the frequency of periods of anomalously extreme Nile floods (i.e., annual floods with unusually high or low levels) with known historical crises (Hassan, 2007) reveals that the onset of the MCA was marked by a dramatic increase of extreme low floods. The percentage climbs from 0-3% to 20% during the period from AD 930 to 1070 and to 14% from AD 1070 to 1180, in spite of an overall increase of the volume of flood discharge during that latter period. Subsequently, from AD 1180 to 1350, the number of extremely high floods increased at the expense of extremely low floods (Fig. 1). This period, characterized in general by a decrease in Nile flood discharge, coincides with the epic droughts that occurred from AD 1209 to 1350 in Californian mountain ranges as documented by tree stumps (Stine, 1994), suggesting a global climatic teleconnection. These droughts, according to Knox (1993), were apparently associated with changes in mean global annual temperature of 1-2°C. Nevertheless, apparently slight climatic changes in mean global temperature from the 9th to the 15th century were associated with pronounced hydrological responses. This is confirmed by the simulation of the hydrology of the Nile in response to different climate change scenarios (Conway and Hulme, 1996): precipitation anomalies were found to produce larger changes in runoff of about threefold magnitude. The high sensitivity of Nile flood discharge to changes in precipitation is further confirmed by recent historical changes with a 20th century (AD 1900-1984) average of 85 billion cubic metres compared to 110 billion cubic meters from AD 1870 to 1899 (Said, 1993).
The impact of fluctuations in Nile flood discharge during the MCA on the geomorphology of the flood plains is attested by the dramatic changes in the area of the capital city Cairo during this period (Hassan, 1997). Until AD 942, the eastern bank of the Nile floodplain was narrow and restricted to the area currently known as Old Cairo (Misr al-Qadima). Almost all of the area now occupied by the city was created in the ensuing period from AD 942 to 1403.
Comparison of the variations in Nile flood discharge with proxies of the North Atlantic Oscillation (NAO; Jansen and Koç, 2000; Baker et al., 2000) demonstrate a remarkable coherence between the fluctuations of Nile flood discharge and variations in North Atlantic sea surface temperature (SST). In general, variations in Norwegian Sea summer SST from AD 910 to 1070, from AD 1180 to 1340, and from AD 1400 to 1500 are inversely correlated with the fluctuations in Nile flood maxima (Jansen and Koç, 2000). By contrast, the Norwegian Sea summer SST variations are positively correlated with the fluctuations in Nile flood maxima from AD 800 to 910, from AD 1070 to 1180, and from AD 1700 to 1800. This “flip-flop” relationship is also manifested when variations in summer sea surface temperatures at Vøring Plateau off central Norway (Jansen and Koç, 2000) are compared with the Nile flood discharge, albeit not synchronously (Hassan, 2007). However, from AD 930 to 1010 and again from AD 1200 to 1350, as well as from AD 1400-1500 and AD 1700-1900 the temperatures at Vøring Plateau are inversely correlated with the height of Nile flood maxima. By contrast, from AD 800 to 850, from AD 1070 to 1180, and again from AD 1350-1400 the relationship is concordant (Hassan, 2007).
Nile flood discharge was also found to be in concordance with the Indian monsoons (Zickfeld et al., 2005), co-varying positively, except for the period from ca. AD 850 to 1080, when they are inversely correlated (Hassan, 2007). This may be in part related to the effect of ENSO and the extreme El Niño events between AD 967 and 1096, which often cause a reduction in Nile flood discharge (Quinn, 1992). Indeed, Nile discharge was low from AD 930 to 1070.
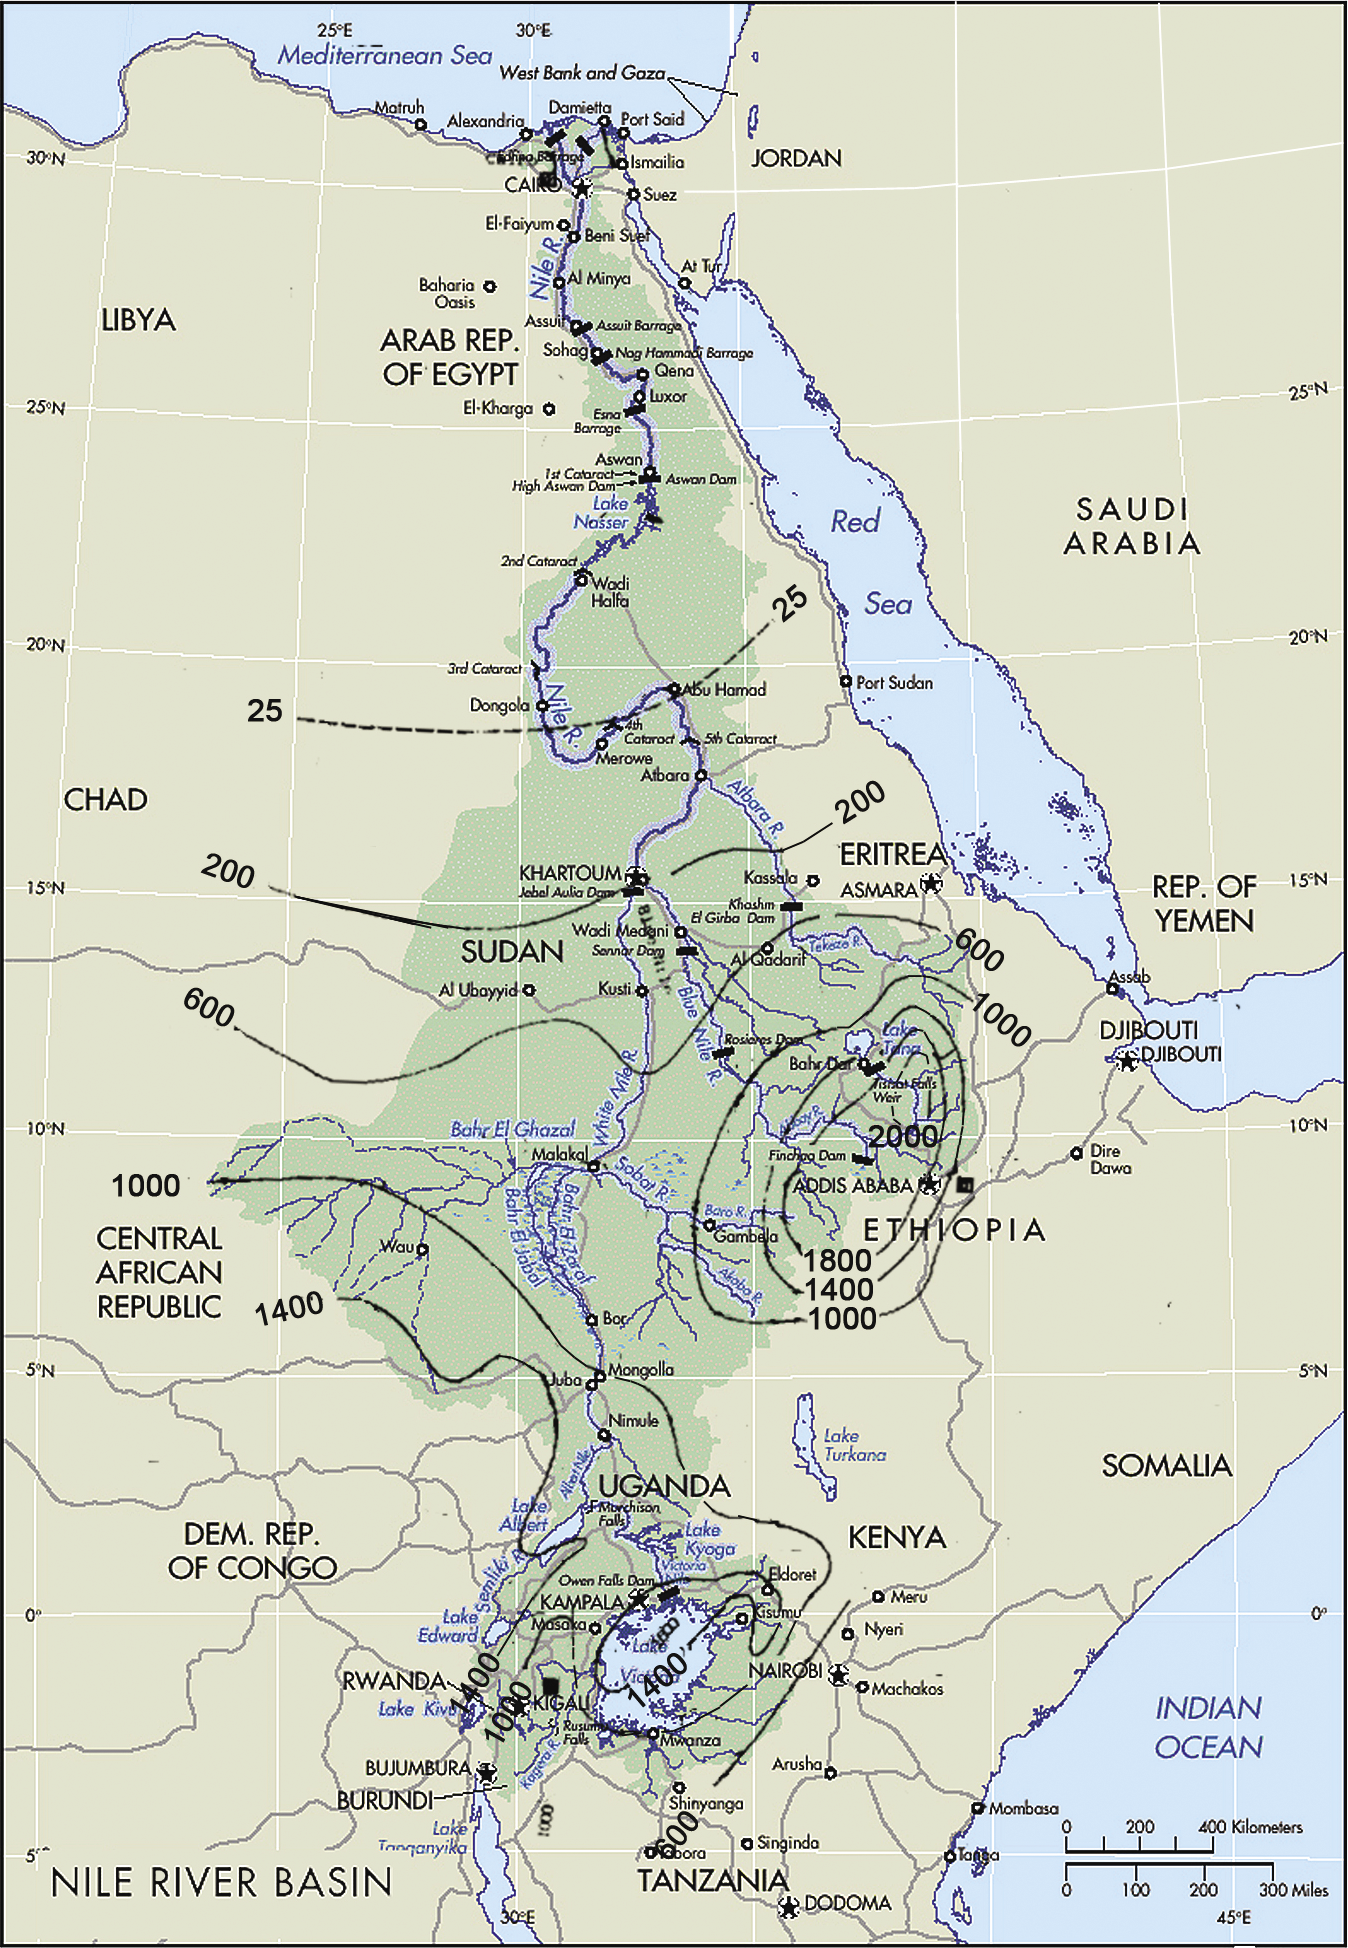
An understanding of the variations in Nile flood discharge must take into consideration the various global and local climatic variables influencing rainfall in the main sources of the Nile. Correlations with proxies of climate change elsewhere are also subject to the peculiarities of the proxies, the integrity of the evidence, and their locations. In this respect, it is particularly important to realize that the main catchment areas of the Nile tributaries—the Ethiopian Highlands (10°N) and the Equatorial Plateau (equator) are more than 1000 km apart and are influenced by different climatic regimes, and that precipitation in the catchments is influenced by the proximity to oceans, highland topography, land surface moisture, lakes and swamps. East Africa, one of the main sources of the Nile, is influenced by ENSO, and the SST of nearby Indian and Atlantic oceans. Farther North, the effect of NAO is more pronounced (Dore, 2005). Zhang and Delworth (2006) concluded that multi-
decadal variability in the Atlantic Ocean could cause observed multidecadal variations of Sahel and Indian summer rainfall. Street-Perrott and Perrott (1990) observed that several prolonged droughts in the Sahel during the past 14 ka were associated with large injections of freshwater into the northern Atlantic Ocean.
 |
|
Figure 2: Nile River Basin showing mean annual rainfall in mm in the main Nile catchment areas in Ethiopia and Equatorial Africa. |
Using proxy data from Scotland and Morocco, Trouet et al. (2009) found persistent positive NAO during the MCA, resulting in stronger than average westerlies across the mid-latitudes and to a northward migration of the Intertropical Convergence Zone, affecting rainfall both in Equatorial East Africa and Ethiopia (the main water sources of the Nile; Fig. 2). This may explain the two wet episodes from AD 1070 to 1180 and again in the transition to the Little Ice Age from AD 1350 to 1470. However, this modality was interrupted by a low discharge episode from AD 1180 to 1350.
The Nile record clearly indicates that a distinct anomaly marked by extremely low floods and an overall diminution in Nile flood discharge lasted from AD 930 to 1070 (Fig. 1). Although the frequency of total extreme floods (blue line) persisted, there was a shift to a higher percentage (ca. +10% from AD 900 to 1350) of extremely high floods relative to extremely low floods (red line). Even though a period of relatively high flood discharge lasted from AD 1070 to 1180, a return to lower flood discharge occurred from AD 1180 to 1350.
By AD 1350 and until 1470, coinciding with a transition to the Little Ice Age, the Nile flood discharge was relatively high. This was associated with an increase in water flow from Ethiopia relative to that from Equatorial Africa (Hassan, 1981). These results indicate that Nile flood discharge in the Main Nile is influenced by multiple variables associated with the differential effects of global climatic mechanisms, such as NAO and ENSO, on the catchment areas in Equatorial Africa and the Ethiopian Highlands. Throughout the period from AD 950 to 1350, famines and plagues have had an adverse effect on society. The famines were in numerous instances caused by clusters of deficient Nile flood discharge, sometimes at close intervals. The deleterious impact of the fluctuations in Nile flood discharge were compounded by the impact of extremely high and low Nile flood discharges on the geomorphology of the channel and floodplain, influencing land use. Shifts in the relative contribution from the Equatorial and Ethiopian tributaries characterized by different rainfall seasons would have also negatively influenced agricultural food production.
references
For full references please consult: http://pastglobalchanges.org/products/newsletters/ref2011_1.html