By Emilie Capron and Nathaelle Bouttes; illustrations: Cirenia Arias Baldrich
Interglacials* are warm periods in the past that can provide key information about changes in the climate. These periods are particularly useful in getting a better idea of what we should expect in the future. And just why is this?
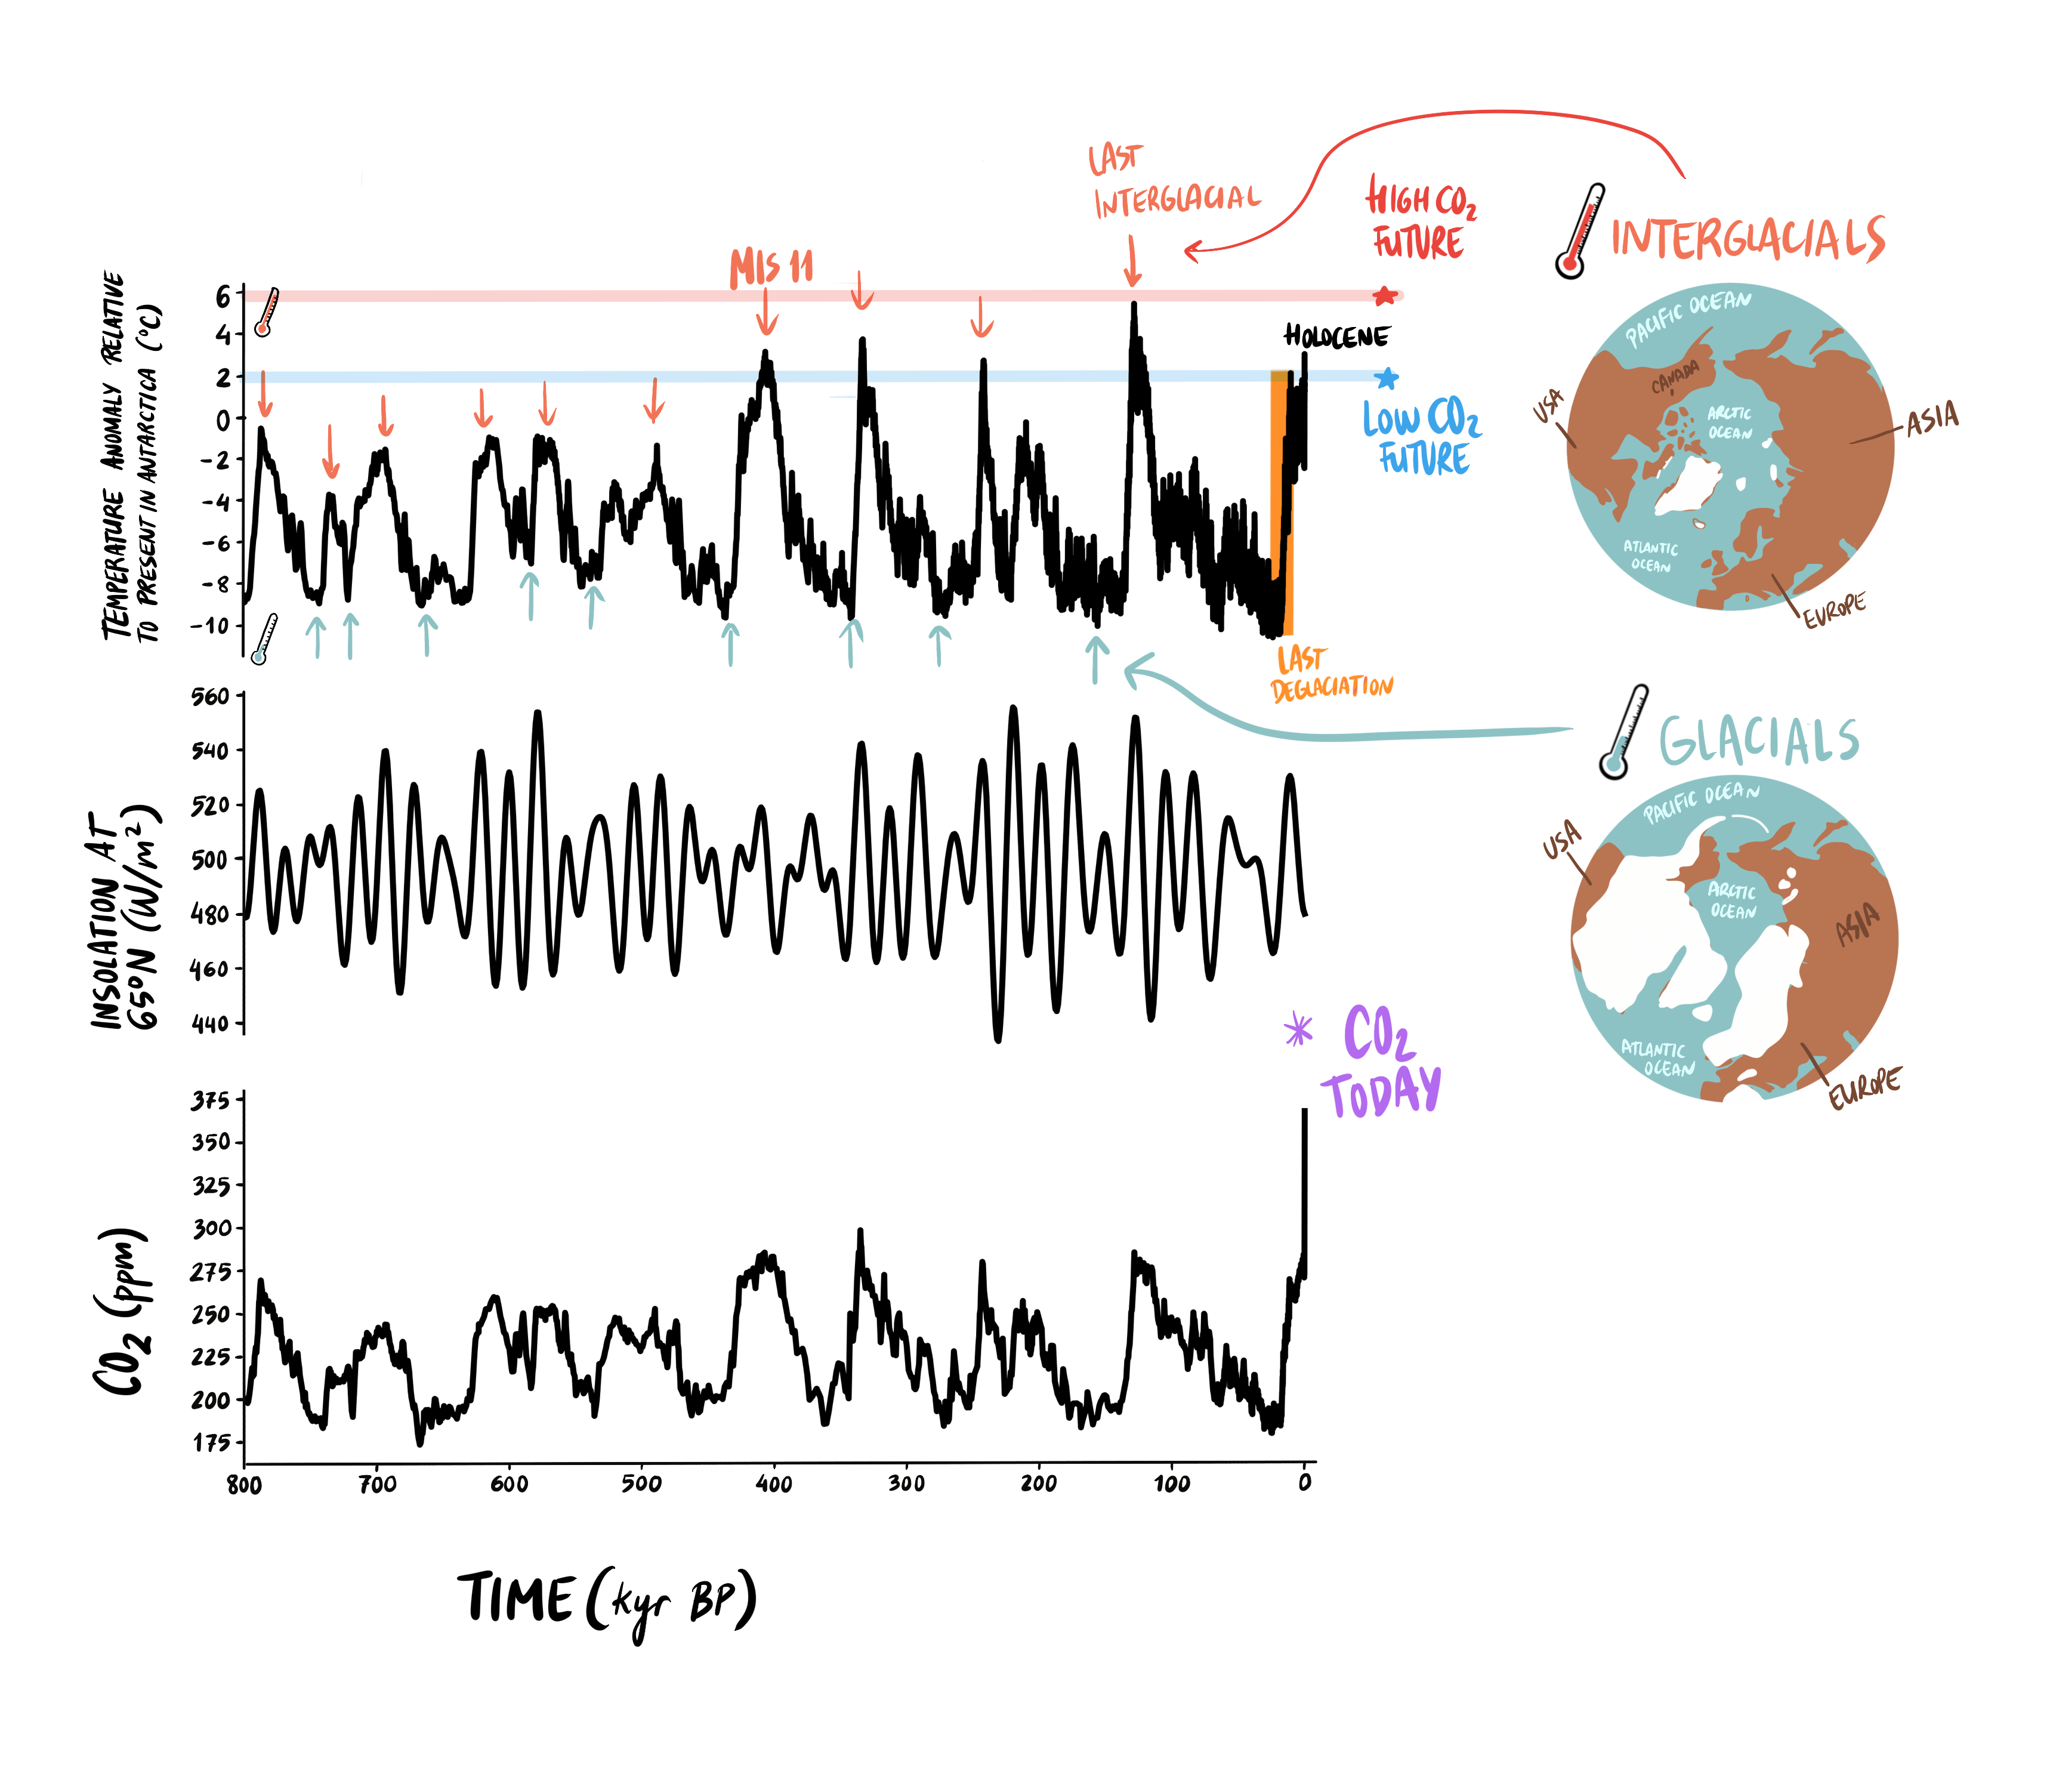
About 50 warm time intervals, referred to as interglacials, punctuated the Quaternary* (the last 2.6 million years). The one we are living today started about 12 thousand years before present (kyr BP) and is called the Holocene (Fig. 2). Each interglacial lasted between about 5 to 27 kyr. Interglacials are characterized by a relatively small amount of ice on the continents in the Northern Hemisphere. During the last four interglacials, the (air) temperature in Antarctica was either similar to, or warmer than, the temperature during the early 1800s (prior to the Industrial Revolution). Interglacials alternate with glacial periods*, also known as ice ages, during which ice sheets* in the Northern Hemisphere grew to cover large areas of Europe and North America (Fig. 2).
The transition from a cold glacial to a warm interglacial is called a deglaciation; this corresponds to a period of significant global sea-level rise and ice-sheet melting. Deglaciations are the largest global climate changes that happened during the Quaternary. To give you an idea of their amplitude and speed, during the Last Deglaciation, temperatures at the surface of the Earth rose by about ~4°C (~7°F) in 10 kyr, while global sea level increased by about 120 m, or almost 400 ft (Fig. 2).
Past interglacials: natural experiments of warm climate Past interglacials represent a series of natural experiments to understand how the climate system reacts to what we refer to as “boundary conditions”. The main boundary conditions defining global climate during the Quaternary are: (1) the amount of incoming sunlight, and where on the Earth’s surface this sunlight is directed (orbital forcings; see Box 1); (2) the concentrations of greenhouse gases*, such as carbon dioxide (CO2) and methane (CH4) in the atmosphere; and (3) the continental ice-sheet volume, which influences global sea level and sunlight reflection (also called “albedo”; see Franchini et al. p. 80).
The onset and course of each interglacial is associated with a unique combination of orbital forcing (the tilt of the Earth, for example) and atmospheric concentrations of greenhouse gases. Because both of these factors affect the size and location of the ice sheets, the ice sheets varied from interglacial to interglacial. Such differences in the boundary conditions from one interglacial to another had effects on the climate during each period. Scientists can learn about these past differences in climate by studying samples from “natural archives” such as polar ice or sediments taken from the deep sea (Box 2). These records of paleoclimate reveal large variations between the different climatic parameters (temperature, ice sheets, etc.) during interglacials. Furthermore, the intensity of these parameters, the order in which changes occurred, and the lengths of the interglacial vary from one interglacial to another (Fig. 2). For example, in some interglacials, the temperature reached its maximum early in the period, and soon after the ice sheets began to melt. In other cases, the maximum temperature wasn’t reached until the end of the interglacial; this was the case, for example, around 400 kyr BP, during an interglacial that scientists call Marine Isotope Stage 11, or MIS 11.
Interestingly, the temperature records from the ice core drilled in Antarctica at EPICA Dome Concordia (see Vauthier and Foxes in Love p. 73) suggest that Antarctica warmed during some of the past interglacials to a similar extent to what is projected to happen over the coming 78 years by climate simulations (Fig. 2). Past interglacials are not strict analogs for future warming: interglacial polar warming results from changes in the Earth’s orbit (Box 1), while future warming is driven by anthropogenic CO2 emissions from fossil fuels.
If you are interested in contributing to the next Horizons issue, to be published in September/October 2023, you can find out more about how to that here.
Deadline for contributions is 31 January 2023.
> Access Horizons volume 2 (2022)
> Access Horizons volume 1 (2021)
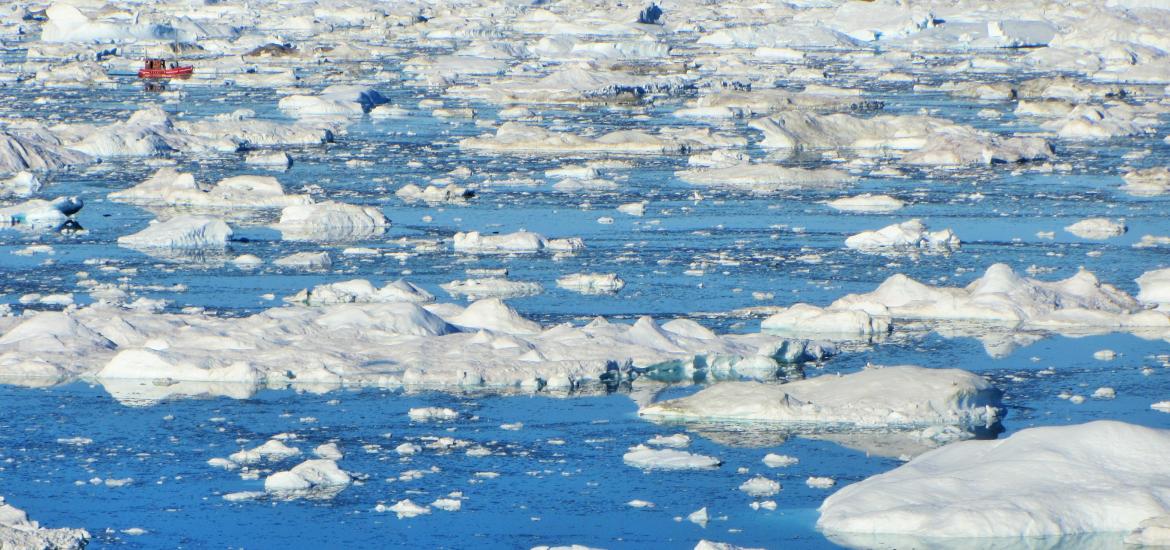
Figure 1 (Cover image). Icebergs from Jakobshavn Glacier. Past warm intervals provide case studies in which we can, for example, assess whether the Greenland Ice Sheet was significantly smaller – this could have caused global sea level to rise by up to 7 m (23 ft)! (Greenland; photo credit: E. Capron).