Peak sea level during the warm Pliocene: Errors, limitations, and constraints

Kenneth G. Miller1, M.E. Raymo2, J.V. Browning1, Y. Rosenthal1 and J.D. Wright1
Re-evaluation of Pliocene sea levels indicates large errors (up to ±15 m), precluding firm estimates. Sea level appears to have peaked at ~10-20 m above present, consistent with some ice loss from the East Antarctic ice sheet (EAIS) as suggested by models and Antarctic sediments. More accurate estimates of Pliocene peak sea level require improved modeling techniques and proxy evaluation.
The Pliocene recorded a period of global warmth and high sea level that can provide constraints on relationships among global climate, atmospheric CO2, and sea-level changes (Raymo et al. 2009, 2011; Miller et al. 2012). Global surface temperatures during the most recent period of Pliocene warmth at ca. 3 Ma were 2–3°C warmer than the 20th century (Dowsett et al. 2013). Pliocene atmospheric CO2 estimates of 400±25 ppmv (e.g. Bartoli et al. 2011) are similar to those observed today.
Published estimates of the peak Pliocene sea level span a wide range, though a peak of 25 m is often cited (e.g. Dowsett et al. 2013). Miller et al. (2012) estimated a peak of 22±10 m by comparing continental margin (Wanganui Basin, New Zealand; VA, USA), atoll (Enewetak), and deep-sea benthic foraminiferal δ18O (δ18Obenthic) and Mg/Ca records. More recent work has shown that much of the variance among continental records can be attributed to regional changes in mantle dynamic topography (MDT) and glacial isostatic adjustment (GIA) (e.g. Raymo et al. 2011) and that estimates derived from continental sections have large errors of ±10 m or larger due to these effects (Rovere et al. 2014). Deep-sea δ18Obenthic and Mg/Ca records potentially provide a means of independently estimating ice volume, and hence global mean sea level (GMSL) variations. For example, Woodard et al. (2014) used δ18Obenthic and Mg/Ca records to provide estimates of the Pliocene peak of 21±10 m. However, Raymo et al. (2018) provided extensive discussion of errors on δ18Obenthic-Mg/Ca method, showing that they are potentially quite large (±15 m or larger) due to diagenesis and changing ocean chemistry over millions of years. These are critical areas for future study and advancement.
Measuring sea level relative to the continents
Continental margins contain a record of over a billion years of sea-level change, though the water depth changes observed as transgressions and regressions reflect many processes including GMSL (eustasy), subsidence/uplift (including MDT), and sediment input/loading. “Backstripping” is a method that progressively removes the effects of compaction, loading, and thermal subsidence from water-depth changes, with the residual reflecting the effects of GMSL and non-thermal tectonism (e.g. Kominz et al. 2016), including changes in MDT.
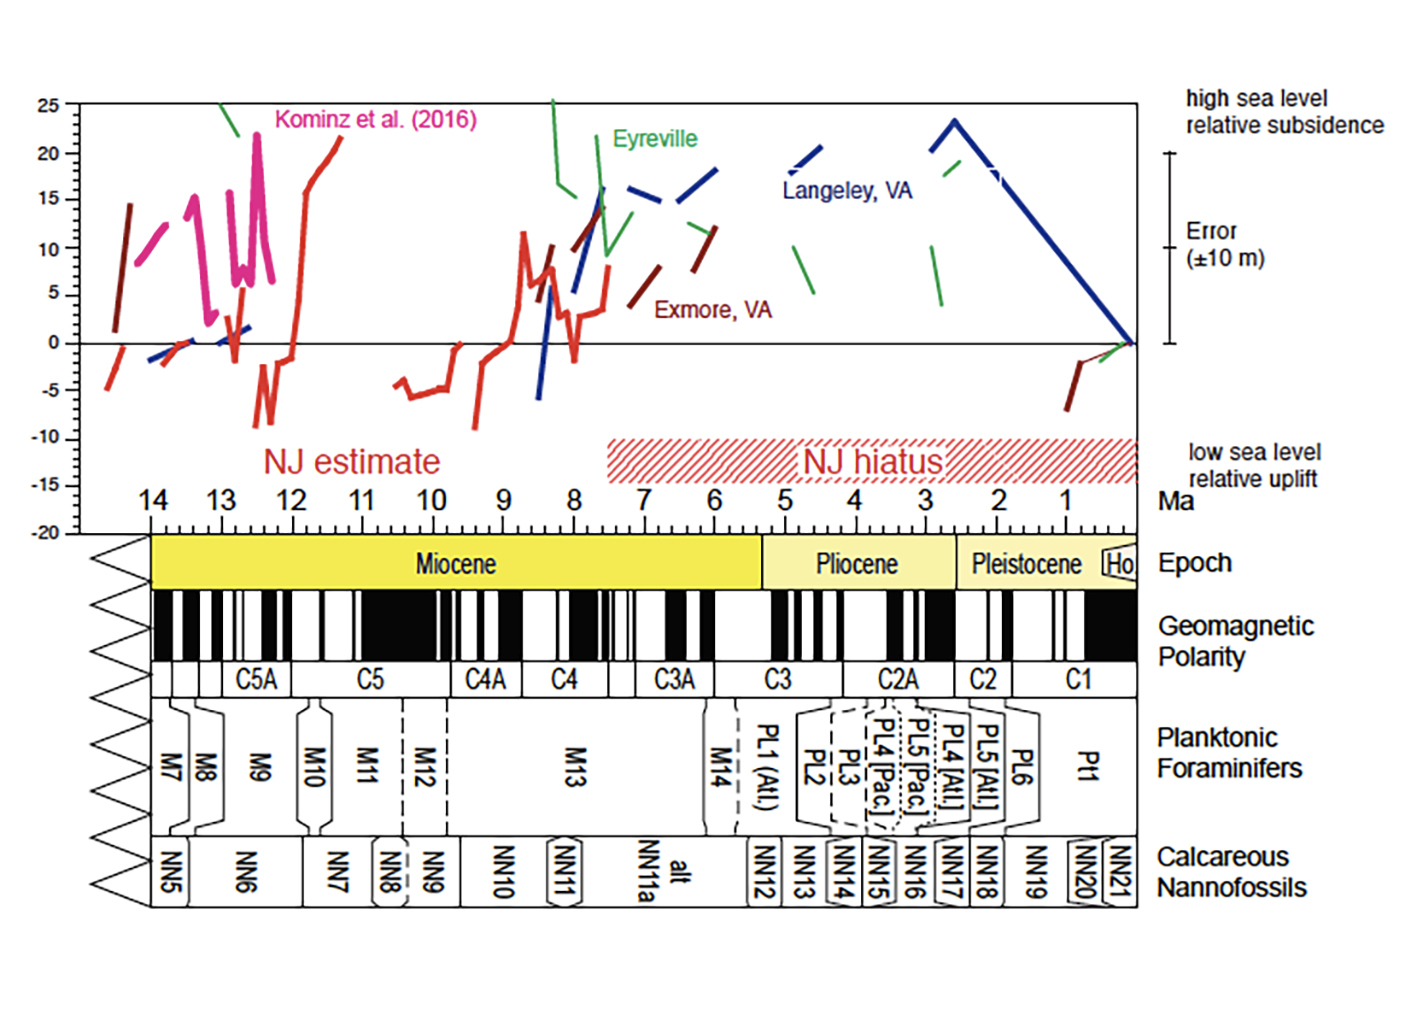
Using the backstripping technique, it is possible to quantify Pliocene differential movement between Virginia (VA) and New Jersey (NJ; Fig. 1). Both records are similar in the Miocene until ~7.5 Myr BP when a hiatus is observed in NJ cores. Backstripping of water depth variations suggests at least ~20 m of differential movement between VA and NJ (Fig. 1). We attribute the difference between VA and NJ to MDT, as suggested by modeling by Rowley et al. (2013). In the absence of other datasets, it would be impossible to tell if VA subsided or if NJ was uplifted (Fig. 1), calling into question the estimates of 17±10 m obtained from the VA records (e.g. Miller et al. 2012).
 |
|
Figure 1: Relative sea level from the US east coast. This figure illustrates differential movement between VA and NJ during the Late Miocene to Pliocene due to MDT as modeled by Rowley et al. (2013). Shown are NJ backstripped estimates (red = Miller et al. 2005; magenta = Kominz et al. 2016), and VA estimates (blue = Langley, purple = Exmore, both after Hayden et al. 2008; green = Exmore after Miller et al. 2012). The marine Miocene section in NJ is replaced by Pliocene upland gravels in outcrop deposited above sea level indicating relative uplift in NJ. |
A new δ18O-Mg/Ca based sea-level record
Previous Pliocene studies used δ18O as a sea-level proxy and relied on the Lisiecki and Raymo (2005; hereafter LR04) benthic foraminiferal δ18O stack (Miller et al. 2011) or Atlantic δ18O and Mg/Ca records overprinted by North Atlantic circulation effects (e.g. Woodard et al. 2014). The LR04 stack incorporates Atlantic and Pacific records though it is weighted toward Atlantic records. LR04 provides a pristine chronology, but like any stack, it shows a reduction in the amplitude of δ18Obenthic signal caused by combining records.
Pacific δ18Obenthic changes reflect variations in deep-water temperature and δ18Oseawater; they are less affected by regional circulation and other changes because the Pacific comprises 60% of the global ocean reservoir. Differences in Pacific δ18Obenthic values between the peak Pliocene values and modern values provide a constraint on high sea-level estimates. The relatively minor difference in δ18Obenthic between the modern and Pliocene in the LR04 stack may possibly be attributed to various biases and not accurately scale to the difference in ice volume (Raymo et al. 2018). Still, Pacific δ18Obenthic values can place constraints on sea level during the mid-Pliocene warm extremes.
Here, we use the best-resolved Pacific benthic foraminiferal (Uvigerina) record compiled from Pacific Site 846 (3°06'S, 90°49'W, 3307 m water depth; data compiled and astronomically dated by Lisiecki and Raymo 2005; lorraine-lisiecki.com/stack.html). At Site 846, the difference between peak Pliocene δ18Obenthic values and modern is ~0.63‰, similar to the 0.5‰ difference observed at Pacific Site 1208 (3346 m water depth; Woodard et al. 2014), but significantly larger than observed in the LR04 stack (0.3‰). Pacific deep-water temperatures during Pliocene interglacials were warmer than present (~1.5±0.5°C warmer from Mg/Ca; Woodard et al. 2014), suggesting that only 0.13-0.25‰ of the δ18Obenthic signal can be attributed to δ18Oseawater and 10-20 m higher sea levels due to melting of ice sheets. Values less than 10 m can also be excluded by our intuition that sea level in the Pliocene was higher than the last major interglacial (Marine Isotope Stage 5e that has a GMSL 8±2 m above present; Dutton et al. 2015) due to the enhanced Pliocene global warmth.
 |
|
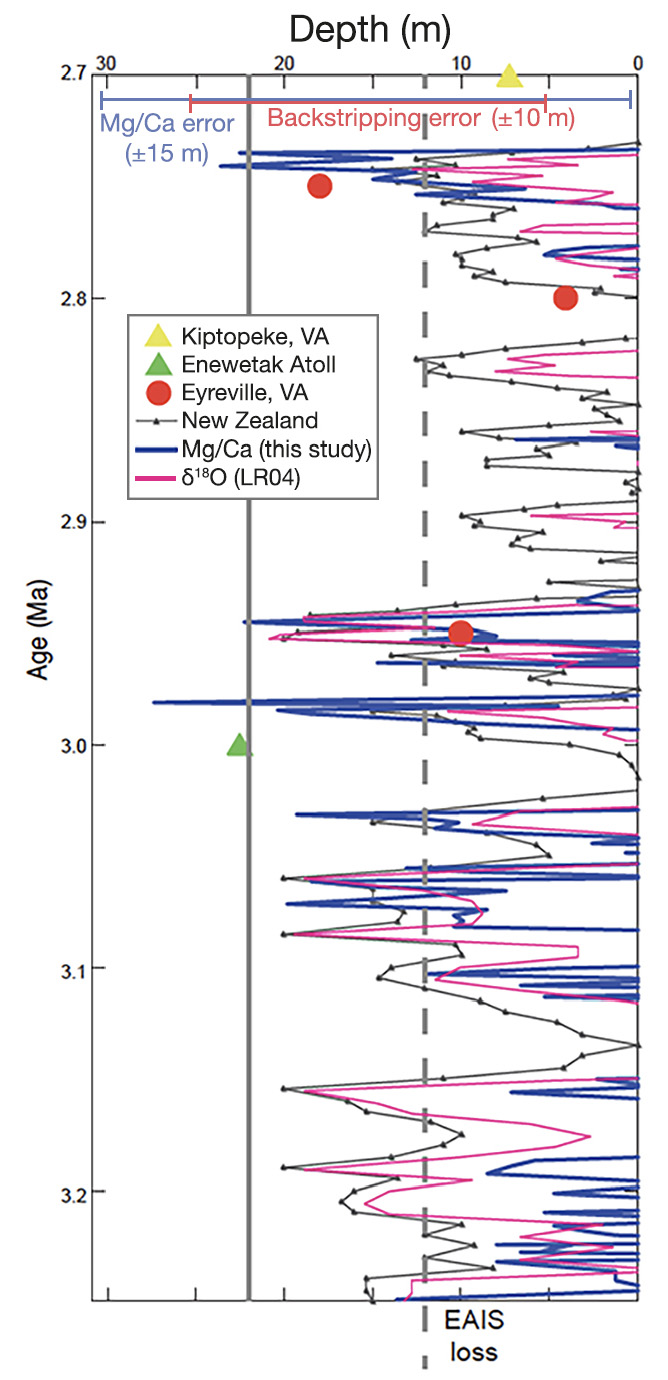
Figure 2: δ18O-Mg/Ca based sea-level estimate updated from Miller et al. (2012). Map shows Exmore (E), Kiptopeke (K) and Langley (L) coreholes and Wanganui Basin (W). Sea levels to the left of the dashed vertical line suggest some melting of the EIAS. |
We use the Site 846 δ18Obenthic record to provide a new sea-level curve following the approach of Cramer et al. (2011), assuming Milankovitch scale (104-105 year) temperature changes comprise ~20% of the δ18Obenthic changes, and the δ18Oseawater-sealevel calibration of 0.13‰/10 m (Winnick and Caves 2015). Comparison of the δ18O-Mg/Ca based sea-level estimate with the backstripped estimates from VA, Enewetak, and New Zealand illustrate general agreement and indicate peak values indicative of some loss of the EAIS, but again with large error estimates (Fig. 2). Given the errors in the various analyses (e.g. up to ±15 m; Fig. 2) it could be argued that any agreement in amplitude is entirely serendipitous. Despite the limitations of these methods at present, it is extremely likely (>95% probability) that maximum Pliocene sea levels were higher than modern, and very likely higher (>90% probability) than the last interglacial (8±2m; Dutton et al. 2015) during the peak highstands of the Pliocene warm period.
Summary and future work
Studies of continental margin and deep-sea sediments have increased age resolution and provided improved constraints on the amplitude of sea-level changes. However, our sea-level estimates have large uncertainties (±10 to ±15 m), thus precluding a definitive statement regarding EAIS melt during the Pliocene. For example, the estimate of 22±10 m could allow melting between 0 and 40% of the EAIS (Miller et al. 2012). The Site 846 δ18Obenthic record places constraints likely excluding values above 20 m. Our best estimate of approximately 12-20 m is consistent with melting of the EAIS in the Wilkes and Aurora sub-basins suggested by models (DeConto and Pollard 2003) and sediment tracer data (e.g. Bertram et al. 2018). Future studies would benefit from improved modeling of the effects of MDT, improved understanding of evolution ocean Mg/Ca and diagenesis, and key observations around Antarctica by ocean/ice drilling to pinpoint active and decaying ice sectors through time.
affiliations
1Department of Earth and Planetary Sciences and Rutgers Institute of Earth, Ocean, and Atmospheric Sciences, The State University of New Jersey, New Brunswick, USA
2Lamont Doherty Earth Observatory and Department of Earth and Environmental Science, Columbia University, Palisades, NY, USA
contact
Kenneth G. Miller: kgm rutgers.edu
references
Bartoli G et al. (2011) Paleoceanography 26: PA4213
Bertram R et al. (2018) Earth Planet Sci Lett 494: 109-116
Cramer B et al. (2011) J Geophys Res 116: C12023
DeConto R, Pollard D (2003) Palaeogeogr, Palaeoclimatol, Palaeoecol 198: 39-52
Dowsett H et al. (2013) Sci Rep 3: 2013
Dutton A et al. (2015) Science 349: aaa4019
Hayden T et al. (2008) Geology 36: 327-330
Kominz M et al. (2016) Geosphere 12: 1437-1456
Lisiecki L, Raymo M (2005) Paleoceanography 20: PA1003
Miller K et al. (2005) Science 310: 1293-1298
Miller K et al. (2011) Oceanography 24: 40-53
Miller K et al. (2012) Geology 40: 407-410
Raymo M et al. (2009) PAGES News 17: 58-59
Raymo M et al. (2011) Nat Geosci 4: 328-332
Raymo M et al. (2018) Earth-Sci Rev 177: 291-302
Rovere A et al. (2014) Earth Planet Sci Lett 387: 27–33
Rowley D et al. (2013) Science 340: 1560-1563