Arctic warming and the Greenland ice sheet during the Last Interglacial

Bette L. Otto-Bliesner1, M. Lofverstrom2, P. Bakker3 and R. Feng4
The Last Interglacial is a recent warm interval with sea level higher than today. Climate modeling groups are simulating this time interval. Here, we illustrate feedbacks from vegetation changes and retreat of the Greenland ice sheet on regional responses to orbital forcing.
The Last Interglacial (LIG, 129 to 116 kyr BP; thousands of years before present, where present is defined as 1950 CE) is recognized as an important time interval for testing our knowledge of interactions between climate and ice sheets in warm climate states that led to deglaciation of the Greenland and potentially western Antarctic ice sheets. The LIG was already recognized as an important time period of relevance for the future in the First Assessment Report of the Intergovernmental Panel on Climate Change (IPCC; Folland et al. 1990). It gained more prominence since the Fourth and Fifth Assessment reports (IPCC AR4 and AR5) with new reconstructions highlighting that global mean sea level was ~6-9 m higher than present for several thousand years (Dutton et al. 2015). Questions remain regarding the contribution of the Greenland ice sheet to this highstand, as well as when and by how much temperatures peaked in the Northern Hemisphere high latitudes.
PMIP4-CMIP6 Last Interglacial simulations
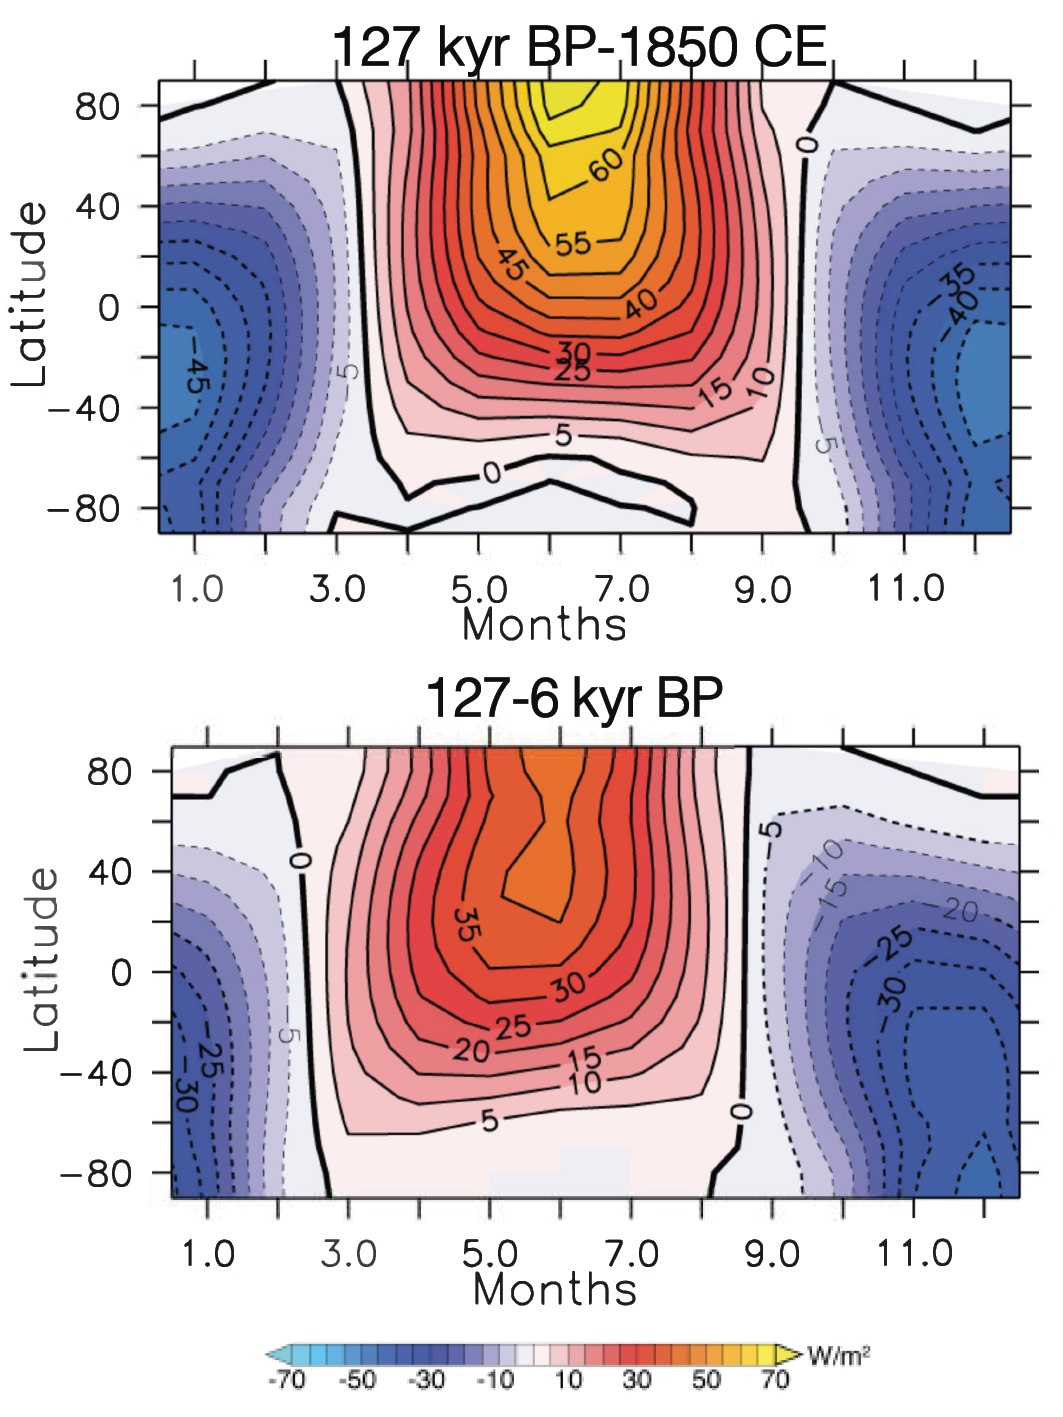
Positive boreal summer insolation anomalies (with respect to present), associated with the orbital configuration of eccentricity, perihelion, and obliquity (Berger and Loutre 1991), occurred in the Northern Hemisphere from about 135 to 122 kyr BP, with maximum anomalies from 130 to 124 kyr BP. Anomalies were greater than 50 W/m2 for July at 65°N from 128 to 124 kyr BP. Correspondingly, negative austral summer insolation anomalies were present in the Southern Hemisphere. Antarctic ice-core records reveal that the greenhouse gas concentrations were relatively constant from 128 to 121 kyr BP; the atmospheric CO2 concentration was stable at pre-industrial values (about 280 ppmv) between 128 and 120 kyr BP (Schneider et al. 2013), while atmospheric CH4 concentrations peaked around 720 ppbv at ~128.5 kyr BP and then declined slowly (Loulergue et al. 2008).
The suite of Paleoclimate Modelling Intercomparison Project (PMIP4) simulations in the Coupled Model Intercomparison Project (CMIP6) include a Tier 1 experiment for 127 kyr BP (lig127k; Otto-Bliesner et al. 2017). It is designed to address and compare the climate responses to orbital forcings stronger than the mid-Holocene experiment for 6 kyr BP (Fig. 1). The CMIP6 lig127k experiment will provide a basis to investigate the linkages between ice sheets and climate change in collaboration with the Ice Sheet Model Intercomparison Project for CMIP6 (ISMIP6; Nowicki et al. 2016).
The CMIP6 lig127k experiment is a time-slice (or equilibrium) experiment for 127 kyr BP. To provide a large ensemble of simulations from many international modeling groups, the boundary conditions are set to allow easy implementation in the same models used for the future scenarios of CMIP6. That is, the orbital parameters and greenhouse gas concentrations are set to represent 127 kyr BP, while the ice sheets (i.e. Greenland and Antarctica) and global land-ocean distribution are the same as in the pre-industrial control run (piControl). Although aerosols and vegetation may be interactive in some CMIP6 models, those without these capabilities are asked to use the same boundary conditions as in their piControl simulation.
Vegetation feedbacks
Vegetation during the LIG responded to the latitudinal and seasonal insolation changes associated with the orbital forcing. Pollen and macro-fossil evidence show that boreal forests extended farther north than today and, except in Alaska and central Canada, extended to the Arctic coast (CAPE 2006; LIGA 1991). Given the impact of increased forest cover on albedo and evapotranspiration, these vegetation changes, not included in the CMIP6 lig127k experiment unless models realistically simulate them interactively, could have had significant impacts on the surface energy budget in the Arctic, amplifying high-latitude warming (Swann et al. 2011).
 |
|
Figure 1: Latitude-month insolation anomalies for 127 kyr BP minus 1850 CE and 127 minus 6 kyr BP. |
To quantify the strength of this climate-vegetation feedback for explaining the inferred Arctic and Greenland warmth during the LIG, PMIP4-CMIP6 also includes a 127 kyr BP Tier 2 experiment where the vegetation cover at Northern Hemisphere high latitudes is changed from tundra to boreal forest. Simulations with the pre-release versions of the Community Earth System Model (CESM) v. 2.0 coupled to the Community Ice Sheet Model (CISM) v. 2.0 indicate that Arctic vegetation responses to the direct orbital warming are important for simulating high-latitude warming and sea-ice extent, and retreat of the Greenland ice sheet and its contribution to the LIG sea-level highstand.
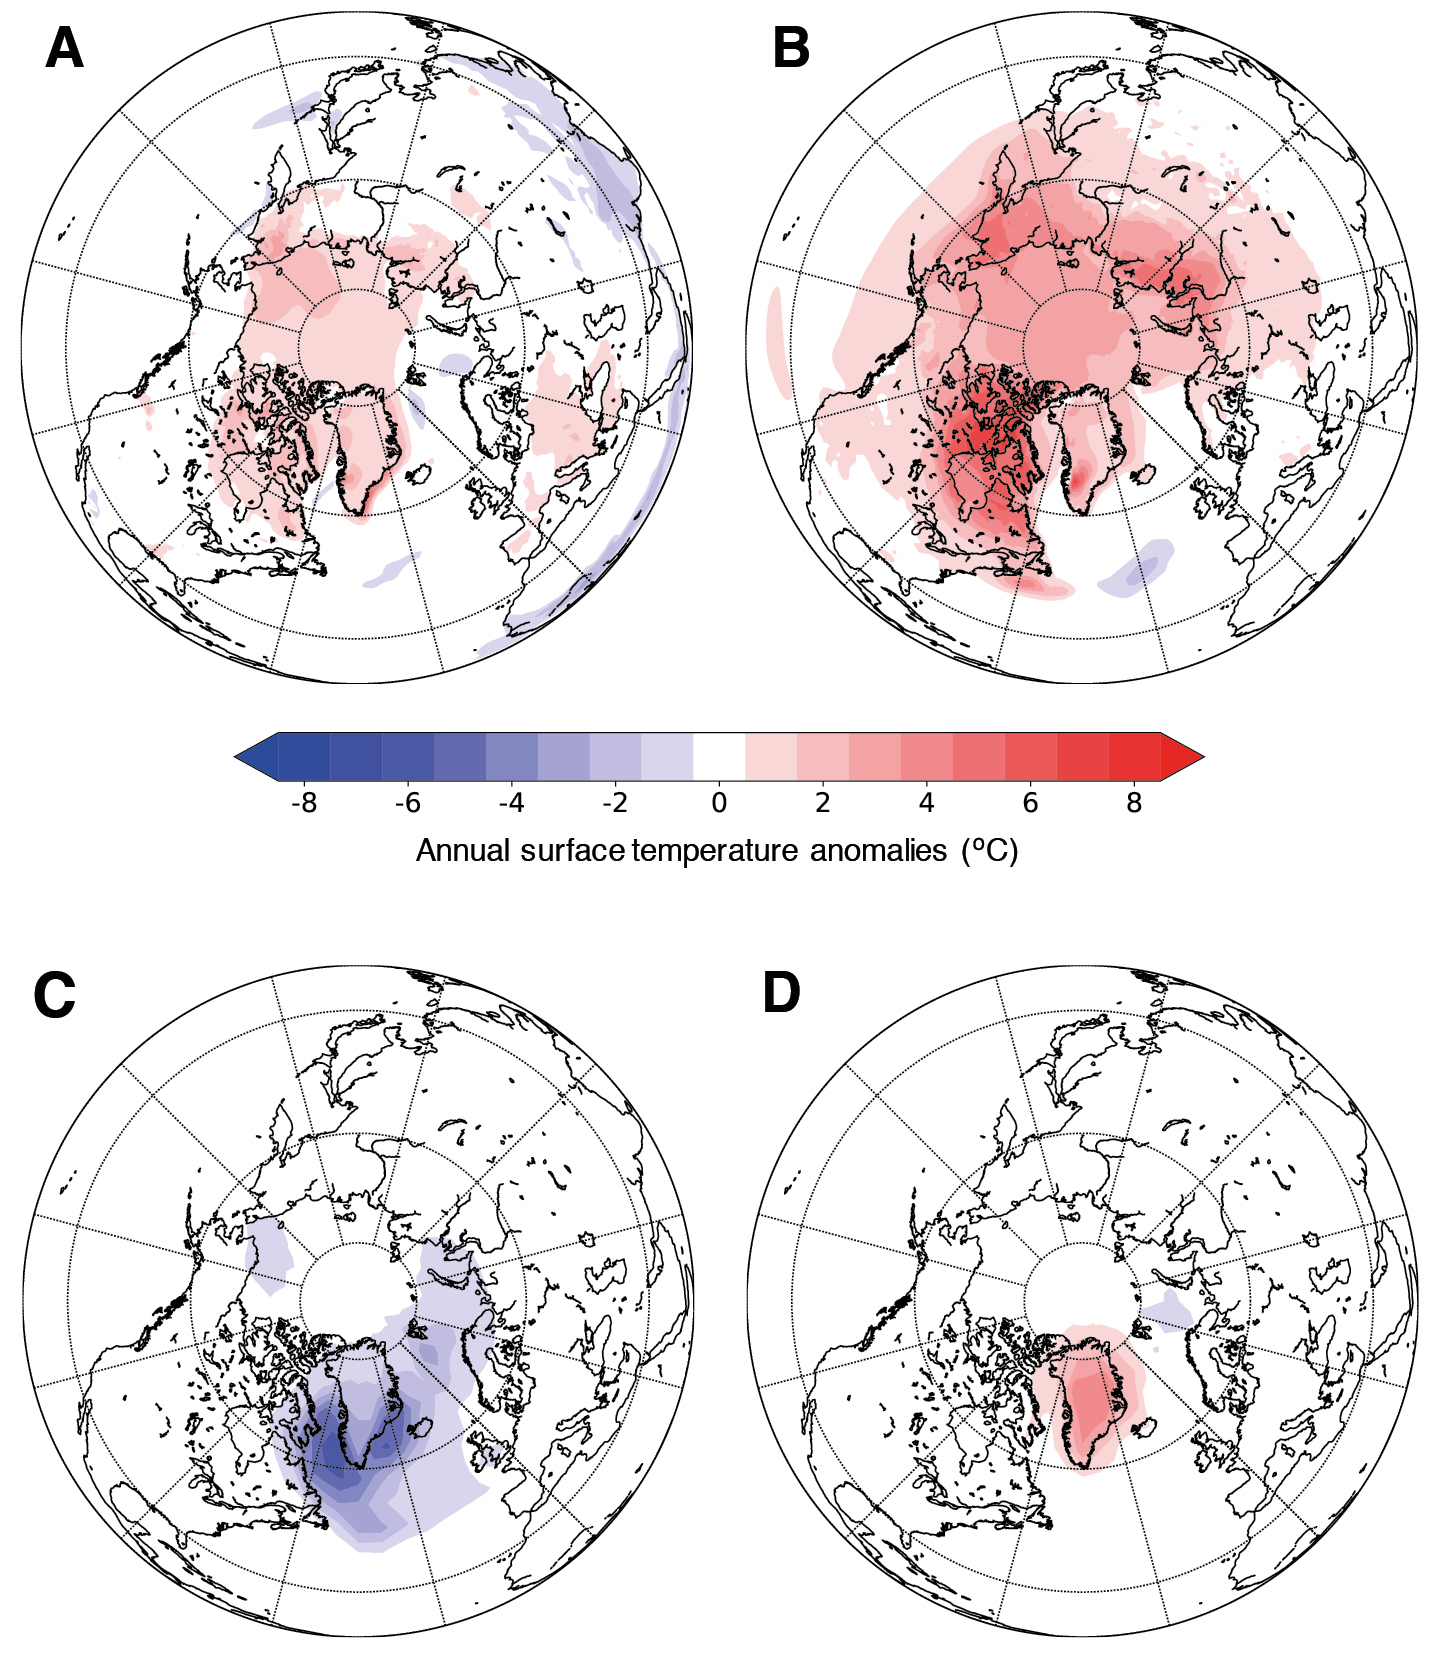
With orbital and GHG forcing only in a 127 kyr BP CESM-CISM simulation (Fig. 2a), the Arctic and Greenland are warmer than pre-industrial annually, but only modestly, by ~1-2°C over northern North America and northern Eurasia, and ~2°C in western Greenland. The memory of the cryosphere and positive feedbacks from changes in surface and cloud albedo amplify the warmer boreal summer temperatures and reduce sea-ice extent through the boreal winter months. The ice sheet over Greenland retreats minimally in western Greenland, retaining most of the modern ice-sheet area. The overall Greenland surface-mass balance remains positive with Greenland contributing only about 0.5 m of equivalent global sea-level change over 3000 years. The global, annual surface temperature change is ~0°C, similar to the results of LIG simulations assessed in the IPCC AR5 (Masson-Delmotte et al. 2013).
With the prescribed high-latitude vegetation change of the 127 kyr BP Tier 2 experiment, the simulated annual warming increases in the Arctic, particularly over northern Siberia and northeast Canada, where the feedback between vegetation and surface warming is responsible for an additional warming of ~4-8°C (Fig. 2b). Annual surface temperature change compared to the pre-industrial control run in the northwest of Greenland is greater than 4°C and in the southwest greater than 7°C. After 3000 years of 127 kyr BP forcing and feedbacks, the Greenland ice sheet has retreated significantly along its west periphery, with a total ice-sheet area of ~85% of modern and contributing ~2 m sea level equivalent to the LIG highstand.
 |
|
Figure 2: Annual surface temperature anomalies (°C) as simulated by climate models for the Last Interglacial. (A) LIG (orbital and GHG forcing) minus PI (preindustrial control); (B) LIGveg (LIG plus high-latitude tundra replaced by boreal forest) minus LIG; (C) LIGmwf (LIG plus Greenland meltwater to North Atlantic) minus LIG; and (D) LIGgris (LIG plus albedo and topography changes for retreat of Greenland ice sheet) minus LIG. (A) and (B) are from 127 kyr time-slice simulations with CESM-CISM, (C) and (D) are from 130 kyr BP time-slice simulations with LOVECLIM. |
Effects of the retreating Greenland ice sheet
Other slow feedbacks are also important for explaining regional Arctic and Greenland changes. As the Greenland ice sheet retreats under warmer summer temperatures, meltwater is discharged into the North Atlantic Ocean. This freshwater has the potential to slow down the Atlantic Meridional Overturning Circulation (AMOC) and cool the North Atlantic and surrounding continental regions, depending on the rate and amount of meltwater discharged. Thus, meltwater resulting from the retreat of the Greenland ice sheet can provide a negative feedback to the orbital warming. Simulations for 130 kyr BP with the LOVECLIM model (Bakker et al. 2012) indicate a reduction of the deep convection and cooling of ~4-6°C in the Labrador Sea when a constant runoff flux of 0.05 Sv, equivalent to 2.3 m of Greenland melt, is added for 500 years to ocean grid cells surrounding Greenland (Fig. 2c). Warmer July surface temperatures as compared to pre-industrial still persist over the Nordic Seas and Europe. Lowering the Greenland ice sheet, on the other hand, results in a local warming over Greenland of up to 4°C (Fig. 2d).
Future outlook
Uncertainties in the boundary conditions for the LIG suggest that the PMIP4-CMIP6 lig127k simulation, designed to maximize the multi-model ensemble size, may not capture important feedbacks for explaining the observed Arctic warmth and for assessing the contribution of the Greenland ice sheet to the LIG sea-level highstand. Future Earth system models will need to include next-generation dynamic global vegetation models with considerations of climate, soil, and vegetation competition; a Greenland ice-sheet model with predictive ice-ocean interactions; and eventually solid Earth models, in order to simulate both fast and slow feedbacks of the entire Earth system on the transient evolution of the Greenland ice sheet during the Last Interglacial. Equally important will be new LIG reconstructions detailing the range and composition of vegetation at high latitudes, volume and flow pattern of the Greenland ice sheet, volume and extent of sea ice, and state of the ocean circulation.
affiliations
1Climate and Global Dynamics Laboratory, National Center for Atmospheric Research, Boulder, USA
2Department of Geosciences, University of Arizona, Tucson, USA
3Department of Earth Sciences, Vrije Universiteit Amsterdam, The Netherlands
4Center for Integrative Geosciences, University of Connecticut, Storrs, USA
contact
Bette L. Otto-Bliesner: ottobli ucar.edu
references
Bakker P et al. (2012) Clim Past 8: 995-1009
Berger A, Loutre M-F (1991) Quat Sci Rev 10: 297-317
CAPE-Last Interglacial Project Members (2006) Quat Sci Rev 25: 1383-1400
Dutton A et al. (2015) Science 349: aaa4019
LIGA members (1991) Quat Int 10-12: 9-28
Loulergue L et al. (2008) Nature 453: 383-386
Nowicki SM et al. (2016) Geosci Model Dev 9: 421-4545
Otto-Bliesner BL et al. (2017) Geosci Model Dev 10: 3979-4003