The 8.2 kyr event: Benchmarking climate model sensitivity to ice-sheet melt
Lauren J. Gregoire![]() 1 and Carrie Morrill
1 and Carrie Morrill![]() 2
2
A century-long cooling of the Northern Hemisphere, caused by accelerated melting of the North American ice sheet 8,200 years ago, offers a critical benchmark of the sensitivity of complex climate models to change.
During the past 10,000 years, the climate has been remarkably stable compared to the natural changes that occurred during glacial periods. However, about 8,200 years ago, the so-called "8.2 kyr event" disrupted this climatic stability. A sharp and widespread cooling of 1–3ºC that lasted about 160 years (Fig. 1) can be seen in geological records across the Northern Hemisphere. This was nicknamed the "Goldilocks"* event (Schmidt and LeGrande 2005), because it is one of the few past climate changes that could truly test the ability of complex climate models to respond to changes in the ocean circulation induced by meltwater inputs to the North Atlantic. The event's "just right" features include a duration suitable for model simulations, an amplitude large enough to be recorded by proxies, relatively abundant paleoclimatic records for comparison to model output (Morrill et al. 2013a), and meltwater forcing that has been quantified (e.g. Li et al. 2012; Lawrence et al. 2016; Aguiar et al. 2021).
 |
|
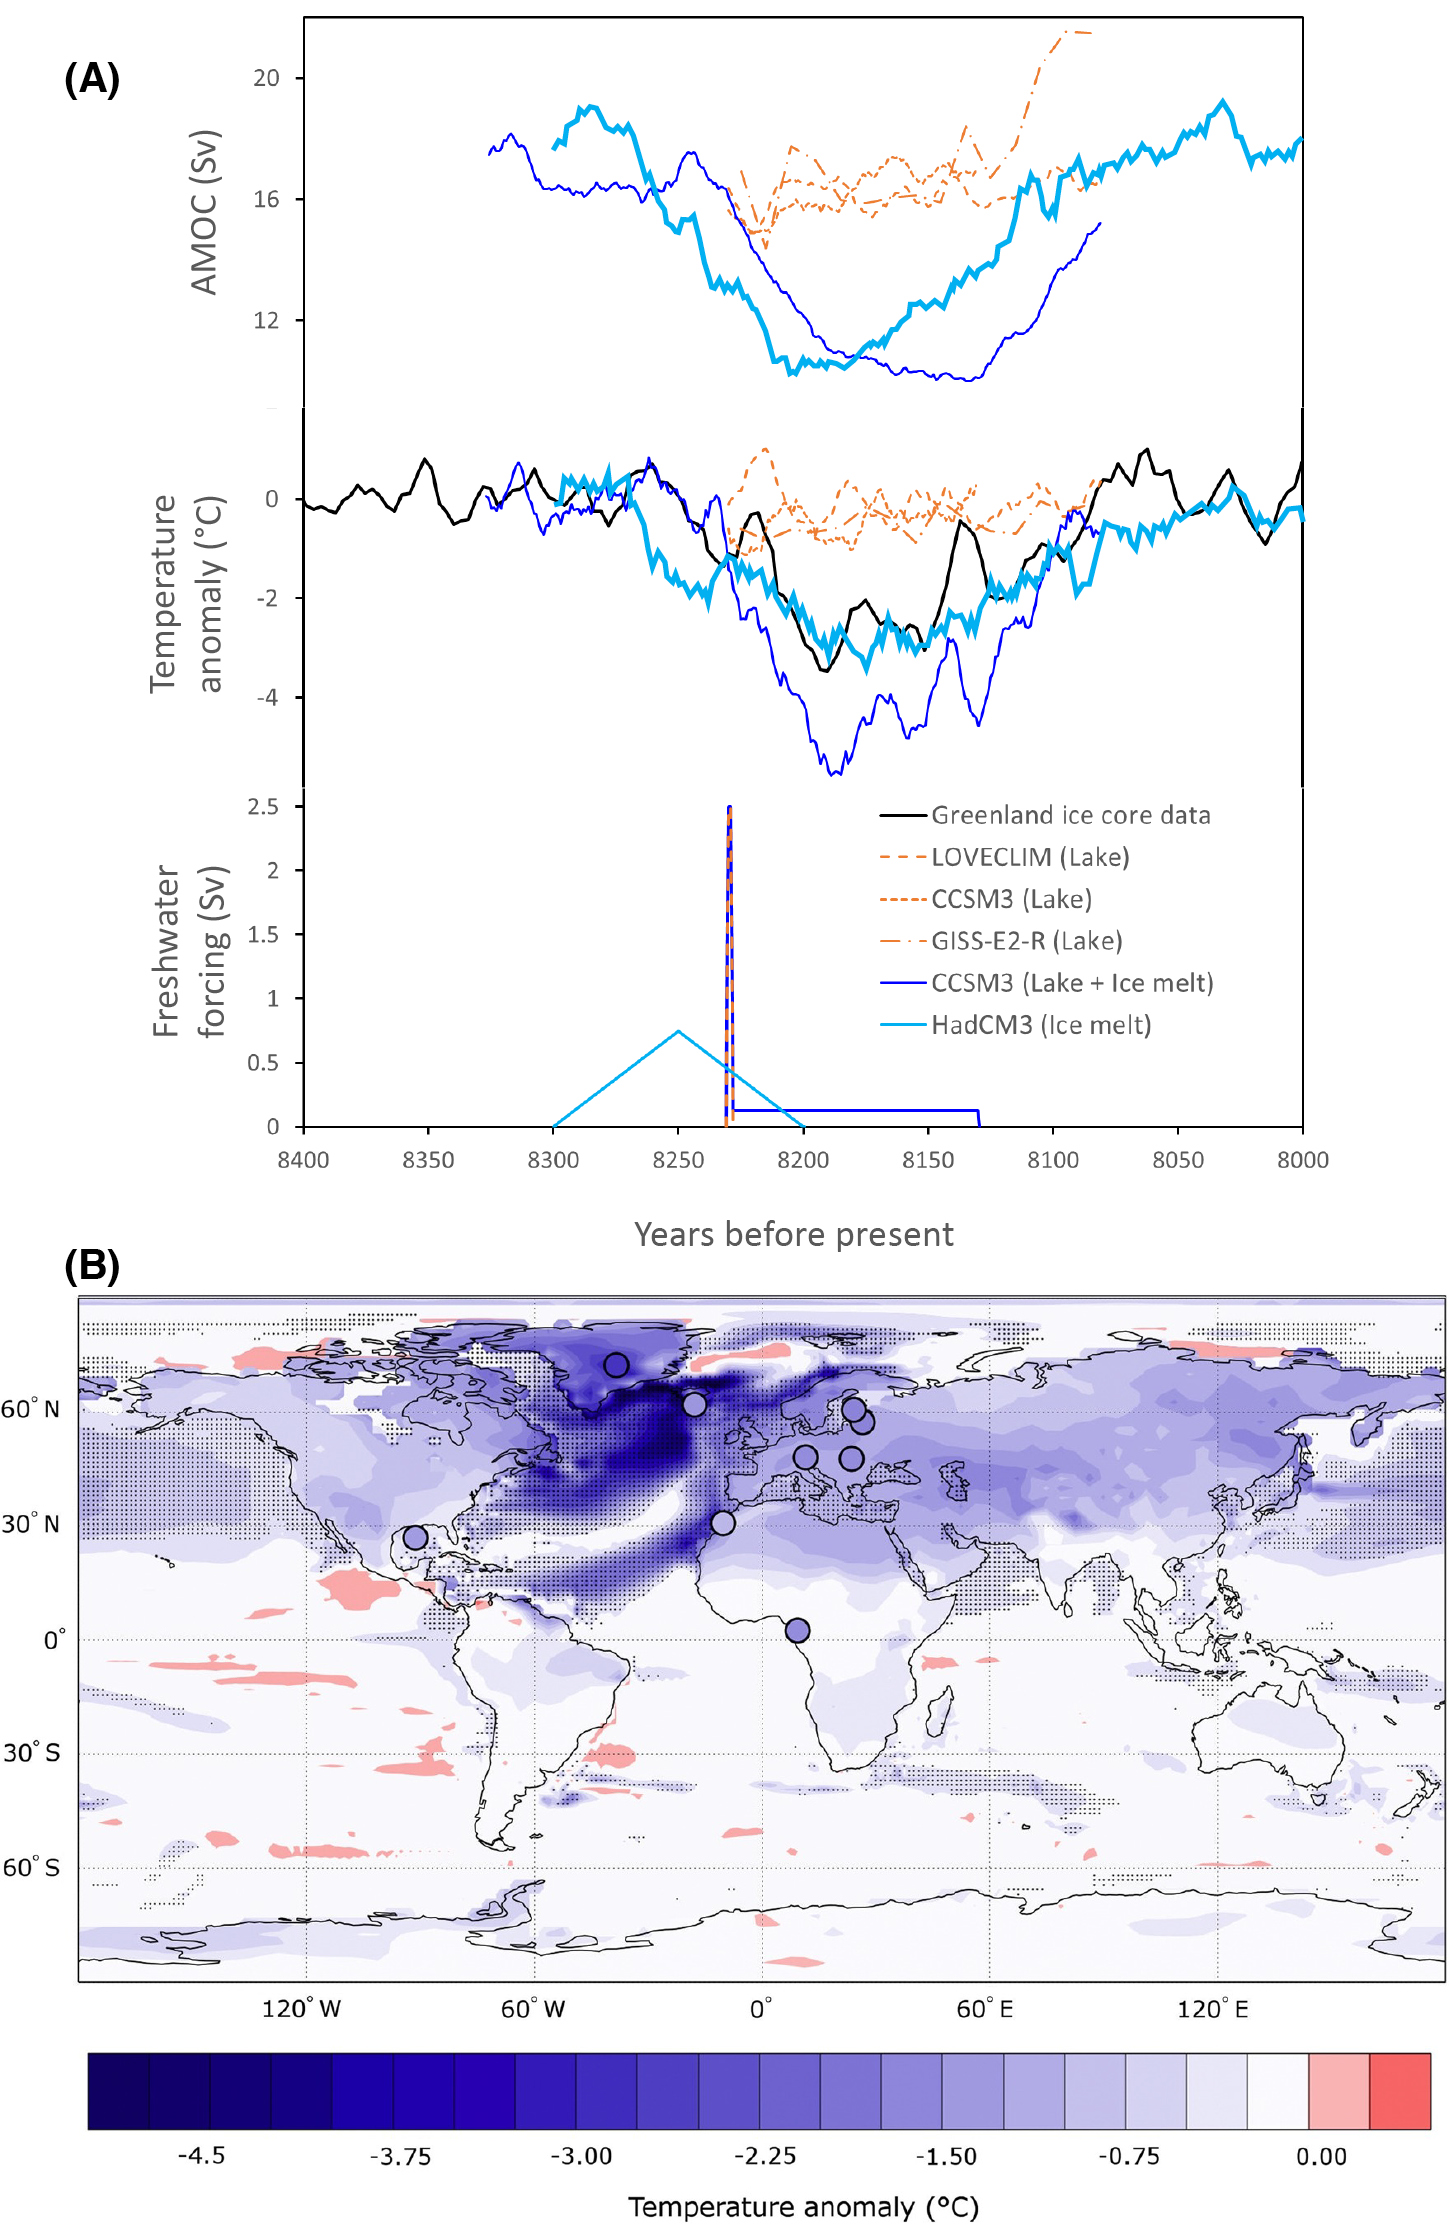
Figure 1: (A) Timeseries of (top) simulated Atlantic Meridional Overturning Circulation, (middle) simulated and observed Greenland temperature, and (bottom) prescribed meltwater forcing from five model experiments of the 8.2 kyr event. Three simulations (orange; Morrill et al. 2013b) that use meltwater fluxes corresponding to the drainage of Lake Agassiz-Ojibway cannot reproduce the duration or magnitude of the event (middle; black), while simulations (blue; Matero et al. 2017; Wagner et al. 2013) that include the much larger and longer ice-melt flux can. (B) The change in annual mean surface temperature caused by an ice-melt flux from the Hudson Bay saddle collapse matches the amplitude of changes in geological records shown in filled circles (reproduced from Matero et al. 2017). |
The forcing and mechanism that led to the cooling are now well understood. A release of meltwater into the Labrador Sea freshened sites of deep-water formation, thus slowing the Atlantic Meridional Overturning Circulation (AMOC) and reducing the northward transport of heat in the Atlantic (Barber et al. 1999). Evidence of Labrador Sea freshening and AMOC changes corroborate this story (e.g. Lochte et al. 2019). These changes also coincided with a sudden outburst of the lakes Agassiz and Ojibway (Barber et al. 1999), previously dammed by the remnants of the Laurentide Ice Sheet over North America that was then rapidly retreating (Fig. 2). The lake outburst was thus, for a long time, badged as the culprit for the 8.2 kyr event (Barber et al. 1999).
An ensemble of opportunity
Three climate-modeling groups within PMIP had simulated the event and decided to compare their results for the IPCC Fifth Assessment Report (Morrill et al. 2013b). This exercise was not conducted as a formal model intercomparison project (MIP) as coordinated by PMIP for the mid-Holocene, Last Glacial Maximum, or Pliocene, but was instead an "ensemble of opportunity". The simulations had minor differences in boundary conditions (orbital parameters, greenhouse gases, and ice sheets), but all included a lake outburst freshwater pulse of 2.5 Sv for one year added to the ocean near the Hudson Strait with slight differences in how the water was spread. This volume of freshwater was set to match estimates of lake volume. The models reproduced well the largescale pattern of temperature and precipitation changes deduced from a broad compilation of proxy records (Morrill et al. 2013b). However, the changes caused by the lake outburst were too small and much too short (red lines in Fig. 1), as the slowdown in ocean circulation could not be sustained after the meltwater pulse. Were the models not sensitive enough to this forcing, or was the experimental design inadequate in some way?
'Twas the wrong culprit
Fortunately, the story doesn't end there; it turns out a major factor was missing. The collapse of the Laurentide Ice Sheet that triggered the lake outburst was releasing huge amounts of water in the Labrador Sea and North Atlantic at the time of the event (Gregoire et al. 2012). Sea-level records had shown much larger sea-level rise than what could be explained from the lake outburst (Li et al. 2012), compelling modelers to release more freshwater in their models (Wiersma et al. 2006). It eventually became clear that the melt of the Laurentide Ice Sheet was actually more important than the lake outburst in causing the 8.2 kyr event (Wagner et al. 2013). But why was ice-sheet melt suddenly causing a slowdown of ocean circulation when the ice sheet had been steadily melting for thousands of years?
 |
|
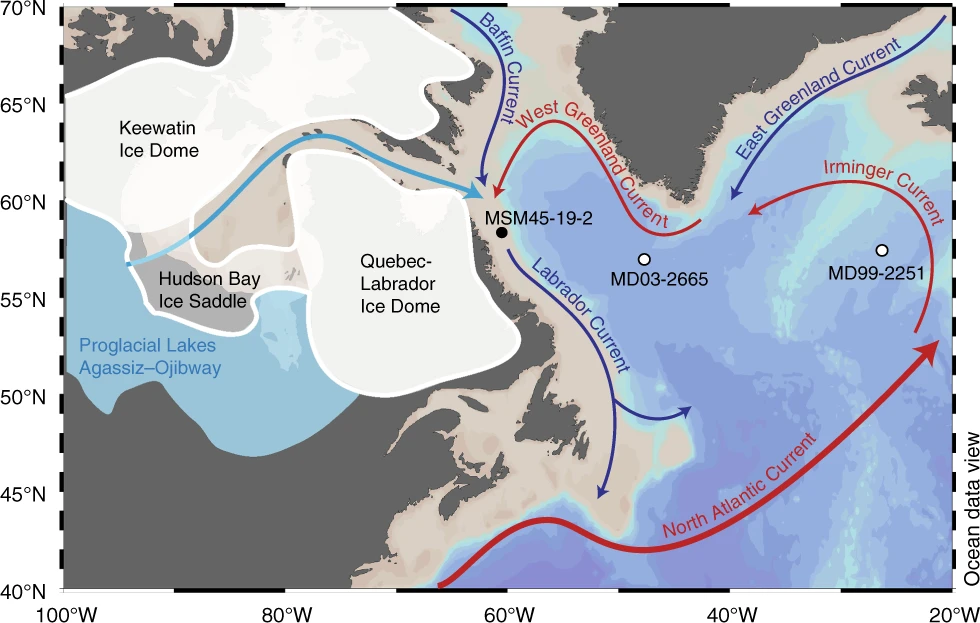
Figure 2: Map of the Laurentide ice sheet showing the Hudson Bay Ice Saddle that collapsed and the Lakes Agassiz-Ojibway that outburst around the time of the 8.2 kyr event. These caused an influx of freshwater into the Labrador Sea and slowed down the Atlantic Meridional Overturning Circulation causing the cooling shown in Figure 1 (reproduced from Lochte et al. 2019). |
The answer came from the discovery of a mechanism of ice-sheet instability, called the saddle collapse, which occurred on two significant occasions during the last deglaciation: one causing the Meltwater Pulse 1a sea-level rise 14.5 thousand years ago, and the other causing the 8.2 kyr event (Gregoire et al. 2012; Matero et al. 2017). The instability occurs during deglaciations when two domes of an ice sheet, connected via an ice saddle, separate to form distinct ice sheets. The saddle collapse is triggered when warming induces melt in the saddle region. As the saddle melts, it lowers, reaching increasingly warmer altitudes, thus accelerating the melt through the ice-elevation feedback, which produces a pulse of meltwater lasting multiple centuries (Gregoire et al. 2012). This is what happened to the ice sheet that was covering the Hudson Bay at the end of the last deglaciation (Gregoire et al. 2012), a process that was possibly enhanced by heat transported from a warm ocean current (Lochte et al. 2019) and instability of the marine parts of the ice sheet (Matero et al. 2020).
Ice collapse and lake outburst
It is not a coincidence that the Lake Agassiz-Ojibway outburst and the Hudson Bay ice-saddle collapse occurred around the same time. Around the peak of the saddle collapse melt, when the ice saddle became thin enough, the lake was able to initiate its discharge via channels under the ice due to the pressure of the lake that sat hundreds of meters above sea level. The ice-sheet melt would have contributed to filling up the lake, and the ice loss likely reduced the gravitational pull that the ice exerted on the ocean and the lake. Thus, estimating the relative timing, amplitude, and location of meltwater discharge from the ice sheet and lake into the ocean requires the combined modeling of the ice-sheet, hydrology, and sea-level processes.
Towards a benchmark for climate sensitivity to freshwater input
Given reasonable scenarios of meltwater discharge into the Labrador Sea from the Hudson Bay saddle collapse, Matero et al. (2017) were able to simulate the duration, magnitude, and pattern of the 8.2 kyr climate changes (Fig. 1, light blue curve), albeit with a larger volume of melt than sea-level records suggest. Our new understanding of the cause of the 8.2 kyr event thus advances the potential of this event to benchmark the sensitivity of climate models to freshwater forcing. Since the event was short and occurred under climate conditions similar to pre-industrial, it could become a feasible "out of sample" target for calibrating climate models. To reach this goal, we must continue to improve estimates for the magnitude, duration, and location of the meltwater forcing by combining sea-level, ocean-sediment, and geomorphological records with models of the ice sheet and lake.
We have good quantitative proxies for circum-North Atlantic temperature change during the event, but additional proxy records in the Southern Hemisphere are needed to determine the extent of the bipolar see-saw, a pattern of southern warming and northern cooling that often occurs when AMOC slows. We also lack good quantitative proxies for precipitation change during the event, which would provide invaluable information on the sensitivity of the water cycle to ice-sheet melt.
The design of MIPs and model–data intercomparison work within PMIP has become highly sophisticated in the last decade with detailed experimental setup for transient climate changes (e.g. DeGLAC; Ivanovic et al. 2016), which include realistic routing of meltwater flux to the ocean. Forward-modeling proxy data such as oxygen isotopes (Aguiar et al. 2021) or ocean neodymium could also greatly improve uncertainty quantification and benchmarking. With all these developments, the 8.2 kyr event may well fulfil its potential as the "Goldilocks" event that could truly test our ability to model the impacts of ice-sheet melting and the response of surface climate to ocean circulation changes.
*This refers to the fairy tale "Goldilocks and the Three Bears" in which a girl tastes three bowls of porridge (or soup depending on the version): one too hot, one too cold, and prefers the one that is just the right temperature.
affiliations
1School of Earth and Environment, University of Leeds, UK
2University of Colorado and NOAA's National Centers for Environmental Information, Boulder, CO, USA
contact
Lauren J. Gregoire: l.j.gregoire leeds.ac.uk
references
Aguiar W et al. (2021) Sci Rep 11: 5473
Barber DC et al. (1999) Nature 400: 344-348
Gregoire LJ et al. (2012) Nature 487: 219-222
Ivanovic RF et al. (2016) Geosci Model Dev 9: 2563-2587
Lawrence T et al. (2016) Quat Sci Rev 151: 292-308
Li Y-X et al. (2012) Earth Planet Sci Lett 315-316: 41-5
Lochte AA et al. (2019) Nat Commun 10: 586
Matero ISO et al. (2017) Earth Planet Sci Lett 473: 205-214
Matero ISO et al. (2020) Geosci Model Dev 13: 4555-4577
Morrill C et al. (2013a) Clim Past 9: 423-432
Morrill C et al. (2013b) Clim Past 9: 955-968
Schmidt GA et al. (2005) Quat Sci Rev 24: 1109-1110