PAGES Magazine articles
Richard Seager1 and Robert J. Burgman2
1Lamont Doherty Earth Observatory, Columbia University, Palisades, USA; seager ldeo.columbia.edu
2Rosenstiel School of Marine and Atmospheric Sciences, University of Miami, USA
Can the global pattern of Medieval hydroclimate be explained by a persistent La Niña-like state and a persistent positive North Atlantic Oscillation (NAO) and, if so, why did this happen?
North American megadroughts
 |
|
Figure 1: Global hydroclimate information from model simulations and proxy data. Brown and green dots indicate proxy records that show the 1320-1462 AD period to be drier or wetter than the subsequent Little Ice Age and modern periods. NADA (North American Drought Atlas, Cook et al., 2007) refers to dry conditions over North America. The colors over land show the soil moisture difference (soil water volume per soil volume) between the ensemble means of simulations forced by coral-reconstructed tropical Pacific SSTs for 1320-1462 AD and a simulation forced by modern observed SSTs. Contours over the ocean are the specified SST in the tropical Pacific and calculated (with an ocean mixed layer model) SSTs elsewhere. Blue and red dots over the ocean indicate proxy evidence of relatively cold and warm SSTs for this period. See Seager et al. (2008a) and Burgman et al. (2010) and supplementary material for more details including plots of the proxy data. |
The hydroclimate of the Medieval period (here loosely defined as the period from about the 9th century to the end of the 15th century) features some dramatic anomalies with respect to the modern climate. Perhaps the most remarkable are the series of multidecadal “megadroughts” that struck vast areas of Southwest North America which combined to create a generally more arid climate in the region that lasted centuries. These are well documented from tree-ring records (Herweijer et al., 2007; Cook et al., 2007, 2010). In addition, there is evidence for a strong Asian monsoon during the Medieval period, wet conditions over much of tropical South America, dry conditions in equatorial East Africa, wet in South Africa, a dry western Mediterranean region and wet northwest Europe (see compilation of proxy data in Seager et al., 2007, Burgman et al., 2010 and Figure 1). What could have caused such a global reorganization of hydroclimate for such a long period of time? The North American megadroughts immediately suggest a link to tropical ocean sea surface temperatures (SSTs). Climate modeling has clarified that the historical droughts of the 19th and 20th centuries were forced by small variations in tropical SSTs. All were forced, wholly or in part, by a cold, La Niña-like tropical Pacific Ocean. In addition, a warm subtropical North Atlantic Ocean played a role in forcing the 1930s and 1950s droughts. The tree-ring data clarified that the spatial patterns of the modern and Medieval droughts were essentially the same extending from Mexico up to Oregon and from the Pacific coast into the Great Plains and sometimes as far as the Atlantic coast of the eastern USA. Persistent, multi-year La Niñas force modern droughts. Likewise, past shifts of the tropical Pacific to a more La Niña-like state for multiple decades at a time could, conceivably, have forced changes in atmospheric circulation that created the megadroughts.
Modeling of tropical Pacific Ocean forcing of North American megadroughts
Marine proxy data are quite sparse for the Medieval period. However Cobb et al. (2003, and updates at the Lisbon symposium, September 2010; http://mwplisbon2010.fc.ul.pt/) used coral oxygen isotope data from Palmyra in the central equatorial Pacific Ocean and showed that SSTs were quite likely reduced throughout most of the Medieval period they were able to sample. However more work is needed to be certain since the coral oxygen isotopic composition could also be influenced by changes in salinity. Graham et al. (2007) examined other marine proxies from the Pacific and showed that they were consistent with a Medieval La Niña-like state. The Cobb et al. (2003) record has been used to create tropical Pacific SST fields for 1320-1462 AD that were imposed as forcing for an ensemble of 16 atmosphere GCM simulations (Seager et al., 2008a). The coral-reconstructed tropical Pacific SSTs were sufficiently cool and persistent to create multidecadal megadroughts over North America that had comparable spatial pattern and amplitude to the tree-ring reconstructed megadroughts during this 1320-1462 AD period. However, the model did not track the year-to-year evolution of the reconstructed North American hydroclimate very well.
Possible tropical Atlantic Ocean role on North American Medieval hydroclimate
In the last few years, climate modeling has shown that North American drought is also influenced by tropical North Atlantic SST variations, either via an indirect influence that involves the Pacific in winter or directly by forced stationary Rossby waves in summer (Kushnir et al., 2010; Seager et al., 2008b). Hence part of the model vs. tree-ring reconstruction discrepancy for 1320-1462 AD could be attributed to the neglect of the influence of Atlantic SST variations. Indeed Feng et al. (2008) have argued that the North Atlantic was warm during the Medieval period (in a pattern resembling the Atlantic Multidecadal Oscillation) and that this, in combination with the cold tropical Pacific, forced the North American megadroughts (see Oglesby et al., this issue). It is highly likely that the decade-to-decade and century-to-century evolution of North American hydroclimate during the Medieval period (including the succession of megadroughts interrupted briefly by wetter periods more akin to the current climate) was forced by the evolution of tropical Pacific and Atlantic SSTs acting in concert at some time and in opposition at other times. The extent to which the Pacific and the Atlantic Oceans themselves interacted is not known but it has been speculated that the two oceans can vary in a coordinated manner with possibilities for each to force and respond to the other.
Explaining the global pattern of Medieval hydroclimate: La Niña and a positive NAO
Turning to Medieval hydroclimate beyond North America, Herweijer et al. (2007), Seager et al. (2007) and Burgman et al. (2010) found around 30 proxy records from various types of archive (tree rings, speleothems, sediment cores, etc.) that showed evidence of a well defined Medieval hydroclimate anomaly (extending into the 14th and 15th centuries) relative to the subsequent Little Ice Age and modern periods. These were simply characterized as wet or dry following the interpretation of the original authors. These were then plotted together with the 1320-1462 AD time-averaged soil moisture anomalies from the ensemble mean of the model simulations forced with the tropical Pacific coral-reconstructed SST. Figure 1 presents an update of that figure.
There is general agreement on the dry conditions in the extratropical Americas and wet in the tropical Americas, typical of a La Niña-state. The model also agrees with proxy evidence for dry conditions in equatorial East Africa and wet conditions in southern Africa. There is some indication of a stronger monsoon. The model also produces a dry Mediterranean region in agreement with some proxies. However, the model does not capture the wet conditions that proxy data indicate for northwest Europe. Data presented at the Lisbon symposium supported the dry western Mediterranean-wet northwest Europe dipole. This would not be expected from La Niña-forcing and is more likely to have been caused by a persistently positive North Atlantic Oscillation (NAO; Trouet et al., 2009). With the exception of Europe and perhaps North Africa, much of the global pattern of Medieval hydroclimate can be explained as a response to a Medieval La Niña-like state.
What caused Medieval La Niña and positive NAO states?
Why might a persistent Medieval La Niña and positive NAO have occurred? One argument is that relatively high solar irradiance and weak volcanism could have forced the tropical Pacific into a more La Niña-like state (Emile-Geay et al., 2007) with a positive NAO then being forced as a teleconnected response. Other arguments have been made that high irradiance could directly force a positive NAO (e.g., Rind et al., 2008). Recently Marchitto et al. (2010) have presented sedimentary evidence from the Soledad Basin off Baja California that La Niña-like states have coincided with increased solar irradiance throughout the Holocene, with the Medieval period being the most recent of these events. Should Medieval hydroclimate be externally forced, it would raise two important issues. The presumed amplitude of the external forcing is very small and the Medieval response would indicate a surprisingly high regional climate sensitivity. That regional climate sensitivity comes from a strong projection of forcing onto the patterns of the ENSO and NAO modes of climate variability. On the other hand, it is possible that these atmosphere-ocean states could arise from internal variability of the climate system on timescales longer than generally considered possible and potentially including as yet unknown interbasin couplings that act to persist certain preferred states. Either way, global Medieval hydroclimate is a fascinating and important challenge to our understanding of climate variability and change.
references
For full references and additional online material please consult: http://pastglobalchanges.org/products/newsletters/ref2011_1.html
Hugues Goosse1, J. Guiot2, M.E. Mann3, S. Dubinkina1 and Y. Sallaz-Damaz1
1Georges Lemaître Centre for Earth and Climate Research, Earth and Life Institute, Catholic University of Louvain, Belgium; hugues.goosseuclouvain.be
2CEREGE, Aix-Marseille Universities / CNRS, Europole Mediterraneen de l'Arbois, Aix-en-Provence, France
3Department of Meteorology and Earth and Environmental Systems Institute, Pennsylvania State University, University Park, USA
Data assimilation improves our understanding of the origins of climate changes during the past millennium in Europe.
Model data-comparison in the presence of large internal variability
The analyses of past climate changes are based on two main sources of information. First, proxy records provide qualitative and quantitative estimates of the changes. Second, the knowledge of the physical processes governing climate allows us to propose interpretations of the observed signals and possible explanations of their origin. This understanding of the system is generally formalized in models, ranging from conceptual models to sophisticated general circulation models. A successful study needs to stand on those two pillars and thus requires an efficient way to compare model results with proxy records.
However, such a comparison is not straightforward, in particular for the past millennium for several reasons. First, as for any paleoclimate study whatever the time-scale is, proxy records covering the last millennium and model outputs do not represent the same quantity. Proxies include non-climatic signals and are generally influenced by local climate, while models simulate physical, and sometimes biogeochemical quantities averaged over thousands of square kilometers. Forward proxy models (where the variable recorded in the archive is directly estimated from the model output instead of using a calibration of the proxy in terms of simple physical variables like annual mean temperature) and regionalization techniques will certainly contribute to reduce the uncertainties associated with those issues in the near future (Hughes et al., 2010).
A second problem for the last millennium is the large role of the internal variability of the system during this period, in particular at continental and regional scales (Goosse et al., 2005). If a signal recorded in proxies is related to a known forcing such as a change in the insolation in summer or a decrease in greenhouse gas concentration, then a model that includes the adequate physics and is driven by this forcing should ideally reproduce the observed signal at the right time. However, even a perfect model cannot simulate at the right moment an event that has its origin internally in the non-linear dynamics of the climate system. Instead, a similar event may occur in the simulations earlier or later in time but never with identical temporal and spatial structure. Therefore, any difference between model results and observations can be due to model deficiencies but also simply due to a different realization of internal variability. This strongly reduces the constraints that model-data comparison could put on the realism of models. Furthermore, using a model to interpret an observed signal is nearly impossible if the model does not simulate the main characteristics of this signal at the right time.
Combining model results and proxy data through data assimilation
Data assimilation provides a way to partly bypass this latter problem. The goal of this technique is to optimally combine data with model results in order to obtain a state of the system that is compatible with both, taking into account the uncertainties on all the elements (for a recent review of applications of data assimilation devoted to the last millennium, see Widmann et al., 2010). As the obtained model state reproduces the observed signal, it is then possible to describe the origin of this signal by analyzing all the model variables.
However, data assimilation should be used in conjunction with simulations without data assimilation. In simulations with data assimilation, it is not possible to determine if a simulated event is related to a particular forcing or just to the internal variability of the system. By contrast, the average of an ensemble of simulations without data assimilation can be used to estimate the response of the system to the forcing. It is then tempting to consider that the differences between the simulations with and without data assimilation are related to the internal variability of the system. Nevertheless, this step should be made with caution since it assumes that the contributions of forced and internal variability linearly add to each other without any interactions between them and that the forced response estimated from models is perfect. This is of course only a first order approximation and data assimilation also compensates for uncertainties in the estimates of forcing reconstructions, as well as for errors in the model response to this forcing to an extent that is usually difficult to estimate.
The data assimilation technique that has been selected in our studies is a particle filter (Sequential Monte Carlo method, e.g., van Leeuwen, 2009) because it is relatively intuitive to use and because it is well adapted to strongly non-linear systems. Starting from an ensemble of initial conditions (96 in our case) obtained for instance from simulations without data assimilation, simulations are performed for one year using the climate model LOVECLIM (Goosse et al., 2010). The likelihood of each model state is then estimated from a comparison with proxy-based reconstructions. The simulations that show the largest disagreement with the proxies are stopped while the ones that are in better agreement are maintained. In order to keep the same number of particles (i.e., of members in the ensemble of simulations), the simulations that display the highest likelihood are duplicated, the number of copies being proportional to the likelihood, and then a small perturbation to the model state is added. The procedure is then prolonged for an additional year until the end of the period of interest. This technique guides the model results to follow the signal recorded in proxies. One of the limitations of the particle filter is that it requires a large number of members to reproduce the development of the system. Consequently, it is generally necessary to focus on a particular region or, when interested in a larger scale, to apply a spatial filter to remove high frequency spatial variations and to reduce the number of degrees of freedom of the system.
Application to the study of the MCA in Europe
 |
|
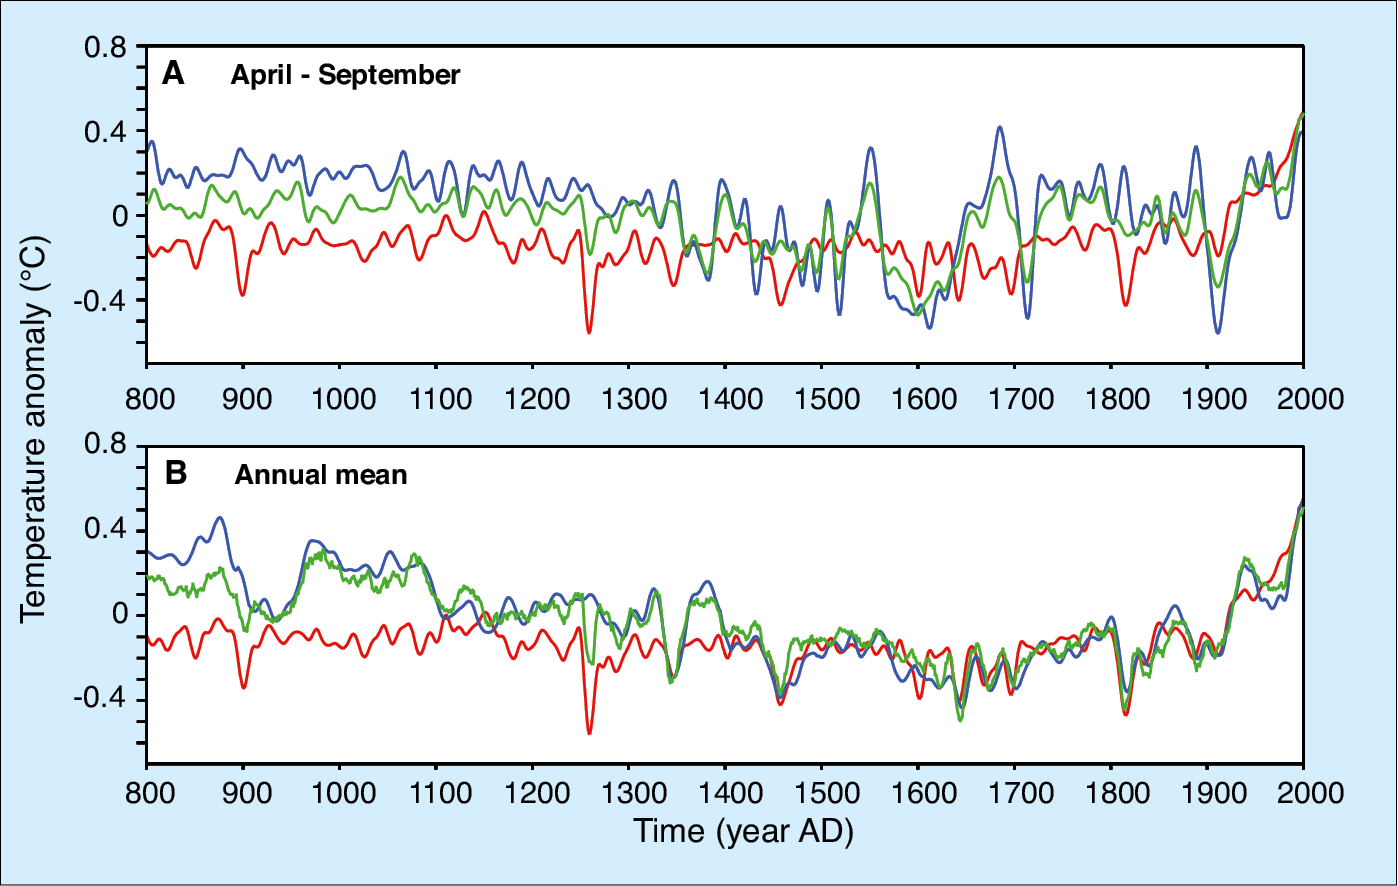
Figure 1: A) Anomaly of growing season temperature (April to September) averaged over Europe (25°-65°N, 0-70°E) in the reconstruction of Guiot et al. (2010, blue), in simulations with the climate model LOVECLIM without data assimilation (red), and in simulations with LOVECLIM with data assimilation constrained by the Guiot et al. (2010) reconstruction (green). The reference period is 1900-1995. The time series has been filtered using an 11-year running mean. B) Same as (A) for annual mean except that the reconstruction is now the one of Mann et al. (2009) (blue) and the simulation with data assimilation is driven by this reconstruction (green).
|
Using this technique, it is possible to directly constrain the model to follow the relatively large number of proxy records available for the past millennium (e.g., Jones et al., 2009), eventually using forward proxy models and regionalization techniques. However, as a first step, we found it easier to use spatial reconstructions either of annual mean temperature over a large part of the world (Mann et al., 2009) or of summer temperature over Europe (Guiot et al., 2010) since they provide fields that are easy to compare with model results (Fig. 1).
In summer and winter, both reconstructions and simulations with data assimilation show a clear warm period in Europe between 900 and 1050 AD during the Medieval Climate Anomaly (MCA). This contrasts with the ensemble mean of the simulations without data assimilation (i.e., the forced response of the model), which shows only a small decrease between the early part of the millennium and the 16th-18th century (often referred to as the Little Ice Age). This weak forced response has also been found in other models driven by similar forcing as the one used here (Jungclaus et al., 2010). The analyses of the origin of the larger warming in the simulation with data assimilation shows that, in the simulation constrained by the Mann et al. (2009) reconstruction, the atmospheric circulation displays stronger westerly winds bringing warm air to northern Europe during the MCA, mainly in winter. In the simulation driven by the Guiot et al. (2010) reconstruction, westerlies are weaker in summer and a northward flow transports air from Africa to the central Mediterranean Sea and southern Europe during the MCA, contributing to the simulated warming.
references
For full references please consult: http://pastglobalchanges.org/products/newsletters/ref2011_1.html
Ulf Büntgen1,2 and Willy Tegel3
1Swiss Federal Research Institute WSL, Birmensdorf, Switzerland; buentgenwsl.ch
2Oeschger Centre for Climate Change Research, Bern, Switzerland
3Institute for Forest Growth IWW, University of Freiburg, Germany
European tree-ring chronologies reveal that temperatures during the Medieval Climate Anomaly (MCA) were likely as warm as during the 20th century, that earlier hydroclimatic changes have at times exceeded recent variations, and that evidence for a clear spatiotemporal pattern of the MCA remains puzzling.
Europe possesses a dense network of long instrumental station measurements, and with Scandinavia and the Alps, harbors at least two of the world’s hotspots of dendroclimatic research that provide an exceptional pool of archeological wood material. Annually resolved millennium-long tree-ring chronologies that enhance our understanding of the Medieval Climate Anomaly (MCA, ca. 900-1400 AD), exist for different parts of Europe and northern Africa. Individual records that combine an adequate number of recent and historical samples can reflect high- to low-frequency variations in either warm season temperature or precipitation.
Reconstructions
Millennium-long tree ring-based temperature reconstructions exist in northern Scandinavia (e.g., Briffa et al., 1992; Grudd et al., 2002; Grudd, 2008; Gouirand et al., 2008; Helama et al., 2009b) and the Alpine arc (e.g., Büntgen et al., 2005, 2006, 2009; Corona et al., 2010; Nicolussi et al., 2009). The Scandinavian composite records are based on living conifers, which grew during the past few centuries, and utilize dry-dead and sub-fossil material further back in time (see Linderholm et al., 2010 for a review). The Alpine temperature reconstructions are mainly based on high-elevation living conifers and historical construction timber. Slightly shorter temperature reconstructions that reach back into the 12th and 13th centuries are available from the Romanian Carpathians (Popa and Kern, 2009) and the Spanish Pyrenees (Büntgen et al., 2008). Both records show distinct summer temperature variations that are comparable to those obtained from the Alps. Dendrochronological studies in southern France (Serre, 1978), Albania (Seim et al., 2010) and Bulgaria (Panayotov et al., 2010) also revealed millennium-long ring width chronologies, but they only contain a mixed and overall lower climate signal (e.g., Büntgen et al., 2010a).
 |
|
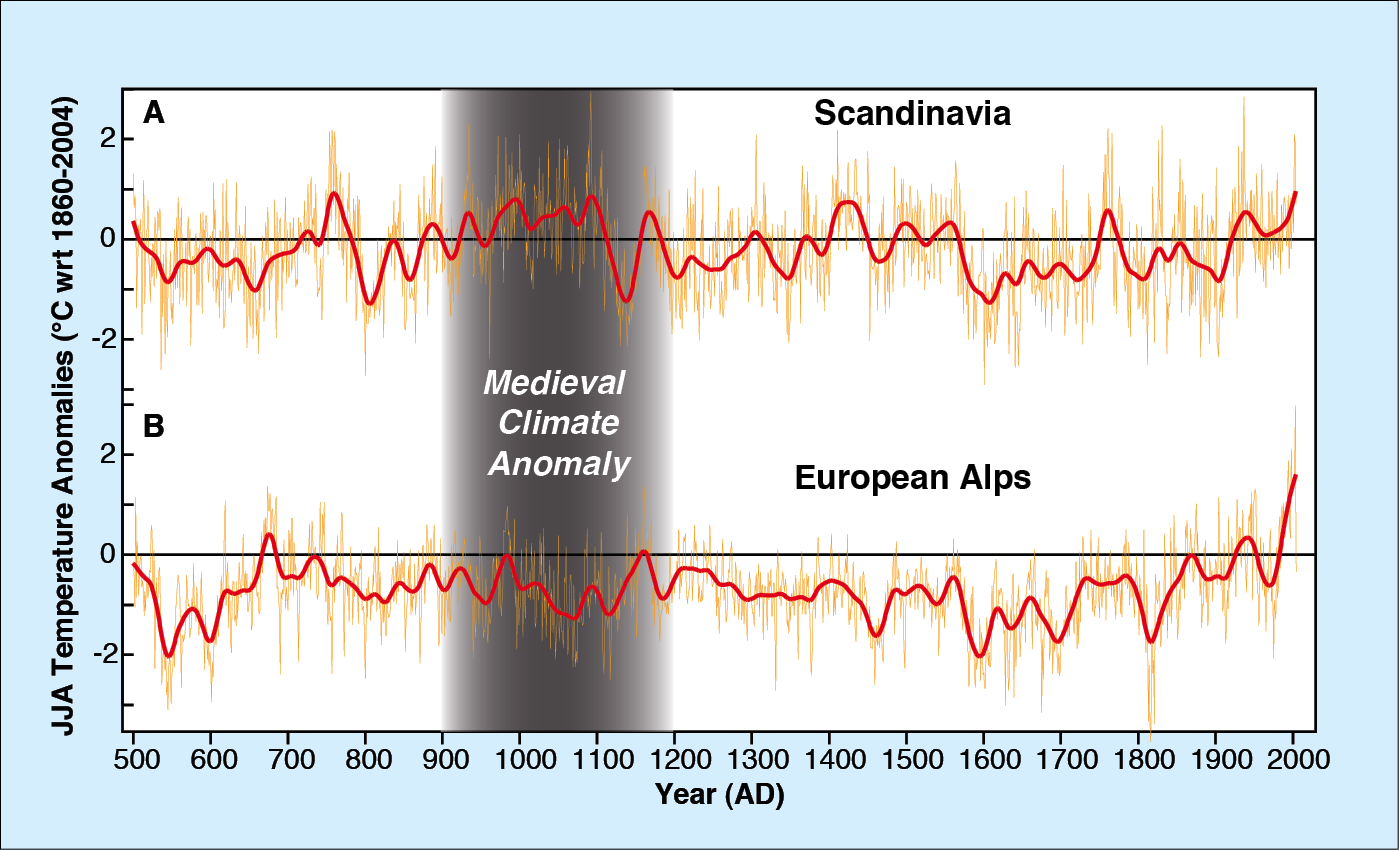
Figure 1: Annually resolved and 40-year low-pass filtered temperature reconstructions averaged over (A) Scandinavia and (B) the Alps. Five tree ring-based warm season temperature reconstructions from Scandinavia (Briffa et al., 1992; Gouirand et al., 2008; Grudd et al., 2002; Grudd, 2008; Helama et al., 2009b) were re-scaled against June-August (JJA) temperatures (1860-2004 AD), averaged and smoothed. Their individual start and end dates range from 500-802 and from 1970-2004, respectively. Four tree ring-based warm season temperature reconstructions from the Alps (Büntgen et al., 2006, 2009, 2011; Corona et al., 2010) were re-scaled against JJA temperatures (1860-2004 AD), averaged and smoothed. Their individual start and end dates range from 500-1000 and from 2000-2004, respectively. Note that the initial reconstructions are not independent in terms of the data used and methods applied. |
Northern and central European sites may reflect different patterns of temperature change (Büntgen et al., 2010b). Scandinavian summer temperatures were roughly below the 1860-2004 AD average from ca. 800-900, 1100-1400, 1570-1750, and from 1780-1920 AD (Fig. 1a). Summer warmth centered on the 760s, between ca. 980 and 1100 AD, and again in the 1410-1420s was comparable to, or even higher than, conditions during the 1930s and after ca. 1980. The timing of Scandinavian medieval warmth may have coincided with the establishment of Norse colonies in the cold and harsh environments of Iceland and Greenland (Patterson et al., 2010). In contrast, Alpine summer temperature depressions were estimated during the Little Ice Age (LIA) from the mid 15th century to ca. 1820 AD and coinciding with the Oort Solar Minima ca. 1050-1120 AD. Alpine summer temperatures during the late 20th century were unprecedented over the past 1500 years (Fig. 1b). Earlier warm periods occurred in the 990s and between ca. 1150-1250 AD and may have coincided with a rapid demographic and economic, as well as cultural and political rise of medieval Europe (McCormick, 2001).
 |
|
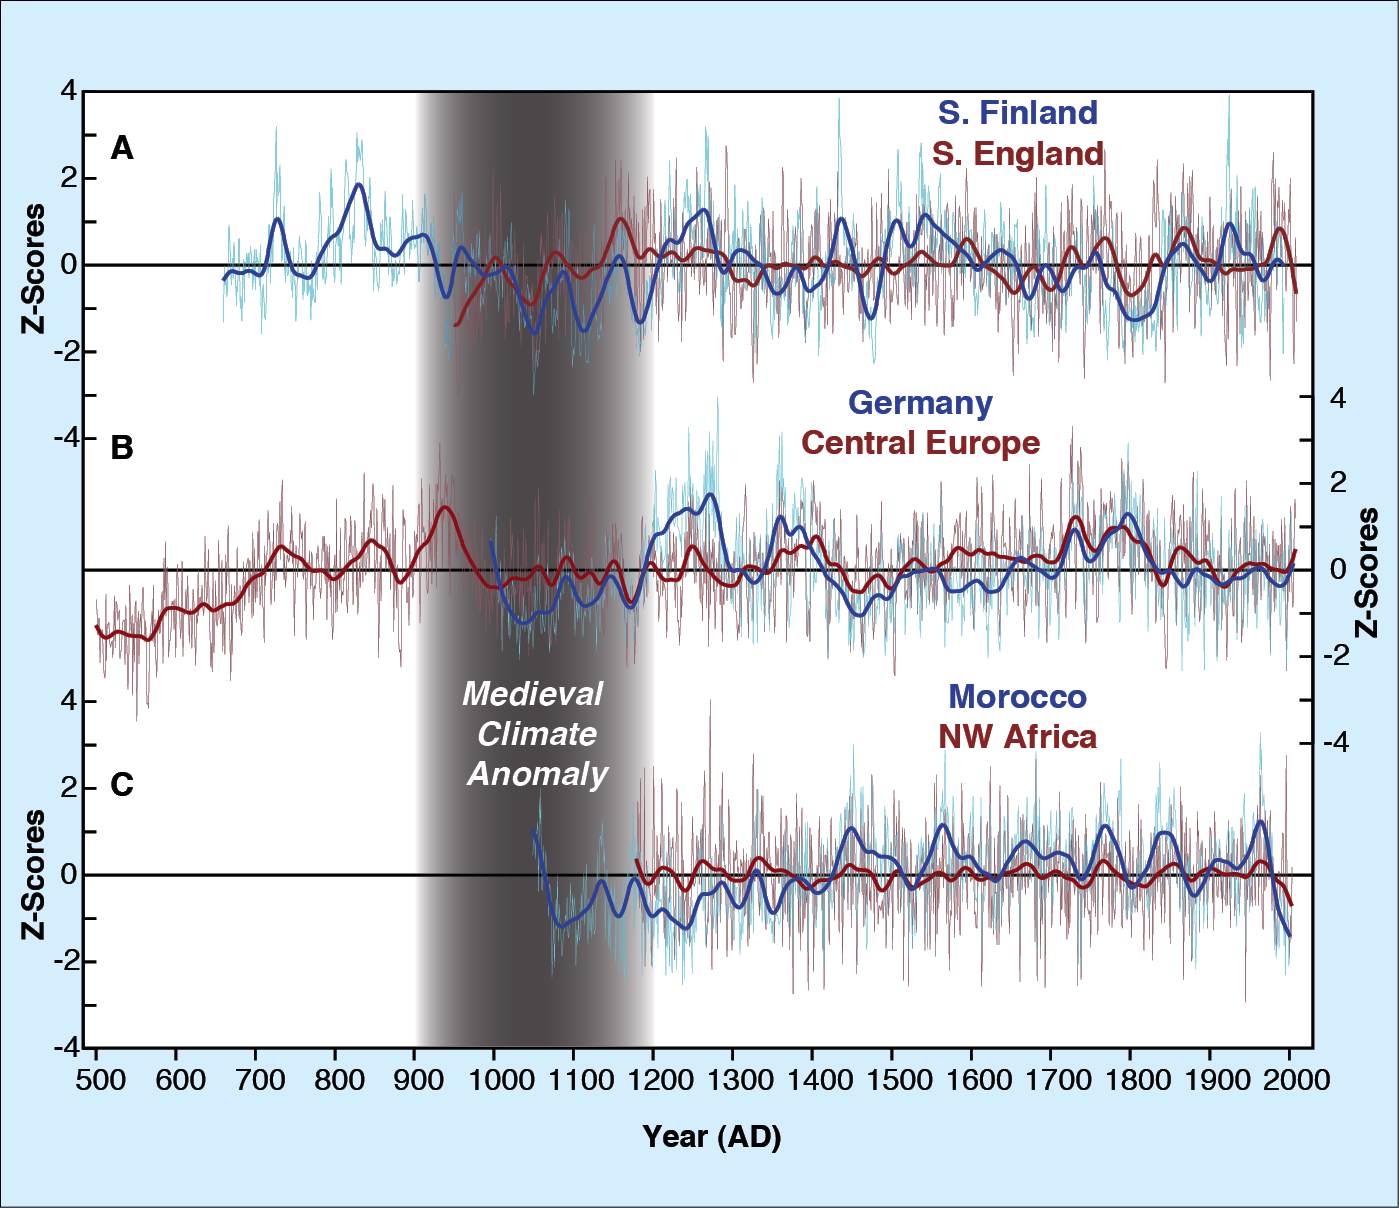
Figure 2: Annually resolved and 40-year low-pass filtered regional-scale hydroclimatic reconstructions from (A) southern Finland (blue; Helama et al., 2009a) and south-central England (red; Wilson et al., unpublished data), (B) central Germany (blue; Büntgen et al., 2010) and central Europe (red; Büntgen et al., 2011), and (C) Morocco (blue; Esper et al., 2007) and northwest Africa (red; Touchan et al., 2010). Data were normalized over their individual length. |
While a few evenly distributed and highly replicated composite tree-ring chronologies (of distinct temperature sensitivity) are sufficient to capture the spatial character of European summer temperature variability (Büntgen et al., 2010b), many more records are necessary to provide a comparable meaningful picture of the continent’s hydroclimatic variability. It should also be noted that most of the local-to-regional-scale hydroclimatic records best reflect drought conditions, such as soil moisture availability (Büntgen et al., 2010b), whose sensitivity is generally restricted to the early vegetation period of intense cell formation. Millennium-long ring width-based reconstructions from southern Finland (Helama et al., 2009a), south-central England (Wilson et al., unpublished data), central Europe (Büntgen et al., 2011), and the southern Mediterranean Maghreb (Esper et al., 2007; Touchan et al., 2010) preserve high- to low-frequency precipitation/drought variability (Fig. 2). Data also contain a pronounced level of synoptic-scale coherency amongst the same latitudinal belts. The two northernmost records agree well and show a drier MCA, a wetter LIA and average 20th century conditions compared to the individual record length (Fig. 2a). The central European records illustrate a similar picture with slightly higher amplitude between a drier MCA and a wetter LIA (Fig. 2b). The two records from the southern Mediterranean show decadal-scale hydroclimatic variations (Fig. 2c), but convincing indication for a longer-term contrast between an overall dry MCA, a wet LIA and an abrupt recent drought is largely derived from the study by Esper et al. (2007). It must be noted that the reconstructed northwest African drought fluctuations are based on a compilation of 39 site chronologies (Touchan et al., 2010), which are somewhat restricted in potentially preserving lower frequency information, and therefore partly deviate from the low-frequency signal displayed by Esper et al. (2007).
Evidence for a generally drier climate from ca. 1000-1200 AD is expressed in all compilations. Overall, wetter summers are found during the 13th and 14th centuries, in parallel to the global onset of the LIA, and may have added to the widespread famine in northern/central Europe in that period (e.g., Kershaw, 1973). Additionally, they may have also played a contributing role in the second plague pandemic, the Black Death (Büntgen et al., 2010c, 2011; Kausrud et al., 2010). Furthermore, the 14th century is associated with the abrupt abandonment of Greenland settlements (Patterson et al., 2010). Caution is however advised, as socio-cultural and epidemiological stressors must be carefully considered when linking climate variability to human history (de Menocal, 2001; O'Sullivan, 2008).
Perspective
The above paleoclimatic evidence emphasizes the need to better understand the timing and amplitude of the European MCA, as well as the associated spatial characteristic. Placing the MCA in a longer-term context and increasing the number of high-resolution proxy records will thus gain in importance. In this regard, it appears interesting that several multi-millennial-long chronologies of annually resolved ring width measurements have been developed for different parts of Europe. These compilations represent a unique dating tool, not only for archeological artefacts and historical construction wood, but also for antique artwork, instruments and furniture (see Haneca et al., 2009 for a review). Continuous chronologies of the past millennium are available for most countries of central and northern Europe. Oak composites of 2000 years exist for different sub-regions in England, Ireland, Denmark, Germany, Poland and France. Additional deciduous species including beech, ash and alder, as well as conifers (i.e., fir, spruce and pine) yield millennium-long chronologies for Germany, Austria, Switzerland, France and the Czech Republic. Their sample size comprises hundreds and thousands of series in Roman, Medieval, and Modern times, but dramatically drops during the so-called transition periods of increasing and continuing political turmoil. The paleoclimatic value of such compilations was recently demonstrated by introducing a random sampling strategy to update archeological chronologies into the 21st century while avoiding statistical over-fitting during the calibration (Tegel et al., 2010).
The annual-precise felling dates of historical wood can provide additional insight into socio-economic dynamics of past civilizations when carefully analyzing the dendrochronological records and utilizing dates of timber harvest as a surrogate for construction activity.
acknowledgements
We are thankful to R. Wilson who kindly made available his unpublished work, to R. Touchan for critical comments, discussion and providing his results, as well as to all other colleagues who made available their published data. Supported by the SNSF (NCCR-Climate), the INRAP, the DFG (SP 437/16-1), and the EU project Millennium (017008).
references
For full references please consult: http://pastglobalchanges.org/products/newsletters/ref2011_1.html
Ana Moreno1, M. Morellón2, C. Martín-Puertas3, J. Frigola4, M. Canals4, I. Cacho4, J.P. Corella1, A. Pérez1, Á. Belmonte5, T. Vegas-Vilarrúbia6, P. González-Sampériz1 and B.L. Valero-Garcés1
1Pyrenean Institute of Ecology (CSIC), Zaragoza, Spain; amorenoipe.csic.es
2Department of Surface Waters – Eawag, Dübendorf, Switzerland
3German Research Center for Geoscience (GFZ), Potsdam, Germany
4CRG Marine Geosciences, University of Barcelona, Spain
5Department of Earth Sciences, University of Zaragoza, Spain
6Departament of Ecology, University of Barcelona, Spain
Climate variability reconstructions for the last millennium from several Iberian lake and marine records shed light on the spatial and temporal hydroclimate and associated climate mechanisms during the Medieval Climate Anomaly.
In order to understand the causes and spatial extent of the Medieval Climate Anomaly (MCA; ca. 900-1350 AD) and the Little Ice Age (LIA; ca. 1350-1850 AD), a better characterization of temperature and precipitation changes in a larger number of sites around the globe is required. Understanding the dynamics of MCA in the climatically-vulnerable Mediterranean region is particularly interesting since it encompasses a comparison between the hydrological response to a generally accepted warm period (the MCA) and to the present global warming. To tackle the question of how the MCA and the present global warming compare, the most pertinent approach is to study highly resolved records that are mostly driven by moisture changes. Sediments from small lakes that experience considerable fluctuations in terms of lake level and chemistry and biological proxies record such information on effective moisture variability. Coastal and marine sediments also provide evidence of changes in sea surface temperature (SST), river sediment delivery, and wind patterns related to climate.
The Iberian MCA signal: Marine and terrestrial records
 |
|
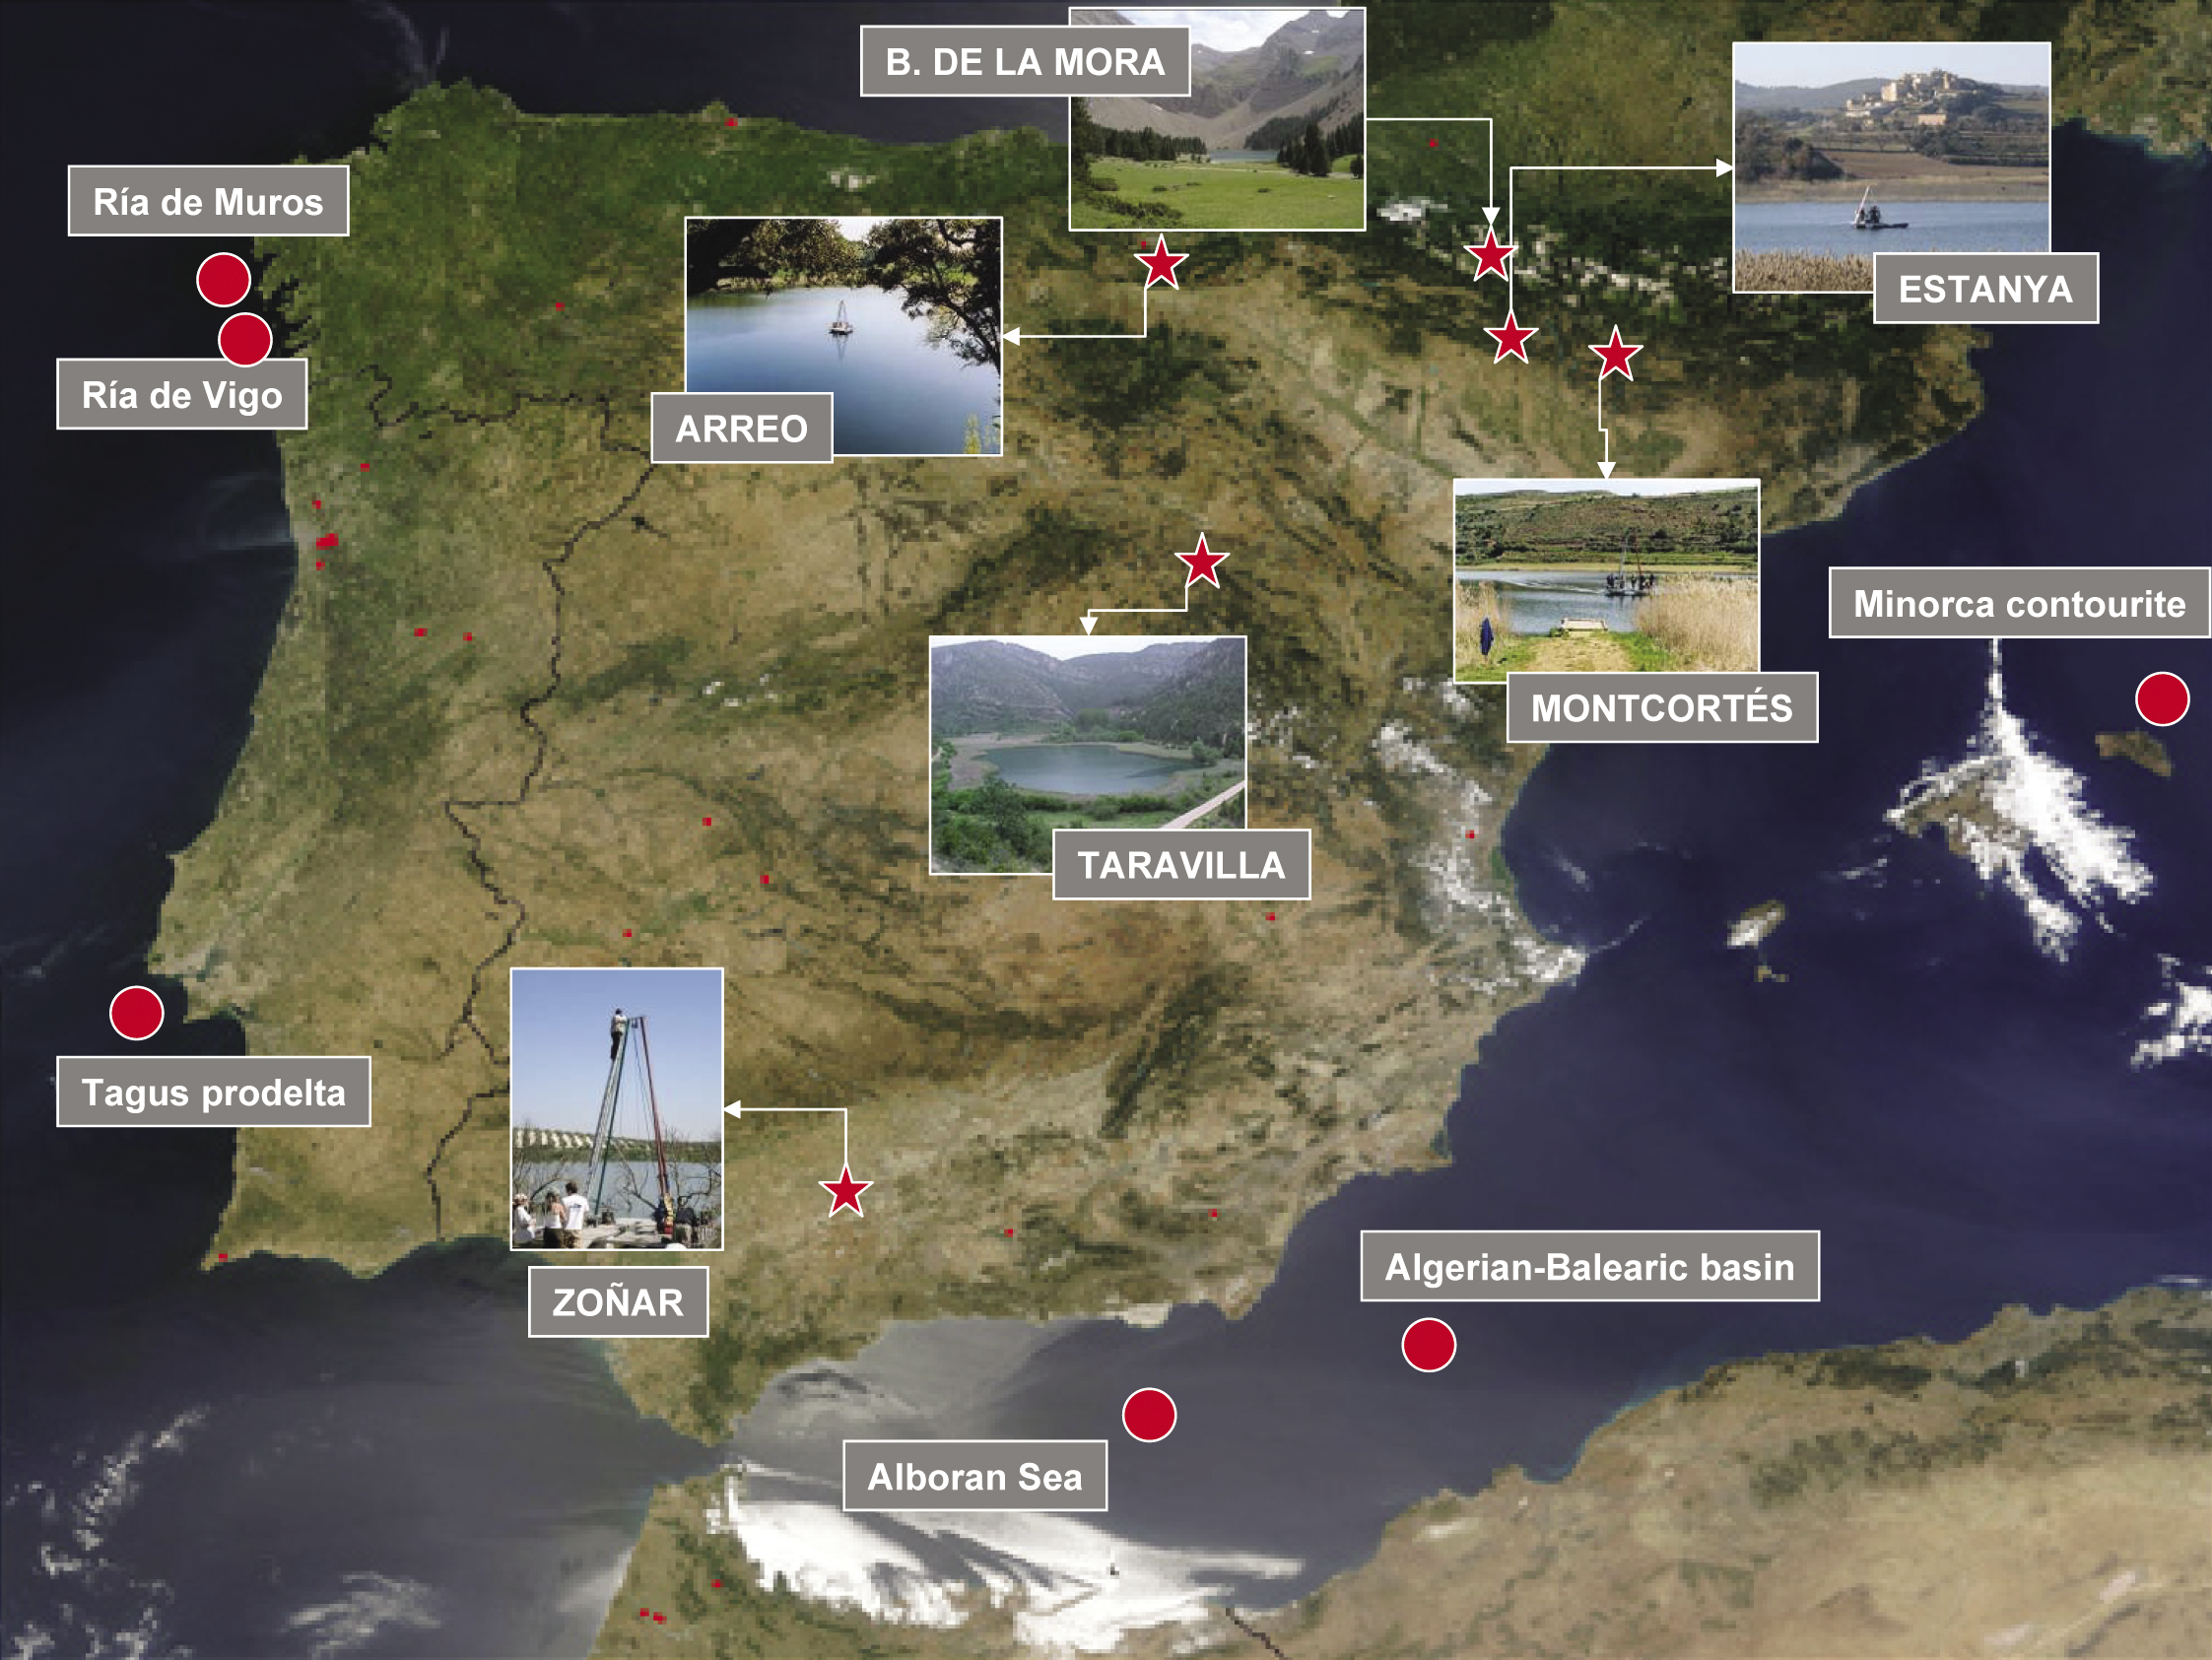
Figure 1: Satellite image of the Iberian Peninsula region with the location of lake records (stars) and marine sites (dots) discussed in the text. Image from: Jacques Descloitres, MODIS Rapid Response Team, NASA/GSFC. |
Their relative small size, direct connection to surface aquifers, and rapid response to precipitation make Iberian karstic lakes particularly sensitive to moisture changes. Detailed sedimentological and geochemical analyses, complemented with the study of biological proxies (chironomids, diatoms and pollen), have been performed on long sedimentary records retrieved in 2004 from several Spanish lakes. In Figure 1 we show the location of the lakes where the MCA signal is recorded, together with some marine cores discussed below.
 |
|
Figure 2: Compilation of global and Iberian climate reconstructions over the last 2000 years. Global records include sun spot numbers (Vaquero et al., 2002), solar irradiance (Bard et al., 2000) and temperature anomalies for the Northern Hemisphere (Jones and Mann, 2004). Iberian Peninsula records are aligned from west to east (see Fig. 1 for location) and include SST from marine cores offshore Tagus River (Rodrigues et al., 2009), lake level of Estanya Lake (Morellón et al., in press), number of floods observed in Taravilla Lake (Moreno et al., 2008), Rb/Al ratio from Zoñar Lake record (Martín-Puertas et al., 2010), number of detrital events per year recorded in Montcortés Lake (Corella et al., in press) and coarse detrital grain fraction from off Minorca (Frigola, unpublished data). |
Most of the studied lakes (e.g., Estanya, Taravilla, Zoñar, Arreo and Montcortés) record relatively shallower lake levels and more arid conditions during the MCA. This is indicated by higher chemical concentrations in the water, and the predominance of sclerophyllous Mediterranean vegetation, heliophytes and more evergreen trees in the catchment. In Figure 2, the most representative Iberian records are compared with global reconstructions, such as the number of sunspots (Vaquero et al., 2002). The fact that each lake is unique and responds differently to climate variability according to its geological, hydrological, and limnological characteristics makes it necessary to use case-specific proxies and apply local individualized interpretations. The reconstruction of lake level in Lake Estanya in the Pre-Pyrenees, mostly based on sedimentary facies and elemental and isotopic geochemistry (Morellón et al., in press), clearly shows a lake level increase from the end of the MCA to the LIA (Fig. 2). Similarly, the presence of gypsum-rich laminated facies in Arreo Lake (northern Ebro Basin, Fig. 1) suggests generally lower lake levels during the MCA (Corella et al., unpublished), while a thermophilous plant association recorded in the Montcortés Lake sedimentary sequence (Rull et al., in press) points towards warmer climate in the central Pre-Pyrenees. A comparable paleohydrological signal is recorded in Lake Taravilla, located in the Iberian Range. In this lake, coarser grain-size layers with higher siliciclastic content reflect paleoflood events during periods of increased run-off triggered by intense rainfall (Moreno et al., 2008). These layers are more frequent during the LIA and almost absent during the MCA (Fig. 2). Rb/Al ratios and Si concentration, used as proxies for run-off in Lakes Zoñar and Basa de la Mora, further indicate that a drier climate extended across the Iberian Peninsula during the MCA, compared to the following centuries (Martín-Puertas et al., 2010; Pérez et al., unpublished data). Despite local differences and some dating uncertainties, the MCA stands out as a relatively dry period, which was characterized by decreased lake water balance in the eastern and, likely, the southern part of the Iberian Peninsula.
The western Iberian Peninsula lacks high-resolution lake records of the MCA, but marine sediment cores provide some paleohydrological information. Several studies conducted offshore of Lisbon indicate that the MCA was a dry interval as inferred from reduced run-off (Abrantes et al., 2005; Lebreiro et al., 2006). On the Mediterranean side, the percentage of coarse particles in a sediment core from north of Minorca, located in a contourite drift, highlights an episode of weaker deep-water formation after 1300 AD, corresponding to the LIA (Fig. 2). At that location, particle grain-size is directly related to the intensity of deep-water currents that are formed in the nearby Gulf of Lions (Frigola et al., 2007). This result points to weaker westerlies during the MCA, which is consistent with a positive North Atlantic Oscillation (NAO) index at this latitude.
Climatic versus anthropogenic forcings
The areas surrounding some of the studied Iberian lakes were well populated during medieval times. This raises the need to discriminate climatically forced signals from anthropogenic effects on the lake dynamics (Rull et al., in press). For instance, in both Montcortés and Arreo lakes, sedimentation rates increased during the MCA (Fig. 2). However, discerning whether the higher sediment delivery was the result of climatic factors (increase in high-intensity storm events, relatively lower lake levels due to higher temperatures, more intense evaporation and decreased precipitation or more development of littoral environments) or produced by changes in land use practices (deforestation, farming and intensification of cultivation) is not an easy task. Most likely, human impact and climate variability had a joint effect on Iberian lakes during historical times. Fortunately, an integrated multiproxy approach provides some clues to detangle both factors. In Taravilla Lake, peak contents of Cerealia and other ‘‘anthropogenic’’ taxa associated with crops and ruderal plants occur at the base of the sequence when terrigenous paleoflood layers are scarce (Fig. 2). Thus significant removal of vegetation by human attributed fires or deforestation practices cannot be considered the main forcing for the increase in terrigenous layers (Moreno et al., 2008). In the same period, pollen reconstructions from Estanya (Morellón et al., in press), and Montcortés (Rull et al., in press) reflect warmer and drier conditions in a landscape dominated by junipers, Mediterranean elements (evergreen Quercus, Olea, Phillyrea, Buxus, Thymelaea and Rosmarinus), a relatively low presence of mesophylic woody taxa, heliophytes, some cultivated plants and a poorly developed aquatic component.
A global context for the Iberian aridity during the MCA
The Iberian records clearly documenting warmer conditions during the MCA are consistent with global paleoclimate reconstructions (e.g., Mann et al., 2009). Climate variability during the last millennium has been related to solar irradiance fluctuations and tropical volcanic eruptions (e.g., Shindell et al., 2001; Wanner et al., 2008). Recently, a persistent positive mode of the NAO during the MCA has been suggested (Trouet et al., 2009). This would lead to warmer and more arid climate in the western Mediterranean region. The Iberian Peninsula serves as a laboratory to explore the long-term pattern of the NAO index because of its location at the southern edge of the storm tracks associated with mid-latitude westerlies. Thus, a dry climate during the MCA is coherent with a dominant positive phase of the NAO, characterized by lower river discharge offshore Lisbon (Lebreiro et al., 2006; Alt-Epping et al., 2009), lower lake levels in northeast (Morellón et al., in press) and southwest Iberia (Martín-Puertas et al., 2010), fewer flood events in the Tagus River Basin (Benito et al., 2004; Moreno et al., 2008), and less intense westerly winds offshore Minorca Island (Frigola et al., unpublished data). Recent model simulations for temperature and precipitation in the Iberian Peninsula during the last millennium support the role of the NAO in creating a dry anomaly during medieval times (Gómez-Navarro et al., 2010). More analyses in progress and improved chronologies will facilitate a more detailed comparison of records to clarify the internal structure and spatial coherence of the main phases of environmental change during the MCA in the Iberian Peninsula.
references
For full references please consult: http://pastglobalchanges.org/products/newsletters/ref2011_1.html
Robert J. Oglesby1,2, S. Feng2, Q. Hu2 and C. Rowe1
1Department of Earth and Atmospheric Sciences, University of Nebraska at Lincoln, USA; roglesby2unlnotes.unl.edu
2School of Natural Resources, University of Nebraska at Lincoln, USA
The sea surface temperature anomalies associated with the Atlantic Multidecadal Oscillation may have been a major factor contributing to widespread drought in North America during Medieval times.
The role of the Atlantic Multidecadal Oscillation
 |
|
Figure 1: A) Spatial distribution of the proxy data of temperature changes during MT. Blue squares, gray dots and red squares indicate cooling, no changes and warming during Medieval Times, respectively. The contour lines are the observed temperature anomalies associated with AMO warm phases for the period 1901-2006 AD. The contour interval is 0.1°C. Details of the proxy data can be found in Feng et al. (2009). B) Difference in tree ring reconstructed Palmer Drought Severity Index (PDSI) for 900-1200 minus 1901-2000 AD. Shadings indicate the differences are significant at 95% confidence level by two-tailed student-test. The figure is adapted from Feng et al. (2010). |
Medieval times (900-1330 AD; hereafter referred to as MT) in central and western North America were, according to proxy data reconstructions, generally warm, and especially dry (Fig. 1), with numerous decadal or longer “megadroughts” that were the worst of the past 2000 years (Woodhouse and Overpeck, 2000). Considerable attention has been paid to the role of sea surface temperature (SST) anomalies in forcing these prolonged periods of drought, especially that of the La Niña-like condition in the eastern tropical Pacific (e.g., Graham et al., 2007; Seager et al., 2007). Compelling recent evidence suggests that North Atlantic SST, through the Atlantic Multidecadal Oscillation (AMO), may also have a strong effect on persistent summertime drought in North America (Fig. 1b). At present, the AMO expresses a 60-80 year cycle between relatively warm (warm phase) and cool (cold phase) SST (Kerr, 2000; Enfield et al., 2001).
We investigated the role of the AMO in MT drought in North America using modern (present-day) observations, proxy paleo-data, and simulations from multiple climate models (Feng et al., 2010). Considering present-day relationships, for which instrumental observations can be used, the results show that persistent summertime droughts in the U.S. Great Plains and southwest North America are closely related to multidecadal variations of North Atlantic SST (AMO). During the AMO warm (cold) phases, most of North America is dry (wet).
Next, the influence of North Atlantic SST on modern North American drought was examined using simulations made by five global climate models (Feng et al., 2010). When forced by warm North Atlantic SST anomalies, all models captured significant drying over North America despite some regional differences. Specifically, all the models simulate dry summers in the Great Plains and southwestern North America. The response of precipitation to a cold North Atlantic is much weaker, with greater disagreement among the models. Overall, the ensemble of the five models reproduced the statistical relationships between dry/wet fluctuations in North America, and North Atlantic SST anomalies (Feng et al., 2010) quite well.
The AMO during Medieval times
Investigations of proxy SST records in both the tropical Pacific and North Atlantic (Feng et al., 2008, 2009) found a consistent basin-wide warming in the North Atlantic Ocean during MT (Fig. 1), supporting previous studies that there were generally warm periods in the North Atlantic realm (Lamb, 1977). The proxy records from the Pacific Ocean, however, yielded opposite results about SST changes in the eastern tropical Pacific during MT, with some suggesting La Niña-like conditions, while others suggest neutral or even El Niño-like conditions (Feng et al., 2008).
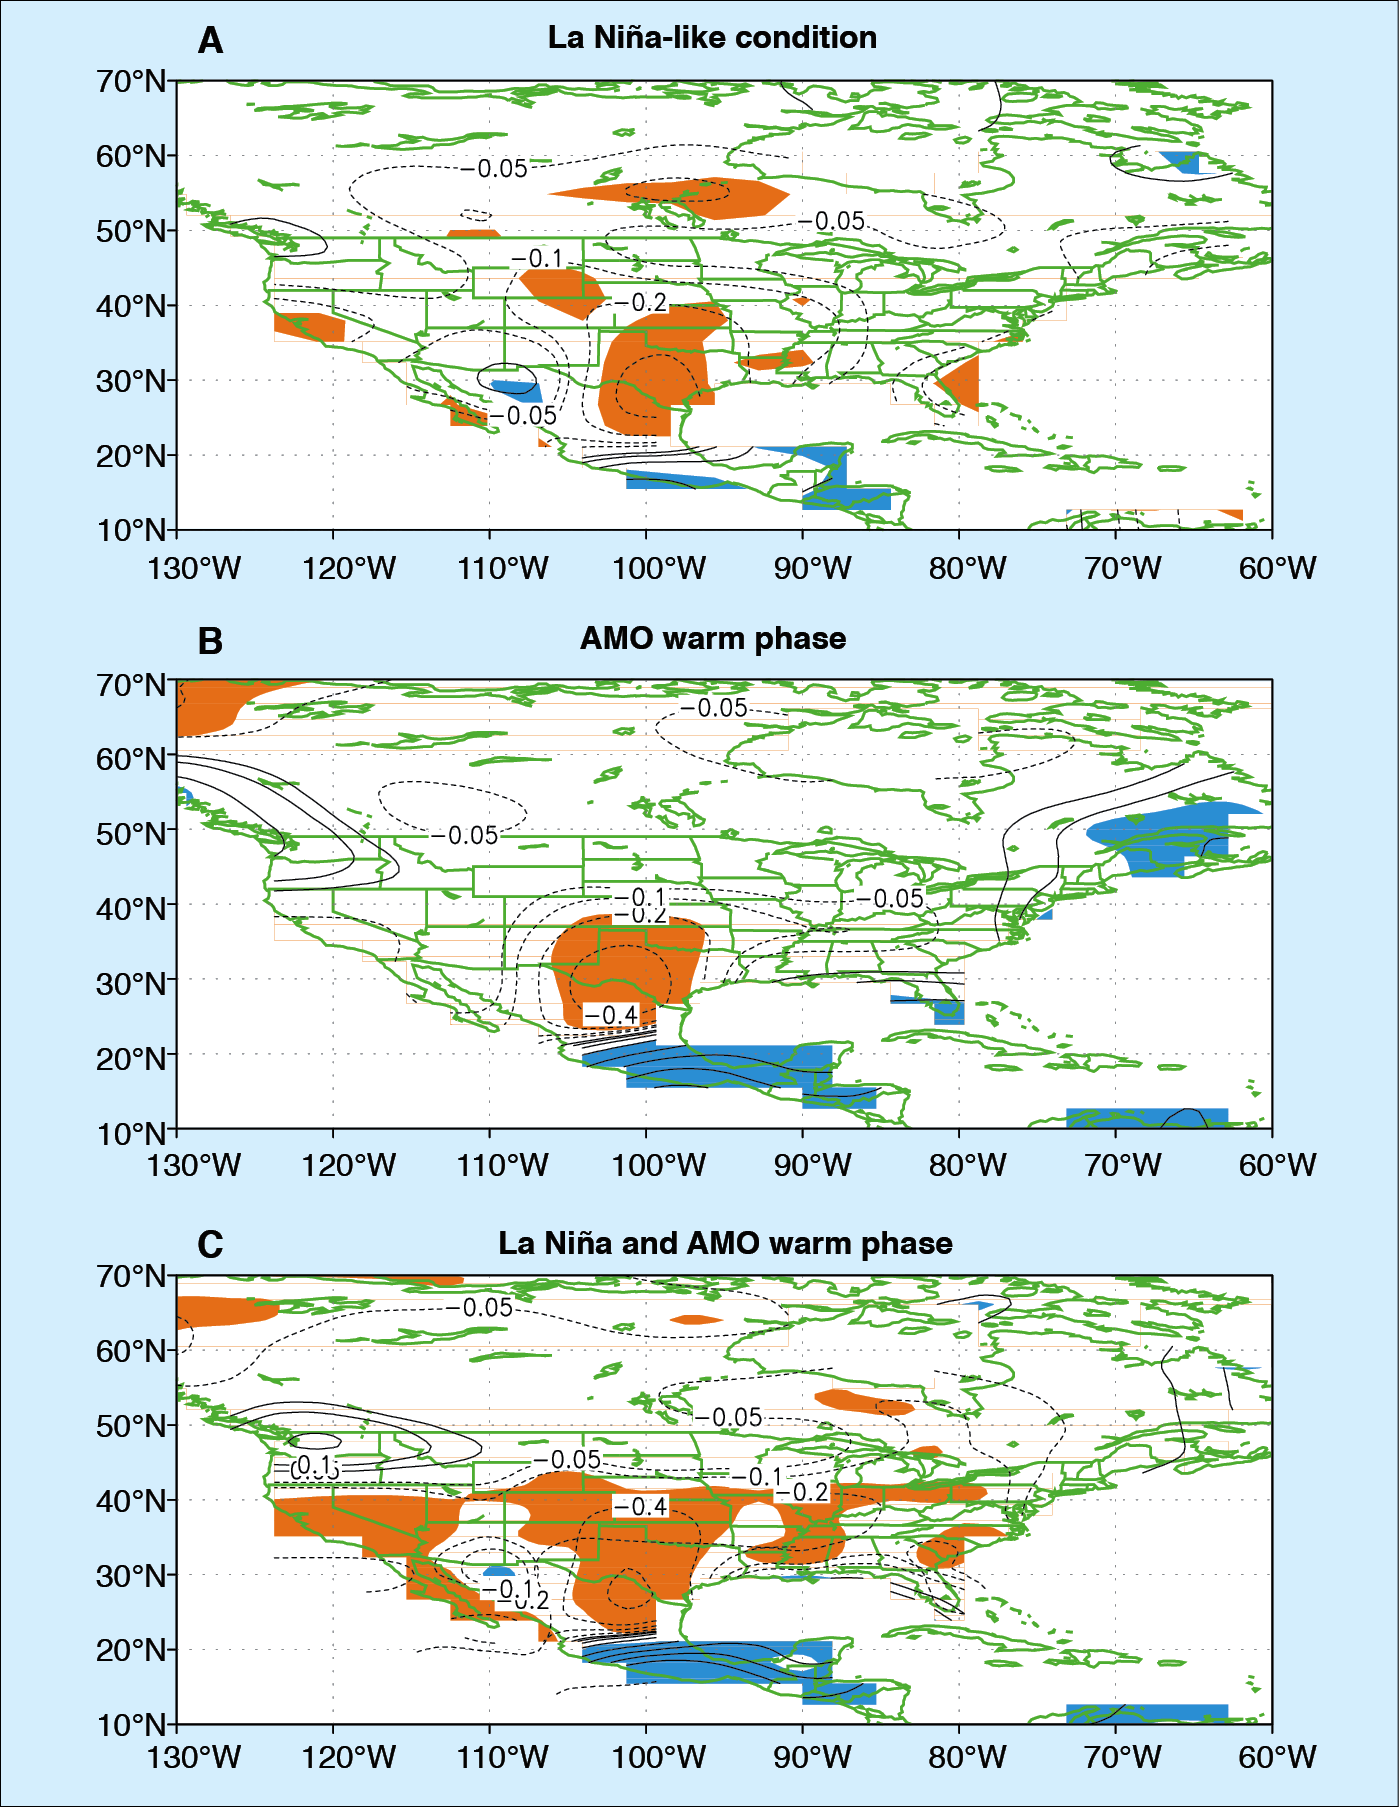 |
|
Figure 2: Influences of (A) La Niña-like conditions in the eastern tropical Pacific Ocean, (B) AMO warm phase SST in the North Atlantic and (C) both La Niña-like SST in the tropical Pacific and AMO warm phase SST in the North Atlantic on the annual averaged daily precipitation (mm/day; solid lines are positive and dotted lines are negative anomalies with respect to the control run). Shadings indicate the anomalies are significant at the 95% confidence level based on a two-tailed student-test. Figure adapted from Feng et al. (2008). |
Using one particular model, the NCAR Community Atmosphere Model (CAM3), we further demonstrated that warm North Atlantic SST anomalies might have played a major role in the MT drought over much of North America (Feng et al., 2008). The MT drought could be simulated either by perpetual La Niña-like conditions in the eastern Pacific or by the warm phase of the AMO in the North Atlantic. La Niña conditions alone resulted in the best simulation of the intensity of MT drought (Fig. 2a), while simulation with a warm phase AMO alone reproduced well its areal extent (Fig. 2b). The two together can explain both the severity and longevity of the droughts (Feng et al., 2008) as shown in Figure 2c.
The AMO throughout the Holocene
To provide a longer-term perspective, we analyzed SST variations in the North Atlantic Ocean for the last 10 ka using empirical orthogonal functions (EOF). The first spatial mode (EOF1) accounts for 52.5% of the variance of the Holocene SST and demonstrates a basin-wide structure in the North Atlantic that clearly resembles the AMO pattern recorded during the recent instrumental period (Feng et al., 2009). The first principal component (PC1) associated with EOF1 is thus a good index that represents the temporal variations of the AMO-like SST pattern during the Holocene. The proxy record indicates that the MT drought is just one of many previous droughts on centennial timescales that impacted North America. We further demonstrated that these centennial droughts appear closely related to the AMO-like SST variations in the North Atlantic (Feng et al., 2010).
How does the AMO affect North American drought?
Clearly, the AMO or AMO-like SST had the capacity to strongly modulate precipitation and drought over North America throughout the Holocene. But the evidence presented above is all essentially statistical in nature, i.e., over a variety of timescales the AMO appears highly correlated with precipitation (and drought) over North America. The question arises: through what physical processes and mechanisms do the SST patterns reflected by AMO affect North American precipitation? Preliminary analyses from a suite of long model simulations made with the CAM3 suggest some intriguing and even surprising results (Hu et al., unpublished). A primary connection is through the influence of the AMO on the subtropical high-pressure zone in the North Atlantic (Wang et al., 2007). In summer, the poleward flow on the western side of this high-pressure system funnels moisture into the central and western US, providing a source for most of the summertime precipitation in those regions. During the warm phase of AMO, the subtropical high is displaced north and east of its mean location, reducing moisture transport into the US except along the mid-Atlantic coast. During the cool phase, the subtropical high strengthens and pushes westward, allowing for more moisture transport into the central and western US. Similar mechanisms appear to be at play during MT (Feng et al., 2008).
Future directions
The above results are intriguing, but still very preliminary. Proxy reconstructions and modern observations suggest that the AMO is associated with drought in North America. Understanding the physical mechanisms by which the AMO affects this drought remains, however, less clear. Furthermore, the AMO acts along with other phenomena, especially El Niño Southern Oscillation and the Pacific Decadal Oscillation. A much deeper understanding isrequired of how these various phenomena act together, over a variety of timescales.
references
For full references please consult: http://pastglobalchanges.org/products/newsletters/ref2011_1.html
Jürg Luterbacher1, R. Neukom2,3,4, F.J. González-Rouco5, L. Fernandez-Donado5, C.C. Raible2,6 and E. Zorita7
1Department of Geography, Justus Liebig University Giessen, Germany; Juerg.luterbachergeogr.uni-giessen.de
2Oeschger Centre for Climate Change Research (OCCR), University of Bern, Switzerland
3School of Earth Sciences, University of Melbourne, Australia
4Lamont-Doherty Earth Observatory, Earth Institute at Columbia University, Palisades, USA
5Astrophysics Department, University Complutense of Madrid, Spain
6Climate and Environmental Physics, University of Bern, Switzerland
7Helmholtz-Zentrum Geesthacht, Germany
An austral summer temperature reconstruction for southern South America for the last millennium is compared to paleoclimate simulations provided by two Atmosphere-Ocean General Circulation Models with special emphasis on the Medieval Climate Anomaly.
The understanding of the current and future processes, and dynamics of the climate system can greatly benefit from the knowledge of past spatial patterns, trends, amplitudes, and frequencies of climatic variations (Jones et al., 2009, and references therein). Until recently, the rather low number and uneven spatial distribution of temporally highly resolved proxies from the Southern Hemisphere did not allow reliable continental scale reconstructions at interannual-to-interdecadal timescales (Neukom et al., 2010). Given the importance of the potential seesaw mechanism between the Northern and Southern Hemisphere (NH and SH) and the driving role of the SH oceans in regulating global climate variability, South America is a key region for the study of climate processes and dynamics. Climate in South America is influenced by a variety of oceanic and atmospheric patterns, such as the El Niño Southern Oscillation (ENSO) and the Southern Annular Mode (SAM; Garreaud et al., 2009). Thus, SH climate reconstructions covering the past centuries to millennia can provide insights into the underlying mechanisms of climate variability and forcing imprints. Such reconstructions are essential for data/climate model comparisons. Here, we present results from a new multiproxy-based austral summer (DJF) temperature reconstruction that covers the last 1000 years in southern South America (SSA) (Neukom et al., 2010). Special emphasis is given to the temperature difference between the periods 1001-1350 (“Medieval Climate Anomaly”, MCA) and 1400-1700 (“Little Ice Age”, LIA). Furthermore, austral summer temperature reconstructions are also compared with two coupled atmosphere-ocean general circulation models (AOGCMs): The two ECHO-G simulations Erik1 and Erik2 using identical external forcings, but different initial conditions (i.e., the initial conditions used in year 1000 AD in Erik2 where cooler than in Erik1; González-Rouco et al., 2006), and one simulation with CCSM3 (Hofer et al., 2010). The models use slightly different anthropogenic and natural forcings, including different levels of atmospheric concentrations of carbon dioxide, methane, and nitrous oxide, of solar activity, and of volcanic aerosols. We also provide austral summer temperature difference patterns (MCA minus LIA; 1001-1350 minus 1400-1700 AD) for both the multiproxy reconstruction with their associated uncertainties and the corresponding simulations from the three model simulations.
Austral summer temperature reconstructions back to the MCA and comparison with two AOGCMs
 |
|
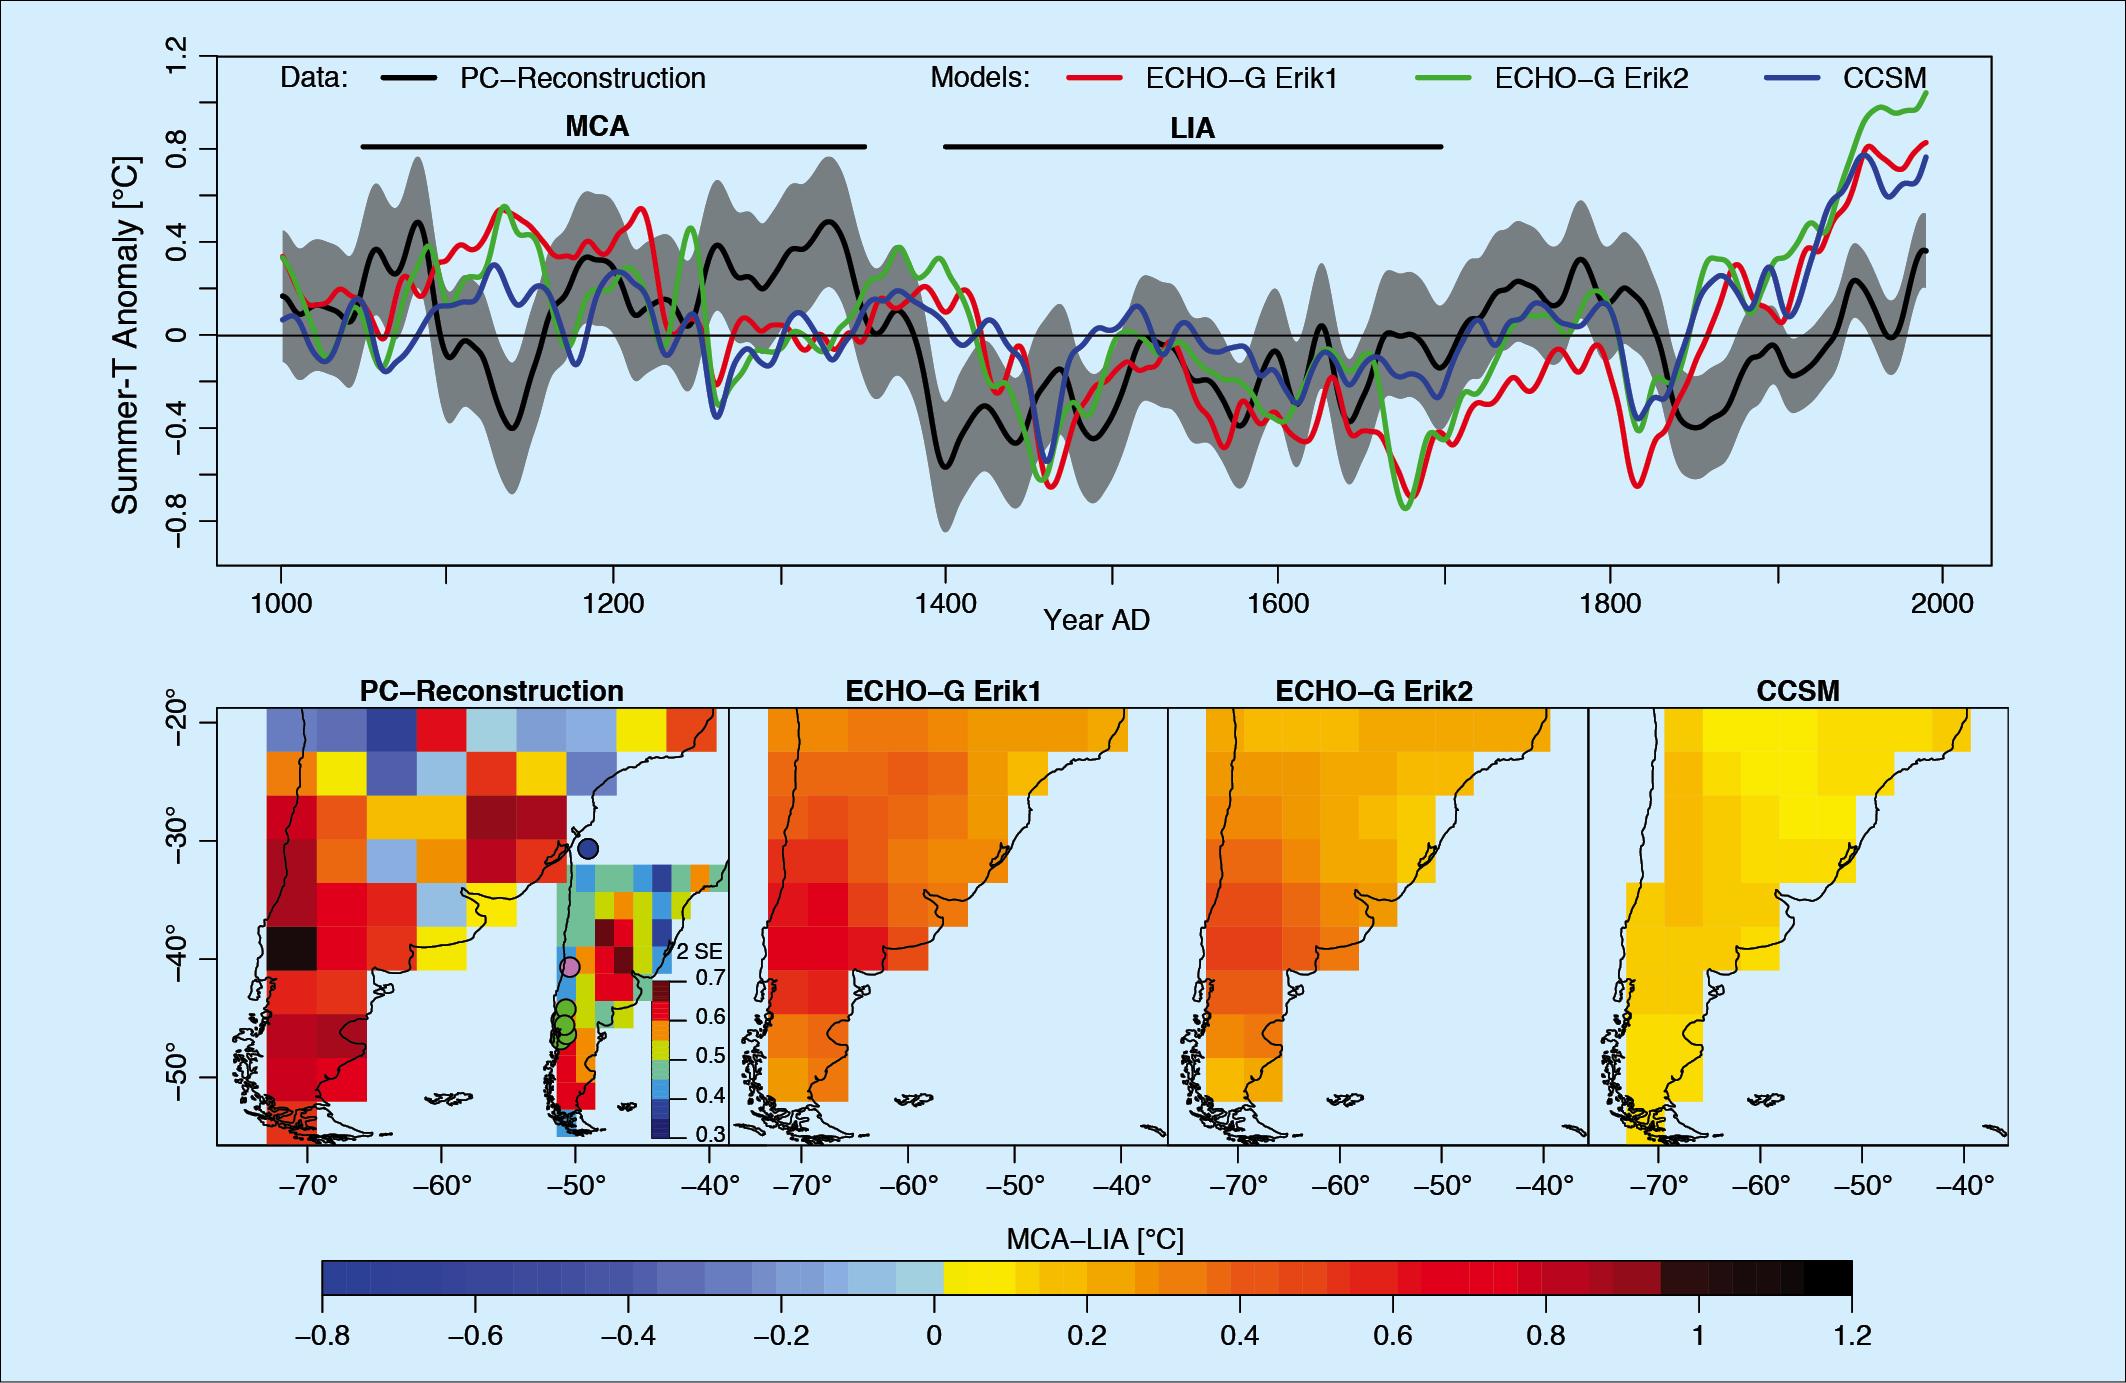
Figure 1: Top: Austral summer (DJF) surface air temperature for southern South America (south of 20°S) for the period 1001-1990 AD (Neukom et al., 2010), expressed as 30-year Gaussian filtered anomalies with respect to the 1001-1700 AD climatology. Black: principal component-multiple regression based reconstructions and associated filtered ±2 SE uncertainty bands (shaded); red: ECHO-G Erik1, green: ECHO-G Erik2, blue: CCSM3 AOGCM simulations. Bottom: Spatial austral summer (DJF) surface air temperature difference patterns (MCA minus LIA; 1001-1350 minus 1400-1700 AD) for the multiproxy reconstruction (left; interpolated to the 3.75°x3.75° grid of the AOGCMs) and the AOGCMs simulations . The inset in the left panel represents the available proxy time series in the pre-1700 period (green: tree ring series; purple: lake sediment record; blue: ice core) and the 2 SE derived from the 20th century calibration period, averaged over the period 1001-1700 AD (Neukom et al., 2010). |
Figure 1 shows the austral summer (DJF) land-surface air temperature anomalies (with respect to the 1001-1700 AD reference period) for SSA (south of 20°S) both for the principal component-multiple regression based reconstructions (Neukom et al., 2010) and the three model simulations spanning the period 1001-1990 AD. The reconstruction generally points to warmer conditions during the MCA. A strong decrease in temperature is visible in the second half of the 14th century. The climate reconstruction for this period mainly relies on tree-ring information from the Andes, lake sediments from Central Chile and an ice core from the tropical Andes (Neukom et al., 2010; see Fig. 1 bottom left). Cooler conditions prevail throughout the late 17th century (LIA). The difference in mean austral summer temperature between the two periods (1001-1350 minus 1400-1700 AD) is approximately 0.39°C in the reconstruction, 0.14°C and 0.49°C in CCSM3 and Erik1, respectively. A possible explanation for the rather small difference in the CCSM3 simulation compared to the Erik1 simulation is the lower equilibrium climate sensitivity of CCSM3. The associated ±2 Standard Error (SE) uncertainties of this difference (based on the uncalibrated variance in the 20th century calibration period; see Neukom et al., 2010, for more details) for the MCA and the LIA are of the order of ± 0.3°C (shaded parts in Fig. 1 top panel). The interpretation for the sudden drop in the mean temperature during the “MCA-LIA“ transition is not known yet.
The reconstructions (Neukom et al., 2010) point to positive temperature anomalies in the 18th century, followed by a cooling phase that starts in the early 19th century. Since approximately the 1850s, SSA has experienced a long-term warming trend with superimposed shorter cooling periods. The multiproxy-based reconstruction and the AOGCMs generally agree on the centennial-scale warm and cold phases and their amplitude. However, there are differences between the reconstruction and the models in the timing of the MCA-LIA transition, which appears around 60 years later in the models. Additionally, the simulated transition is a two step process: a first step is initiated with the strongest volcanic eruption of the last millennium around 1258 AD and a second step coincides with the Spörer solar Minimum (ca. 1460-1550 AD) . Thus the model simulations seem to be more sensitive to external forcings than the multiproxy reconstruction would suggest. This leads to larger model temperature amplitudes on decadal timescales, in particular for the ECHO-G simulations. The models overestimate the warming in industrial time with respect to the proxies, most likely because of aerosol forcing and land use changes which are not considered in the simulations.
Figure 1 (bottom panels) shows the austral summer surface air temperature difference patterns (MCA minus LIA; 1001-1350 minus 1400-1700 AD) for the multiproxy reconstruction (left) and the three simulations. The inset in Figure 1 (bottom left) represents the available proxy records as well as the distribution of the ±2 SE over the period 1001-1700 AD. In the reconstructions, the MCA was up to 1.1°C (1.6°C in the non interpolated 0.5°×0.5° resolved version of Neukom et al., 2010) warmer compared to the LIA, which is apparent in the west and south and partly in the east of SSA. The reconstructions in those areas can be considered as reliable, as reflected by the low SE (Fig. 1, bottom inset). Less reliable are regions in the centre of SSA and parts of Patagonia. This is mainly due to the lack of proxy data in these regions and some quality issues in the instrumental calibration data. The reconstructed MCA conditions in the northwestern- and northeasternmost parts were slightly colder compared to the LIA.
ECHO-G simulations (Erik1 and 2) and to some extent also the CCSM3 simulation are generally in good agreement with the overall anomaly pattern of the reconstruction and both models show the anomalous warm conditions during the MCA period compared to the LIA with strongest anomalies in the southwest. The negative values in the northeast are not reproduced by the two models considered herein.
Conclusions
The paucity of high-resolution proxy data covering the early part of the last millennium results in uncertain multiproxy reconstructions for the medieval period. Though not homogeneous in time, this early period until approximately the mid 14th century is, on average, warmer than the subsequent period until around 1700 AD. There is a rather good agreement between the reconstruction and the two AOGCMs both in terms of mean conditions as well as the general spatial anomaly pattern. Future work based on more high-resolution proxy records, including detection and attribution studies, will help to refine these patterns, as well as the timing and causes of the MCA-LIA transition.
references
For full references please consult: http://pastglobalchanges.org/products/newsletters/ref2011_1.html
Andrew Lorrey1, I. Goodwin2, J. Renwick1 and S. Browning2
1National Climate Centre, National Institute of Water and Atmospheric Research, New Zealand; a.lorreyniwa.co.nz
2Department of Environment & Geography, Macquarie University, Sydney, Australia
Contrasting Australasian and Antarctic proxy archive signals are being exploited to reconstruct regional- and Southern Hemisphere-scale atmospheric circulation patterns, which indicate that the frequency of blocking events across the southwest Pacific increased during the Medieval Climate Anomaly.
A recent focus on the land-sparse and data-sparse Southern Hemisphere (SH) has begun to fill critical gaps in our observational record of past climates identified by the paleoclimate research community (Jansen et al., 2007). This thrust is providing balance to Northern Hemisphere (NH) reconstructions, and is facilitating linkages between archives from the tropics through to Antarctica. Underscoring the usefulness of Australasian mid-latitude climate reconstructions are newly emerging perspectives about past extremes and mean climate state changes for the region. These new views are supplementing the general understanding of natural climate variability ranges prior to land-based instrumental records (typically less than 150 years coverage), and are expanding knowledge about tropically-based climate phenomena (El Niño-Southern Oscillation (ENSO), Interdecadal Pacific Oscillation (IPO), Indian Ocean Dipole, the Madden-Julian Oscillation, Australasian monsoon and the South Pacific Convergence Zone (SPCZ)) and other key extra-tropical components of the global climate system (e.g., the Antarctic Circumpolar Current (AAC), the Southern Annular Mode (SAM), and the mid-latitude westerlies).
Regional paleoclimate reconstructions in Australasia are being undertaken to increase natural climate variability understanding, leading to more robust validation of global climate models and improved model selection for future scenario-building. This approach is feeding into improved formulation of scenarios that are guiding mitigation and climate change adaptation strategies for Australia, New Zealand, and the small island nations of the Southwest Pacific. Observed patterns in multi-proxy paleoclimate syntheses are currently being compared to broad-scale circulation outputs from paleoclimate models (i.e., Paleoclimate Modelling Intercomparison Project (PMIP)), which will verify how well some climate models perform for the Australasian region. A key time span includes the last 2000 years, which contains the Medieval Climate Anomaly (MCA). The MCA expression in Australasia is particularly relevant to study because this period is considered as a key analogue to a future warmer-than-present world.
Approaches to integrating proxies
For New Zealand, a paleoclimate proxy integration approach called Regional Climate Regime Classification (RCRC) is being used to link paleoclimate time slices to modern circulation analogues (Lorrey et al., 2007, 2008). Uniquely, inferences about past atmospheric pressure patterns made from RCRC time slices provide a qualitative “upscaling” that can complement limited downscaled paleoclimate model information. This approach has been a boon for directly comparing proxies that are sensitive to atmospheric circulation changes and paleoclimate model outputs that lack sufficient locally downscaled precipitation or temperature results (e.g., PMIP), opening a new avenue for climate model testing and validation.
An alternative approach is employing pressure gradient and threshold detection algorithms to identify hemispheric circulation patterns associated with regional paleoclimate anomalies (Goodwin et al., 2010). The approach links modern synoptic type sets to unique climate responses at each proxy site.
With the exception of annually-resolved proxies used in the aforementioned synoptic paleoclimatology approaches, there is some uncertainty in the alignment of the archive signals that cover the MCA because of chronological uncertainties and sampling resolutions. In addition, some proxies are more susceptible to distortion than others due to geophysical and anthropogenic activity (Lorrey et al., 2010). However, careful interpretations of the records within a regionally-comprehensive network have meant multi-centennial approximations of past circulation patterns are possible using the two aforementioned approaches.
Regional synoptic circulation reconstructions for the MCA
 |
|
Figure 1: A) RCRC paleoclimate time slice for New Zealand covering ca. 750-925 AD. Proxy sites and interpretation of paleo-precipitation signals are indicated with filled circles. The proxies used for this time slice included pollen, coastal accretion deposits, lake and alluvial sediments, and speleothems. The regional shading indicates how each of six homogenous climate districts (after Kidson, 2000) were qualified, based on a subjective assessment of the available proxy evidence in each district. The regional divisions coarsely correspond to the main axial ranges of New Zealand, which intersect the prevailing flow. The national paleoclimate anomaly pattern was compared to modern reference regimes (Kidson, 2000) to support inferences about the synoptic types that would have characterized past circulation anomalies. Synoptic types proposed for the paleoclimate time slice were then used to generate a conceptual pressure anomaly map, indicated by regions of high (H) and low (L) pressure, suggesting more frequent northerly and easterly flow. B) Distal and local proxy data used in pressure gradient / threshold detection analysis (Goodwin et al., 2010) are included, such as Law Dome (Antarctica) ice core data, Lake Frome (AUS) lake level reconstructions, and the East Coast of Australia wave climate reconstructions. These proxies were used to produce a SH pressure anomaly signature, indicating how the New Zealand regional anomalies fit within a hemispheric pattern. |
The example RCRC time slice shown for ca. 750 to 925 AD (Fig. 1a) covering New Zealand is analogous to what occurs in a typical La Niña year, when northern and eastern regions tend to receive normal or above normal rainfall, and southern and western regions are often drier than normal. Overall the pattern is analogous to a blocking regime (Kidson, 2000), typified by more frequent northerly and easterly circulation synoptic types that block the prevailing west-to-east progression of anticyclones and troughs that characterize New Zealand’s daily weather variability. Blocking patterns are generally more frequent during the warm season in La Niña years when the sub-tropical high pressure belt moves southward, conspiring with the SAM (often in a positive mode during Austral summer; L’Heureux and Thompson, 2006) to increase anticyclone presence over southern New Zealand. This pattern also has a spatially similar signature to the penultimate IPO-negative phase between 1944-1976 AD.
Time slices produced for New Zealand suggest an MCA that can be broken into at least three phases; an early (ca. 750-1075 AD), middle (ca. 1100-1300 AD), and late (ca. 1350-1550 AD) phase (Lorrey et al., 2010). Weaker precipitation anomalies in the northern and eastern regions of New Zealand in the late MCA phase indicate a slackening of the blocking strength. The middle phase is characterized by oscillations back and forth between more frequent northerly and easterly circulation (blocking) and periods of more frequent southwesterly flow (zonal regimes). The oscillatory nature of the mid-MCA phase is also suggested by at least three surface exposure age- and radiocarbon-dated glacier advances in the Southern Alps (Schaefer et al., 2009) and periods of cooler summer temperatures reconstructed from tree rings in western South Island (Cook et al., 2002).
Variability and drivers during the Polynesian Warm Period
The early 2nd millennium AD heralded the arrival and permanent occupation of New Zealand by Maori (Wilmshurst et al., 2008), and it has been suggested that this interval could be termed “the Polynesian Warm Period” (PWP; Williams et al., 2009). The PWP corresponds to the mid- to late-MCA phases described above, which saw significant Polynesian voyaging episodes and cultural shifts in the southwest Pacific (Anderson et al., 2006; Allen, 2006). The “La Niña-like” blocking patterns that are strongly indicated for New Zealand prior to and during the PWP support evidence from other paleoclimate reconstructions that suggest the SH westerly wind belt and ACC shifted northward between ca. 650-1250 AD with Antarctic cooling that affected the mid-latitudes. It is proposed that high latitude changes in this interval helped set up a positive high-latitude/tropical feedback that initiated a more “La Niña-like” climate state in the equatorial Pacific (Mohtadi et al., 2007), consistent with reconstructions of a “cool” ENSO signature in the central-eastern Equatorial Pacific, expansion of the Hadley circulation, and ridging in the NH mid-latitudes (Graham et al., 2010). Under a blocking regime, there would have been enhanced anticyclonic activity in the SH mid-latitudes, including the Tasman sector. However, significant zonal regime episodes during the mid- to late- MCA/PWP suggest that blocking regimes were not exclusive at the time, but rather there were sustained, strong periods of bi-modal circulation operation. This raises the likelihood that the regional variability associated with both ENSO (and IPO) phases (including droughts, storms, SPCZ shifts, local changes in tropical cyclone incidence, prevailing wind change, and SST anomalies) were probably as significant during the MCA/PWP to Australasian and Pacific Island populations as they are at present.
The atmospheric circulation anomalies reconstructed for New Zealand during the early MCA are nested within a larger SH pattern that blankets the Australasian and southwest Pacific sectors (Fig. 1b), indicated by a multi-proxy-based pressure gradient reconstruction using Eastern Australian coastal behavior and wave climate, Southern Australian mega-lake hydrology, coral-based subtropical sea-surface temperatures, East and West Antarctic ice core glaciochemistry, and Antarctic lake hydrological balance and katabatic wind records (Goodwin et al., 2010). Composites of the conjoint archive signals for the Southern Hemisphere during the early MCA alludes to the basic structure of the Tasman region circulation anomaly suggested by the New Zealand RCRC reconstruction. More important, the synoptic reconstructions produced from the New Zealand and wider spatial approaches have been done independently, but thus far have yielded some similar results for the characteristic patterns and also timing of circulation changes during the MCA. Both reconstructions suggest predominance of Tasman Sea region blocking during the early MCA, and easing of the anomaly pattern between ca. 1350-1550 AD (Goodwin et al., 2010; Lorrey et al., 2010).
Future direction
Comparison of different paleo-integration approaches (qualitative and quantitative) based on multi-proxy data assemblages that are aligned to reconstructing atmospheric pressure patterns are adding confidence to past change interpretations for Australasia, and are providing a synoptic/dynamical basis for interpreting and understanding past climates. In essence, the synoptic patterns reconstructed for New Zealand, Australia, and other locations in the SH should fit together like jigsaw puzzle pieces, and the reconstructions that result commonly (but not always) appear analogous to distinct hemispheric circulation modes that are temporally fractal (self-similar). We suggest the large-scale patterns that generate distinct atmospheric pressure anomalies across the SH mid-latitudes are important to recognize for paleoclimate science, and provide a mechanism for rectifying contrasting archive signals. The patterns also provide a means to link proxies spaced by large distances, and for surmounting difficulties that arise where local climatic effects guided by orographic influences are strong. The addition of new high resolution proxy reconstructions from speleothems, lakes, tree rings, coastal and glacial deposits on land, as well as corals and other biogenic archives (like corals, shells and otoliths) are expected to enrich the chronology of changes that are emerging from the Australasian region.
acknowledgements
This work has been funded through the Foundation for Research Science and Technology programmes “Adaptation to Climate Variability and Change” (CO1X0701) and “Modelling palaeoclimate data to inform the future” (UOAX0714), The Royal Society of New Zealand Marsden Fund (UOA-108), and the Australian Department of Environment and Climate Change. This synopsis contributes to the PAGES AUS2K effort.
references
Goodwin, I.D., Cohen, T., Mayewski, P., Lorrey, A., Browning, S., Curran, M., van Ommen, T. and Renwick, J., 2010: The Medieval Climate Anomaly – A view from down under. Abstract PP34B-06 presented 2010 Fall meeting, American Geophysical Union, San Fransisco, Dec. 13-17.
For full references please consult: http://pastglobalchanges.org/products/newsletters/ref2011_1.html
Quansheng Ge and Wenxiang Wu
Institute of Geographic Sciences and Natural Resources Research, Chinese Academy of Sciences, Beijing, China; wuwxigsnrr.ac.cn
Various climate archives reveal a heterogeneous occurrence of the Medieval Climate Anomaly in China in terms of timing, amplitude and duration. Uncertainty analyses indicate that it is difficult to assess whether the medieval warmth exceeded that of the late 20th century.
During the past few decades, the Medieval Climate Anomaly (MCA), a supposed interval of elevated temperatures between approximately AD 900 and 1300, has generated considerable interest due to its potential value as a “natural” analogue of 20th century “greenhouse” warming. Recently published National Research Council (2006) and IPCC (2007) reports have placed a high priority on identifying the confidence level in regional to hemispherical temperature changes during the past 2000 years, including the putative MCA.
China is one of the few regions in the world with almost all types of climate archives that could provide high-resolution proxy data, including the world’s longest continuous written historical records. Temperature time series of the last 500 to 2000 years have been reconstructed based on historical documents and natural archives (e.g., tree rings, ice cores, stalagmites, lake sediments) from China. In this paper, the results of regional proxy-based reconstructions are reviewed and the associated reconstruction uncertainty is assessed.
Regional reconstructions
 |
|
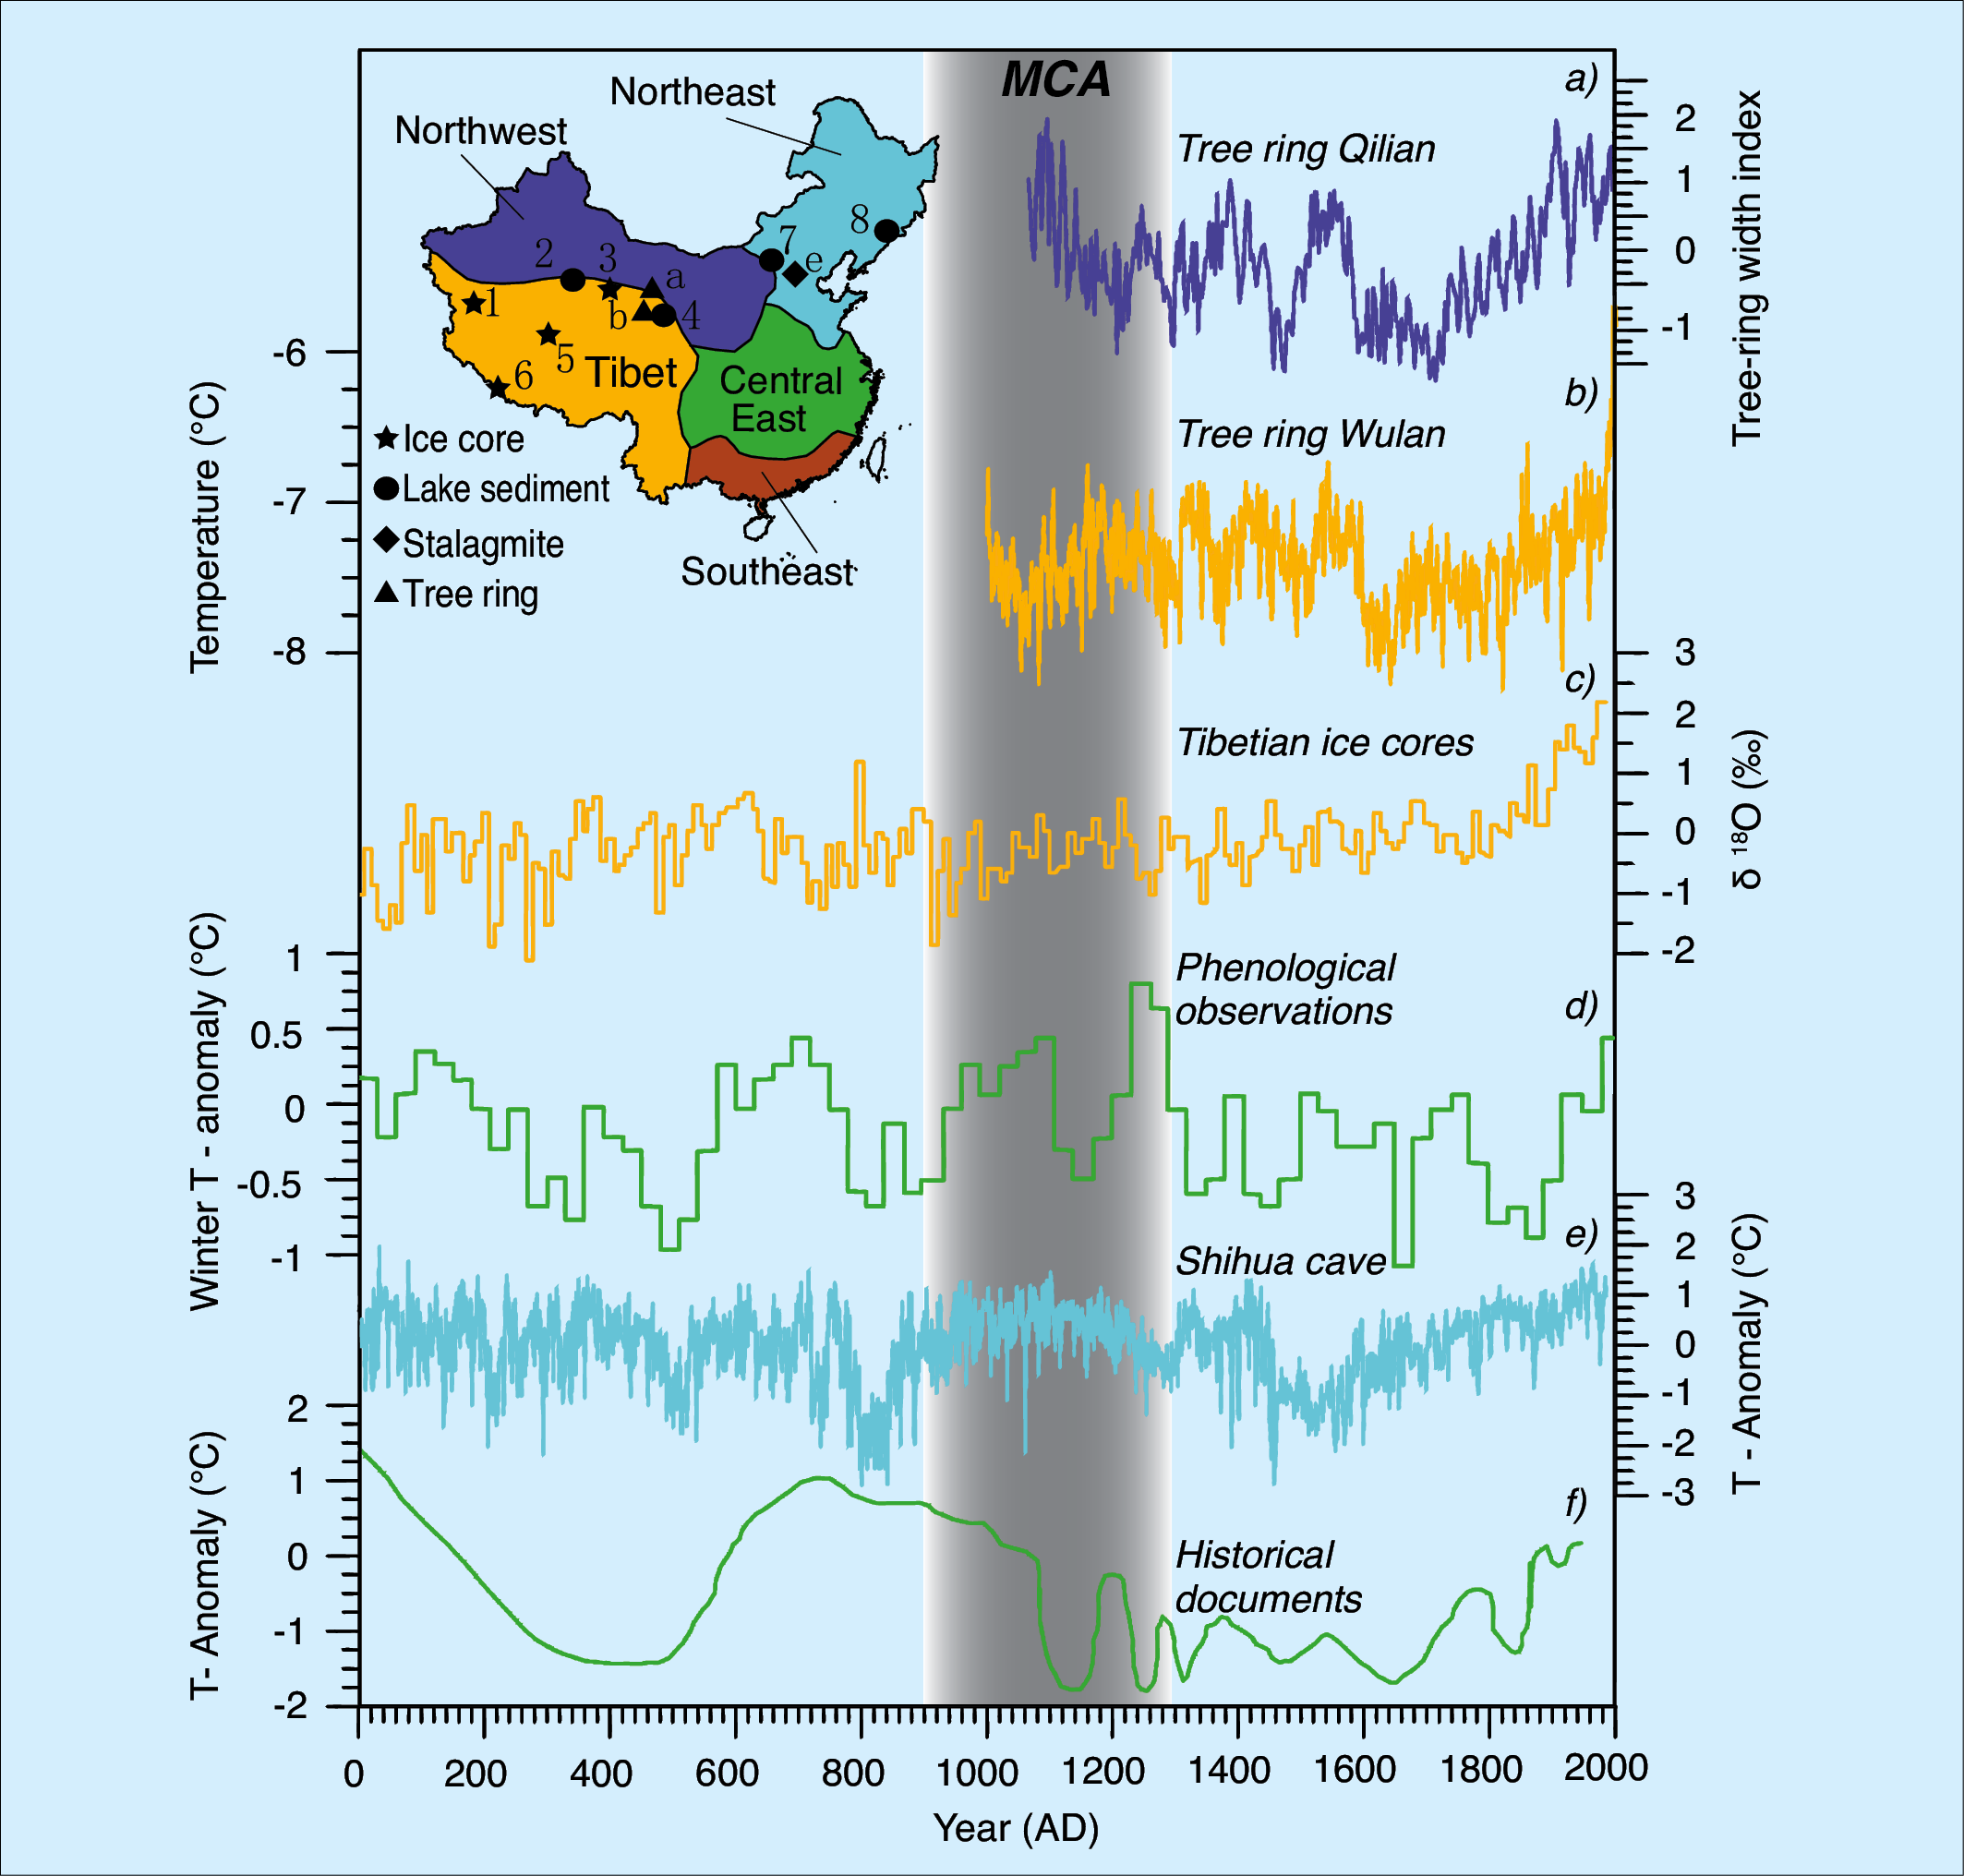
Figure 1: Locations of proxy temperature series and the five defined climate regions (inset), and examples of the longest temperature series from four climate zones: a) Ring-width index developed for Qilian juniper in middle Qilian Mountains (Northwest) (Liu et al., 2007); b) Reconstructed mean temperature from September to April for the Wulan area (Tibet) (Zhu et al., 2008); c) Tibetan Plateau δ18O composite (Tibet) (Thompson et al., 2006b); d) Winter half-year (Oct-Apr) temperature anomaly (Central East) (Ge et al., 2003); e) Shihua temperatures from July to August (Northeast) (Tan et al., 2003); f) Annual mean temperature variations (Central East) (Chu, 1973). The locations of the archives a, b and e are depicted in the inset. Not shown are c, d and f which are regional composites or represent regional temperature conditions. Other natural archives decribed in the text but not shown in the main panel are: 1. Guliya ice core; 2. Sugan lake sediments; 3. Dunde ice core; 4. Qinghai lake sediments; 5. Puruogangri ice core; 6. Dasupu ice core; 7. Daihai lake sediments; 8. Jinchuan peat sediments. |
Five climate regions of China have been selected (Northeast, Northwest, Central East, Tibet, and Southeast) to conduct the uncertainty assessment of the regional reconstructions (Ge et al., 2010). However, the Southeast has been excluded from the regional reconstructions assessment because the time series from that region are too short to cover the MCA. Examples of regional reconstructions from the climate zones are shown in Figure 1.
For the Northeast region temperature proxy data from lake sediments, peats and stalagmites cover the last 2000 years. The MCA is heterogeneously expressed in all three series in terms of timing, amplitude and variation patterns. The annually resolved 2650-year warm season (May, June, July and August: MJJA) temperature series reconstructed by a stalagmite layer thickness record from the Shihua Cave (115°56’E, 39°47’N), Beijing, indicates a pronounced warmth occurring from the 9th to 13th centuries (Fig. 1e) (Tan et al., 2003). The δ18O proxy record from peat cellulose with a 20-year resolution from the Jinchuan peat (126°22’E, 42°20’N), Jilin Province, reveals a pronounced warm period at around AD 1100-1200 (Hong et al., 2000). However, the MCA is not visible in the quantitatively reconstructed mean July temperature from the Daihai Lake sediment (Xu et al., 2003).
The Tibet region has four reconstructed temperature series covering more than 950 years. One is a composite of the ice cores Dasuopu, Dunde, Guliya and Puruogangri (Fig. 1c), one is based on tree rings and two are individual lake sedimentary records. The MCA is discernable in form of a δ18O maximum in Dunde and Guliya ice records, invisible in Puruogangri ice record, and shows a negative trend in the Dasupu record (Thompson et al., 2006a). When the four ice cores are composed as one series, the MCA is not discernable (Thompson et al., 2006b) (Fig. 1c). The temperature reconstruction based on tree-ring widths of Qilian juniper from Wulan (Fig. 1b), Qinghai Province, indicates a moderate warming around AD 1144-1264 (Zhu et al., 2008). A lower resolution Total Organic Carbon (TOC) record form Qinhai Lake sediment in the Qinghai Province reveals warm and dry conditions from AD 1160-1290 (Shen et al., 2001); while the sediment record of Sugan lake in the same province shows a pronounced warm period from AD 500-1200 (Qiang et al., 2005).
In Central East China, Ge et al. (2003) reconstructed winter (October to April) temperatures at a 10- to 30-year resolution from phenological observations recorded in Chinese historical documents for the past 2000 years (Fig. 1d). According to this reconstruction, the winter temperatures from AD 930-1310 in central eastern China were 0.2°C higher than those of the 1950s-1970s, with a maximum warming of 0.9°C occurring during the AD 1230-1250 period. This pronounced warm anomaly was once disregarded by Chu (1973), one of the most famous Chinese climatologists who initiated the study of climatic changes by historical documents. He found that the climate turned cold at the beginning of the 11th century. Although it warmed at the 13th century, the mean amplitude during this period was lower than the average conditions during the past 2000 years. So he suggested that as a whole the Song periods (AD 960-1279) were generally characterized by a cold period (Fig. 1f). However, later studies pointed out that Chu’s reconstruction were based on an incorrect calendar conversion applied to dates of spring snowfall in Hangzhou, the capital of the Southern Song Dynasty (AD 1127-1279) (Zhang, 1994). Subsequent studies suggested the existence of an MCA in Central East China by using multiple independent subjective phenological evidences, which include the distribution and the north cultivation boundaries of winter wheat, sugarcane, tea plant, citrus and ramie, the safety date for full heading time of rice in Kaifeng, the capital of the Northern Song Dynasty, and plant phenological evidence in Hangzhou (Zhang, 1994; Man, 1996).
In the Northwest, the only highly resolved temperature reconstruction is a tree-ring record form the middle Qilian Mountain covering the last millennium, which reveals that a discernable warm period occurred AD 1050-1150 (Liu et al., 2007) (Fig. 1a).
 |
|
Figure 2: Upper panels (I): Proxy mean annual temperatures with decadal resolution and their uncertainty range in (a) Northeast, (b) Central East, (c) Tibet and (d) Southeast climate zones (see inset Figure 1). Lower panels (II): The bold-brown curve is the regional temperature coherent series, the part with fewer series is marked with a dashed bold brown curve, and the bold gray curve is the 10-year smoothed instrumental temperature. The right axes represent the temperature anomaly with respect to the different period and different regions. Figure after Ge et al. (2010). |
Seen from a regional perspective, all four studied regions experienced warm periods within the 10th to 14th centuries. However, the timing, duration and magnitudes of these warm periods vary substantially in each region and between regions. The maximal temperature in Central East China in the AD 1240s is ~0.8°C above the AD 1901-1950 average (due to the various regions from where reconstructions are available and the variable instrumental data availability, the period AD 1901-1950 has been selected as the common reference period for all areas). The maximal temperatures are 0.4°C warmer in the 1190s for the Northeast and 0.2°C in the 1000s for the Tibet region. In the Northwest, the highest temperatures were reached in the 1100s. Finally, in the Northeast and Central East regions, the warm peaks during AD 900-1300 are higher than temperatures of the late 20th century (Ge et al., 2010) (Fig. 2).
Uncertainty analysis
The proxy-based reconstructions are subject to uncertainties mainly due to dating, proxy interpretation to climatic parameters, spatial representation, calibration of proxy data during the reconstruction procedure, and available sample sizes. Recently, Ge et al. (2010) conducted an assessment in the uncertainty of the regional reconstructions by adopting the envelope assessment method used in the fourth assessment report of IPCC.
The results (Fig. 2) indicate that the proxies have a high level of confidence in the Northeast, Central East and Southeast for the last 500 years, but large uncertainties exist prior to the 16th century. On multidecadal to centennial timescales, several reconstructions show warming peaks that occurred during the period AD 900-1300, whereas their low confidence levels do not allow to assess whether the MCA has been warmer than the late 20th century.
references
Chu, K.C., 1973: A preliminary study on the climatic fluctuations during the last 5000 years in China, Scientia Sinica (Series A), 16 (2): 226-256.
For full references please consult: http://pastglobalchanges.org/products/newsletters/ref2011_1.html
Bo M. Vinther
Center for Ice and Climate, University of Copenhagen, Denmark; bogfy.ku.dk (bo[at]gfy[dot]ku[dot]dk)
Temperature signals in ice core data
Greenland ice core data can be used to derive information on past climatic conditions in the Greenland area. Recently, Vinther et al. (2010) demonstrated a high correlation between δ18O data and Greenland coastal temperature observations even on seasonal timescales, reaffirming the ability of ice core δ18O to capture local temperatures, first proposed by Dansgaard (1954).
The Vinther et al. (2010) analysis of the seasonal ice core δ18O data showed that the winter δ18O contains the strongest temperature signal, and that even annual average Greenland temperatures are more accurately captured in the winter δ18O rather than annual average δ18O data. This surprising fact is partly explained by the observation that Greenland winter temperatures are much more variable than summer temperatures and thus dominate the annual average variability (Vinther et al., 2010). Past Greenland climatic conditions can also be derived directly from Greenland ice core borehole temperature observations, by solving the equation of heat conduction in moving ice and firn (Dahl-Jensen et al., 1998). Using a Monte Carlo inversion technique, Dahl-Jensen et al. (1998) derived temperature histories from both southern and central Greenland from high precision borehole temperature measurements obtained at the DYE-3 and GRIP ice core drill sites. A third way of estimating past Greenland temperature conditions is to measure isotopes on nitrogen and argon trapped in air-bubbles within the ice (Severinghaus et al., 1998). These gases undergo a temperature dependent mass fractionation in the snow column before the air-bubbles are formed in the ice, thus retaining a retrievable temperature signal.
Greenland temperature conditions during the past two millennia
 |
|
Figure 1: Two Greenland ice core temperature proxies. Top: Bore hole temperature inversions from central (GRIP) and southern (DYE-3) Greenland (from Dahl-Jensen et al., 1998). Temperature deviations are given with respect to the period 1881-1980 AD. Bottom: Normalized winter δ18O from central (Crete, GRIP) and southern (DYE-3) Greenland smoothed with a Gaussian filter with a 50-year half-width (from Vinther et al., 2010). |
The Dahl-Jensen et al. (1998) inversions of two Greenland ice core borehole temperature profiles are shown in the top panel of Figure 1. Looking at the inversions it is important to remember that temperature signals in the ice sheet diffuse with time, meaning that the inversions will lose more and more high frequency information as we move back in time. Even so, it is clear from both the DYE-3 and the GRIP borehole temperature inversions that a warm Medieval Climate Anomaly (MCA) can be observed with peak temperatures from 800 to 1000 AD being some 1.3K warmer than the 1881-1980 AD reference period. From 1000-1400 AD a general cooling is observed at both drill sites, followed by two cold periods culminating around 1500 and 1860 AD, respectively. A recent warming culminating in the 1950s is also seen in both records. One noteworthy difference between the DYE-3 and GRIP temperature inversions is the amplitude of the most recent temperature oscillations. While some of the difference is probably climatic, it is also possible that the much higher accumulation rate at the DYE-3 drill site allowed for a better preservation of the recent temperature signals in the DYE-3 borehole, thus contributing to the higher amplitudes in the DYE-3 inversion.
In the bottom panel of Figure 1, winter δ18O records from three Greenland ice cores all spanning the past 1450 years are presented (Vinther et al., 2010). To ease comparison with the borehole inversions, the records have all been smoothed with a Gaussian filter (tuned to have 50% damping of a signal with a 50-year cycle). The MCA warmth is also seen in the winter δ18O data and it seems to coincide with the warmth observed in the borehole inversions. The first cold spells around 1500 AD are only clearly identifiable in the DYE-3 winter δ18O data, while the 1860 AD cold period and the warming culminating in the 1950s are seen in all three winter δ18O records.
It is noteworthy that the winter δ18O records and the DYE-3 borehole temperature inversion all suggest that the warming culmination in the 1950s resulted in Greenland temperatures comparable to or only slightly cooler than peak MCA warmth. This observation is supported by a recent study spanning the last millennium by Kobashi et al. (2010). Using the gas fractionation technique on ice cores, they found that peak Greenland temperature conditions in the in the 12th century were just 0.3K warmer than those observed during the 1950s. The GRIP borehole inversion is therefore the only data set suggesting significantly higher temperatures during the MCA than during the 1950s, lending further support to the speculation that the quite low accumulation rate at the GRIP drill site did hamper the inversion of this recent short-lived climatic warming.
references
Dansgaard, W., 1954: The O18-abundance in fresh water, Geochimica et Cosmochimica Acta 6: 241-260.
Steffen Vogt1, R. Glaser1, J. Luterbacher2, D. Riemann, Gh. Al Dyab1, J. Schoenbein1 and E. Garcia-Bustamante2,3
1Department of Physical Geography, Albert-Ludwigs-University of Freiburg, Germany; steffen.vogtgeographie.uni-freiburg.de
2Department of Geography, Justus-Liebig-University Giessen, Germany
3Astrophysics Department, University Complutense of Madrid, Spain
New evidence from documentary sources provides detailed climatic information to fill the Middle East gap in Medieval Climate Anomaly reconstructions.
The Middle East region harbors a wealth of documentary and natural archives that contain detailed information on climate conditions and events. To date, however, only a few proxy-based climate reconstructions are available from the area for the assessment of thermal and hydroclimatic characteristics of the Medieval Climate Anomaly (MCA). Existing chronologies and reconstructions mostly provide information for specific seasons and hydroclimatic parameters (commonly precipitation and droughts). The reconstructions are based on natural proxies such as tree rings (e.g., Touchan et al., 2007), pollen records (Kaniewski et al., 2010), speleothems (e.g., Bar Matthews et al., 1997; Frumkin et al., 1991; Fleitmann et al., 2004), lake sedimentary records (e.g., Kuzucuoğlu et al., 2011), Dead Sea sedimentary records (e.g., Enzel et al., 2003; Migowski et al., 2006) or Red Sea corals (e.g., Felis and Nimbur, 2010). For compilations of available data from natural and documentary archives the reader is referred to Luterbacher et al. (2006, 2011) and references therein. Most of this data is hampered by a high degree of spatial and temporal variability and/or insufficient spatio-temporal resolution to assess in detail the MCA climate. Therefore its spatial and temporal extent in the Middle East requires further investigations.
Historical climatology studies have shown that documentary archives are a valuable source for climate reconstructions during the last centuries (Brázdil et al., 2005, 2010; Glaser and Riemann, 2009; Glaser, 2008; Pfister et al., 1998, 1999). The large body of written historical sources from Islamic Medieval times shows great potential and perspective for climate reconstructions in the Middle East during the MCA. Apart from a few preliminary studies, e.g., by Grotzfeld (1991, 1995) and Oliver (1991), these sources have not yet been adequately explored from a climatological perspective (Jones et al., 2009). The recently funded German Science Foundation project “Historical Climatology of the Middle East based on Arabic sources since AD 800” aims at using Arabic sources to reconstruct past climate, including hydrological variations and extremes in the Middle East and northeastern Africa back to 800 AD.
Arabic historical documents as sources for climate reconstruction
In contrast to Europe, archives with regular and continuous records from Arabic medieval administrations have almost all either been completely destroyed or are barely accessible. Consequently, the source types for climate information for the period from 800 to 1500 AD are mainly restricted to the akhbār genre (historiographical literature) including universal and town chronicles, accounts of journeys, and occasional diaries. A basic principle in the analysis of these sources is the focus on reported events by contemporary authors.
 |
|
Figure 1: A facsimile of a page from the diary of Ibn Tawq, a Damascene notary. The entry dated Shawwāl 9, 885 AH (12.12.1480 AD) describes among other things the end of autumn and the beginning of the winter season (see Ibn-Tawq, 2000). |
Here we present preliminary results based on a survey of around 50 medieval Arabic historiographical literature sources. We include well known, edited works that have in some cases also been translated into English, German and French, such as al-Tabarī’s “History of Prophets and Kings” (al-Tabarī, 1960-1969 AD, 1985-2002 AD) but also less known chronicles and diaries from manuscripts (for an example see Figure 1). From some diaries, weather tables can be derived, e.g., for the period from 1480-1500 AD from the diary of the Damascene notary Ibn Tawq. In total, more than 3000 excerpts amounting to 5000 references on climate related information, have been extracted from these sources.
The peak in the amount of available data for MCA occurred in the 13th century in the Arabic regions; this is much earlier than in Europe where such sources were mainly produced after ca. 1500 AD (Glaser and Riemann, 2009; Brázdil et al., 2010; Pfister et al., 1998). The decrease in available records after the 13th century could be related to a shift in the writing style and focus of the Arabic chronicles from accounts of events to biographical data and anecdotes at the turn of the 16th century (Grotzfeld, 1995).
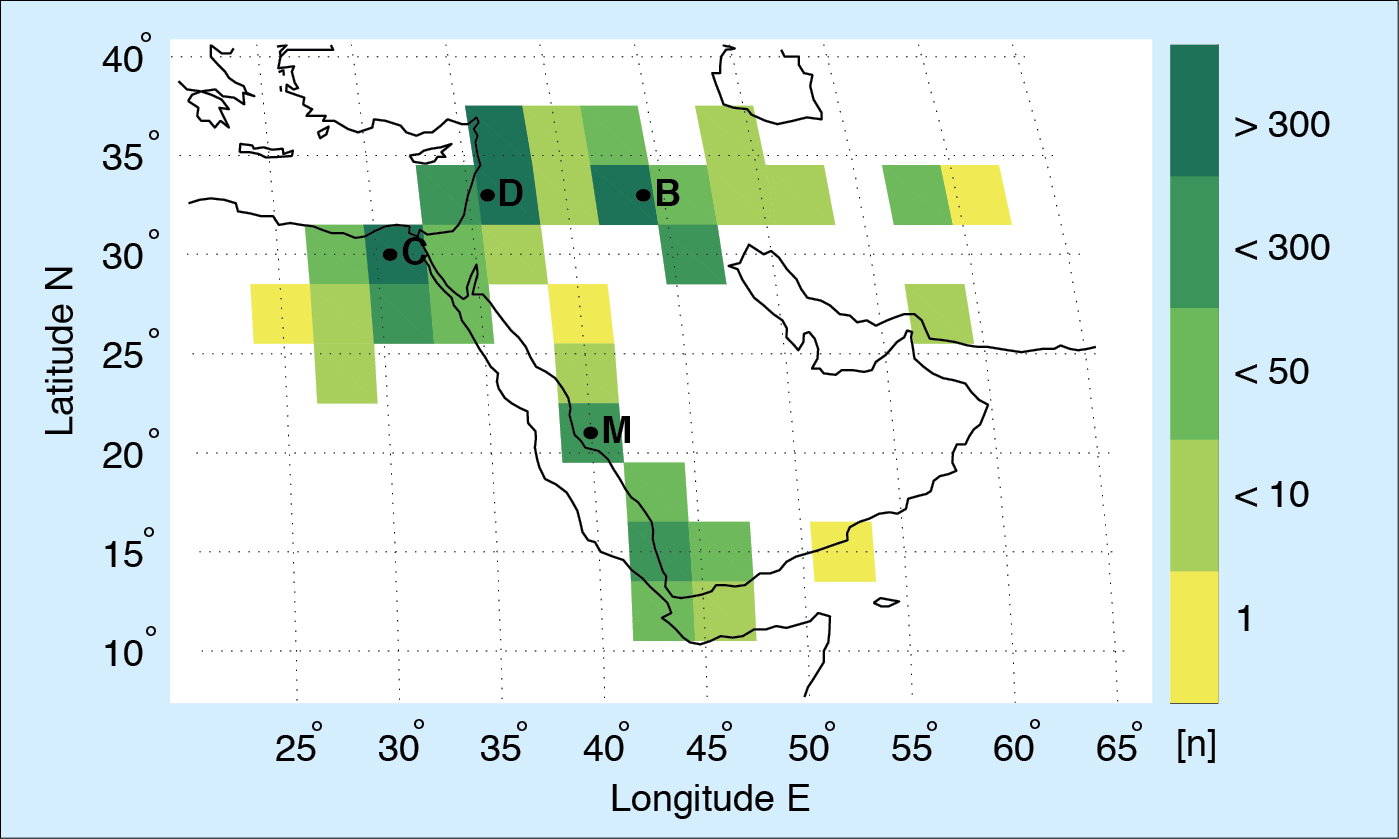 |
|
Figure 2: Spatial distribution of available information for the time period from 800 to 1500 AD. Squares show the location of reported events, the color indicates absolute number of reports. Note the concentration to the main cultural centers Baghdad (B) for the Abbassid period, Palestine and Syria with Damascus (D) for the Ayyubid period, Cairo (C) for the Fatimid and Mamluk period, and Hejaz with Mecca (M) and Medina. |
Figure 2 shows the spatial distribution of information held in our database to date for the time period from 800 to 1500 AD. The geographical coverage includes Iraq, Egypt, Syria and Palestine as well as the Hejaz and Yemen. In the course of time from the 9th to 15th century the spatial focus of the reports is moving from the Abbasid centers of power and science in Iraq to the Ayyubid centers in Syria and Palestine and finally to Fatimid and Mamluk Egypt reflecting the political and cultural changes in the area.
Winter rain and almond blossom instead of summer drought and tasty wine
In terms of climate-related information, the Arabic and European sources are in many respects similar. The authors usually report on events in their hometown and vicinity. Sometimes comparisons with remote or historical events are also made. The climatic information within a source is more or less sporadic, describing single events, especially natural hazards such as floods, droughts, and exceptionally cold or dry winters. In addition, the impacts of such events, their effects on harvest yields, food supply, economic and social crises are described. Reported events focus mainly on hydroclimatic and less on thermal conditions. The onset of the winter rainy season is one of the most frequently reported features due to its crucial role for agricultural production. Also, closely related to food supply are reports on droughts. For some cities like Baghdad, there exists the potential to establish continuous flood chronologies (Weintritt, 2009). An often-reported specific type of extreme event in the Middle East is sand storms, which are often connected to a specific circulation pattern (lower level Red-Sea Troughs, Saaroni et al., 1998). Cloud coverage is typically reported in connection with observations of the lunar crescent. Phenological information is linked to regional agricultural products such as dates or almonds. However, this kind of information is too sparse for the reconstruction of continuous time series.
Comprehensive data set to reconstruct climate for medieval times
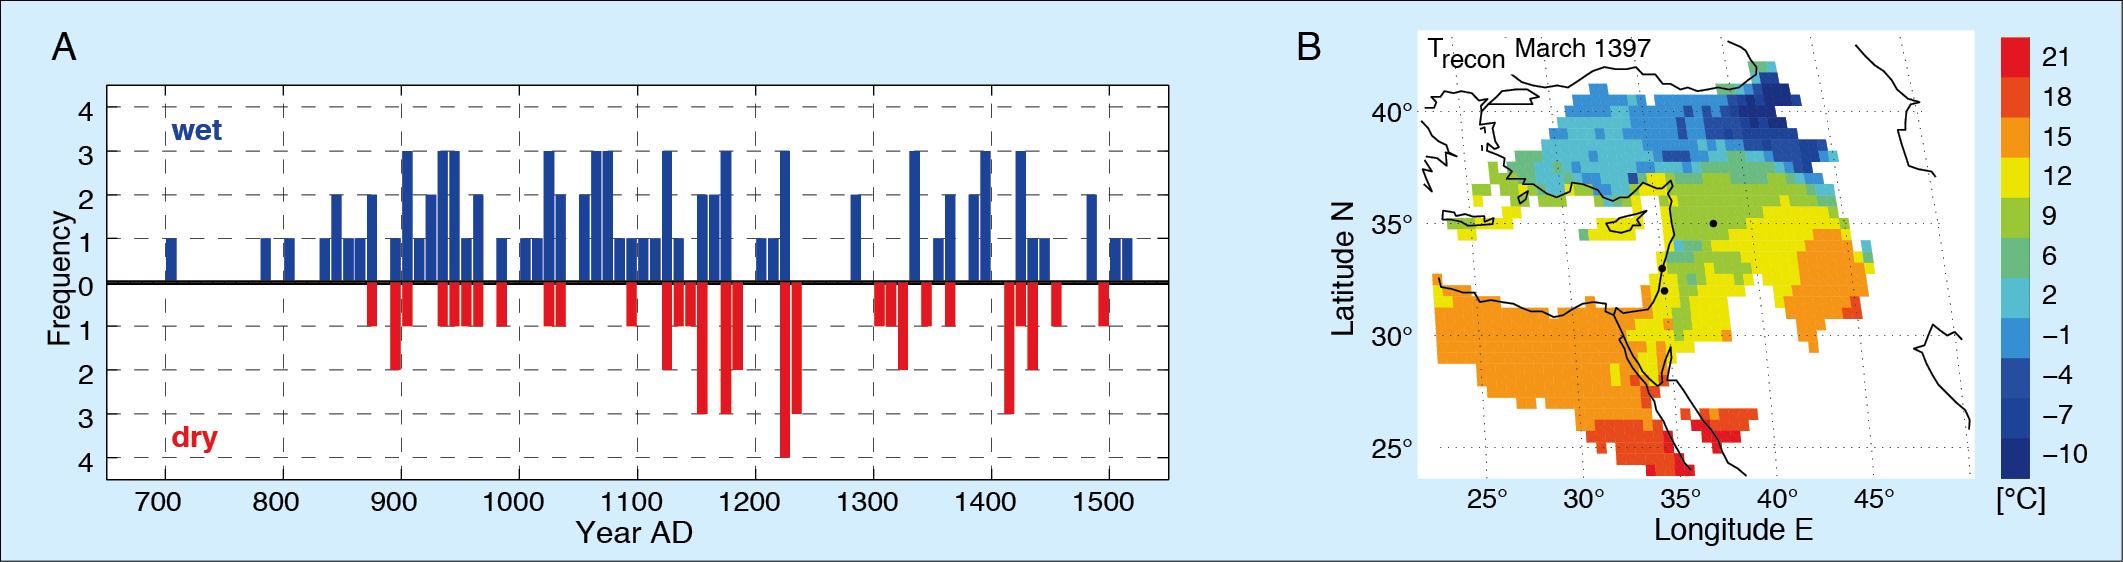 |
|
Figure 3: A) Example of a time series for hydroclimatic conditions for Iraq showing the number of wet (blue bars) and dry (red bars) winters per decade (modified after Grotzfeld, 1991). B) Example of large scale absolute temperature field reconstruction based on historical sources for March AD 1397. Black dots indicate locations of historical information used for this reconstruction. Temperatures are calculated for areas with correlation values >0.8 with location of historical information. For details on reconstruction methodology see Riemann (2011). |
Preliminary results show that the methodology of historical climatology, which has been mainly developed on the basis of European documentary sources, can be applied to this body of data as well. The hermeneutic approach, including critical source analysis and interpretation using information beyond the source texts, as well as classification and derivation of (semi-quantitative) indices can be adopted, but specific adaptations are required. These include methodological aspects of the analysis of Arabic sources, for instance the evaluation of isnad (chain of narrators) when assessing the reliability of relevant accounts in secondary sources. The dating is given in the Hijra calendar system based on lunar months. Its conversion into the Gregorian calendar is typically possible with a precision of one day. Arabic documentary data can be used to establish time series of hydroclimatic information with at least decadal resolution for most of the time span from 800 to 1500 AD. However, for some sub-periods much higher resolution can be achieved, e.g., daily resolution for periods in the 13th and 15th century where we can rely on information from diaries. The spatial distribution of the data for some periods further allows the reconstruction of large-scale temperature and precipitation fields (Fig. 3b, for details on methodology see Riemann, 2011). Future work also includes the reconstruction of more or less continuous temperature and precipitation series at a seasonal timescale. Figure 3a presents a preliminary time series of hydroclimatic winter conditions for Iraq. This time series is not fully homogenous yet, with major data gaps between 1200 and 1400 AD and therefore it does not allow an interpretation of the climate in the area for the whole period. However, in the currently available data, for instance for the periods 900-950 and 1020-1070 AD, a higher frequency of particularly wet winters can be observed.
The results will be further refined and compared with independent climate evidence from natural archives. Furthermore, links with North Atlantic/European and subtropical/tropical climate will be analyzed. Paleo-model output will be used to understand climate variations from the MCA over the Little Ice Age onwards to current conditions in the Middle East.
acknowledgements
The authors acknowledge support from the German Science Foundation (DFG), Project “Historical climatology of the Middle East based on Arabic sources back to AD 800“ (Gl 358/8-1, AOBJ:575151 / LU 1608/2-1 AOBJ 575150).
references
Grotzfeld, H., 1991: Klimageschichte des Vorderen Orients 800-1800 A.D. nach arabischen Quellen. In: Glaser, R. & R. Walsh (Eds): Historische Klimatologie in verschiedenen Klimazonen, Würzburger Geographische Arbeiten 80: 21-44.
Weintritt, O., 2009: The Floods of Baghdad: Cultural and Technological Responses. In: Mauch, C. and Pfister, C. (Eds), Natural Disasters, Cultural Responses. Case Studies toward a Global Environmental History, Lexington Books, 165-182.
For full references please consult: http://pastglobalchanges.org/products/newsletters/ref2011_1.html