PAGES Magazine articles
Pinxian Wang1, B. Wang2, and T. Kiefer3
1State Key Laboratory of Marine Geology, Tongji University, China; pxwang online.sh.cn
2School of Ocean and Earth Science and Technology, University of Hawaii, Honolulu, USA
3PAGES International Project Office, Bern, Switzerland
2nd PAGES Global Monsoon Symposium, Shanghai, China, 13-15 September 2010
Monsoon systems have earned increasing attention from the climatology community over the past decades, yet remain a subject of regional, if not local studies. Following the first Global Monsoon (GM) meeting in 2008 (see report in PAGES news 17(2), 2009), a second meeting was held in an attempt to put regional monsoons into the context of a global system, and to analyze their variations across a range of timescales. A total of 95 participants from 12 countries presented 30 talks and 39 posters.
One focus was the hydrological cycle. In present-day climate, the GM was shown to be coordinated by internal feedback processes such as ENSO variability. An increasing trend in global monsoon precipitation over the last 30 years is attributed to both the effects of global warming and atmosphere-ocean interaction in the Pacific Ocean (B. Wang). However, the link between SST and precipitation is not straightforward (J. Fasullo). In his keynote, Peter Webster showed that the area of the SST-defined Tropical Ocean Warm Pool (using a fixed criterion of 28°C) increased by 70% since 1920 and is expected to occupy the entire tropical ocean in 2100. However, when related to the column integrated heating, the area of the “dynamic warm pool” remained almost unchanged as it is determined by the SST gradient.
Combined data and modeling were used to address monsoon-related hydrological processes, e.g., to demonstrate how monsoon and deserts coexist as twin features of multi-scale forcing (G. Wu). Vegetation feedback modeling simulated that afforestation in monsoon regions cools summers, warms winters and increases spring-summer precipitation locally, but can affect remote climate into an opposite direction (Z. Liu). The use of transient climate simulation in Africa successfully simulated the abrupt start of the African Humid Period in the Sahel and revealed its connection with North Atlantic climate (B. Otto-Bliesner).
 |
|
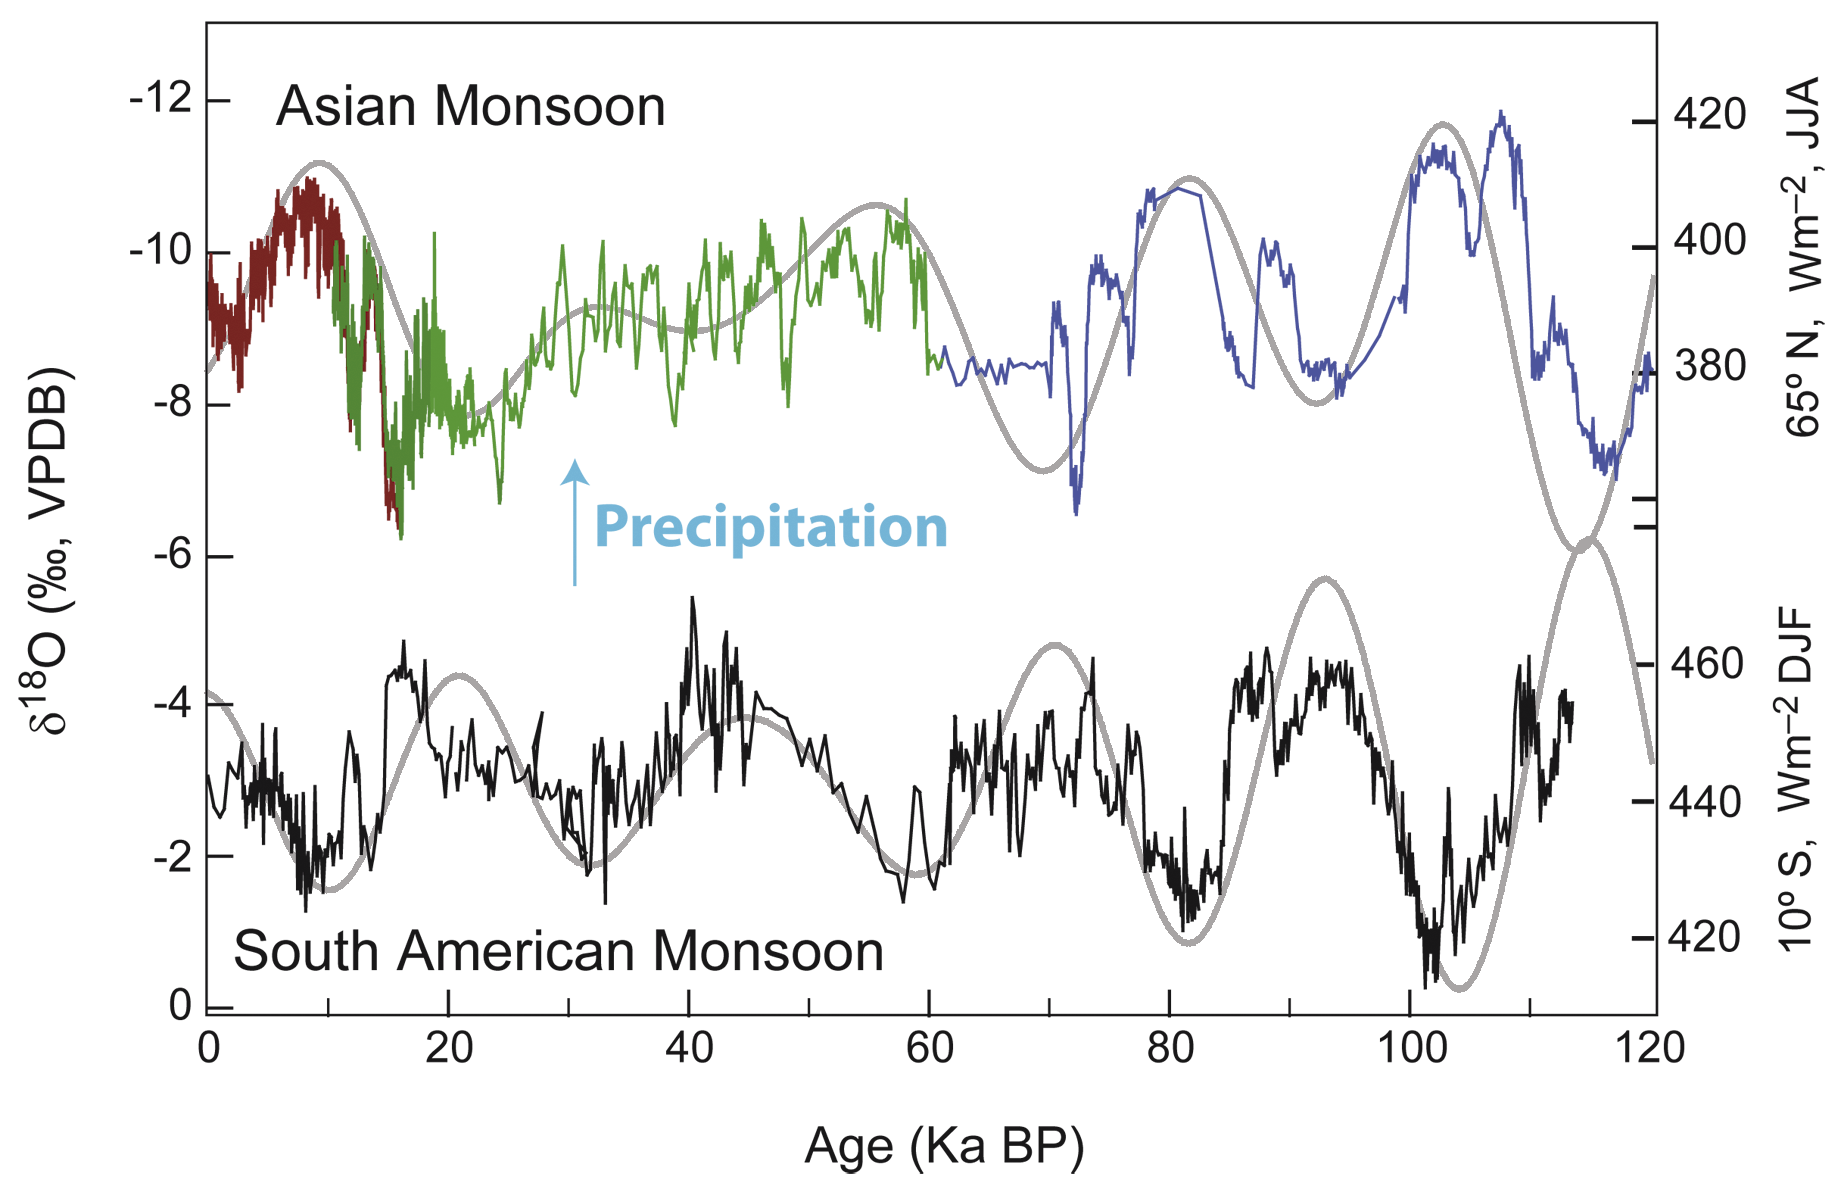
Figure 1: Interhemispheric comparison of changes in monsoon precipitation and summer insolation between eastern Asia and South America. Precipitation changes are reflected in δ18O records of speleothem calcite from Dongge cave (brown; Dykoski et al., 2005), Hulu cave (green; Wang et al., 2001), and Sanbao cave (blue; Wang et al., 2008) from eastern China, and from Botuverá cave in southern Brazil (black; Cruz et al., 2005). Insolation data are from (Berger, 1978). Figure courtesy of Hai Cheng. |
The Symposium covered the full range of timescales. Solar cycles, for example, were suggested to have direct and indirect effects on monsoon variations at multi-decadal and centennial timescales (J. Nott; W. Soon), while on centennial timescales the GM strength seems to respond more to the effective solar forcing (J. Liu). Monsoon records from Asia, Africa, and South America could be correlated globally (R. Tada; R. Schneider; F. Cruz; L. Peterson) and compiled oxygen isotope sequences of stalagmites from Asia and South America reveal anti-phasing on orbital, millennial and centennial timescales (H. Cheng; Fig. 1). This provides strong evidence that the GM is connected across hemispheres by the seasonal migration of the ITCZ in response to asymmetrical heat budgets. Global correlation of monsoon records enables us to indentify specific regional features, as demonstrated by the distinct response of the African and Indian monsoons to fresh water flux and ice-sheet forcing during the last glacial (P. Braconnot). On tectonic timescales, steepening of tropical zonal and meridional SST gradients was called upon to explain the aridification of Africa from 2.8-1.6 Ma (P. deMenocal), coherent with the above-mentioned monsoon-desert coupling.
Interesting discussions unfolded over monsoon proxies. The hydrogen isotope ratio of fossilized plant wax lipids from marine sediments was presented as an indicator of monsoon precipitation (R. Schneider). Several proxies were proposed to reflect the global monsoon intensity on longer timescales, including inorganic marine carbon isotopes (eccentricity cycles in ocean carbon reservoir), atmospheric methane concentration (tropical wetland extent) and oxygen isotopes of ice-trapped air (Dole effect). The similarity between oxygen isotope records from stalagmites and marine planktonic carbonate in monsoon regions provoked the question whether the oxygen isotope composition of the rainwater had fluctuated together with the GM intensity (P. Wang).
Extreme hydrological events were the final topic of the symposium. A variety of approaches, including sedimentological, geomorphological and isotopic, were introduced to study floods, droughts, and cyclones over the last millennia in Australia and India. Increases in flood frequency were found over the last century, suggesting coherence in the long-term history of the Australia-Asia Monsoon (V. Kale; E. Valentine and B. Wasson).
In summary, the symposium provided not just a global view of regional monsoons, but also a new perspective of the regional monsoons as part of a global system. Just as the high-latitude processes are centered around the poles, so are the low-latitudes processes, represented by monsoon and ENSO, centered at the climatic equator, i.e., the ITCZ. The GM responds directly to external forcing and is modulated by high latitude processes through teleconnections. The next step of the PAGES Global Monsoon Working Group will be a Special Issue of Climate Dynamics followed by a synthesis paper.
references
Morten B. Andersen and Mark Siddall
Department of Earth Sciences, University of Bristol, UK; mark.siddallbristol.ac.uk
3rd PALSEA Workshop, Bristol, UK, 20-24 September 2010
 |
|
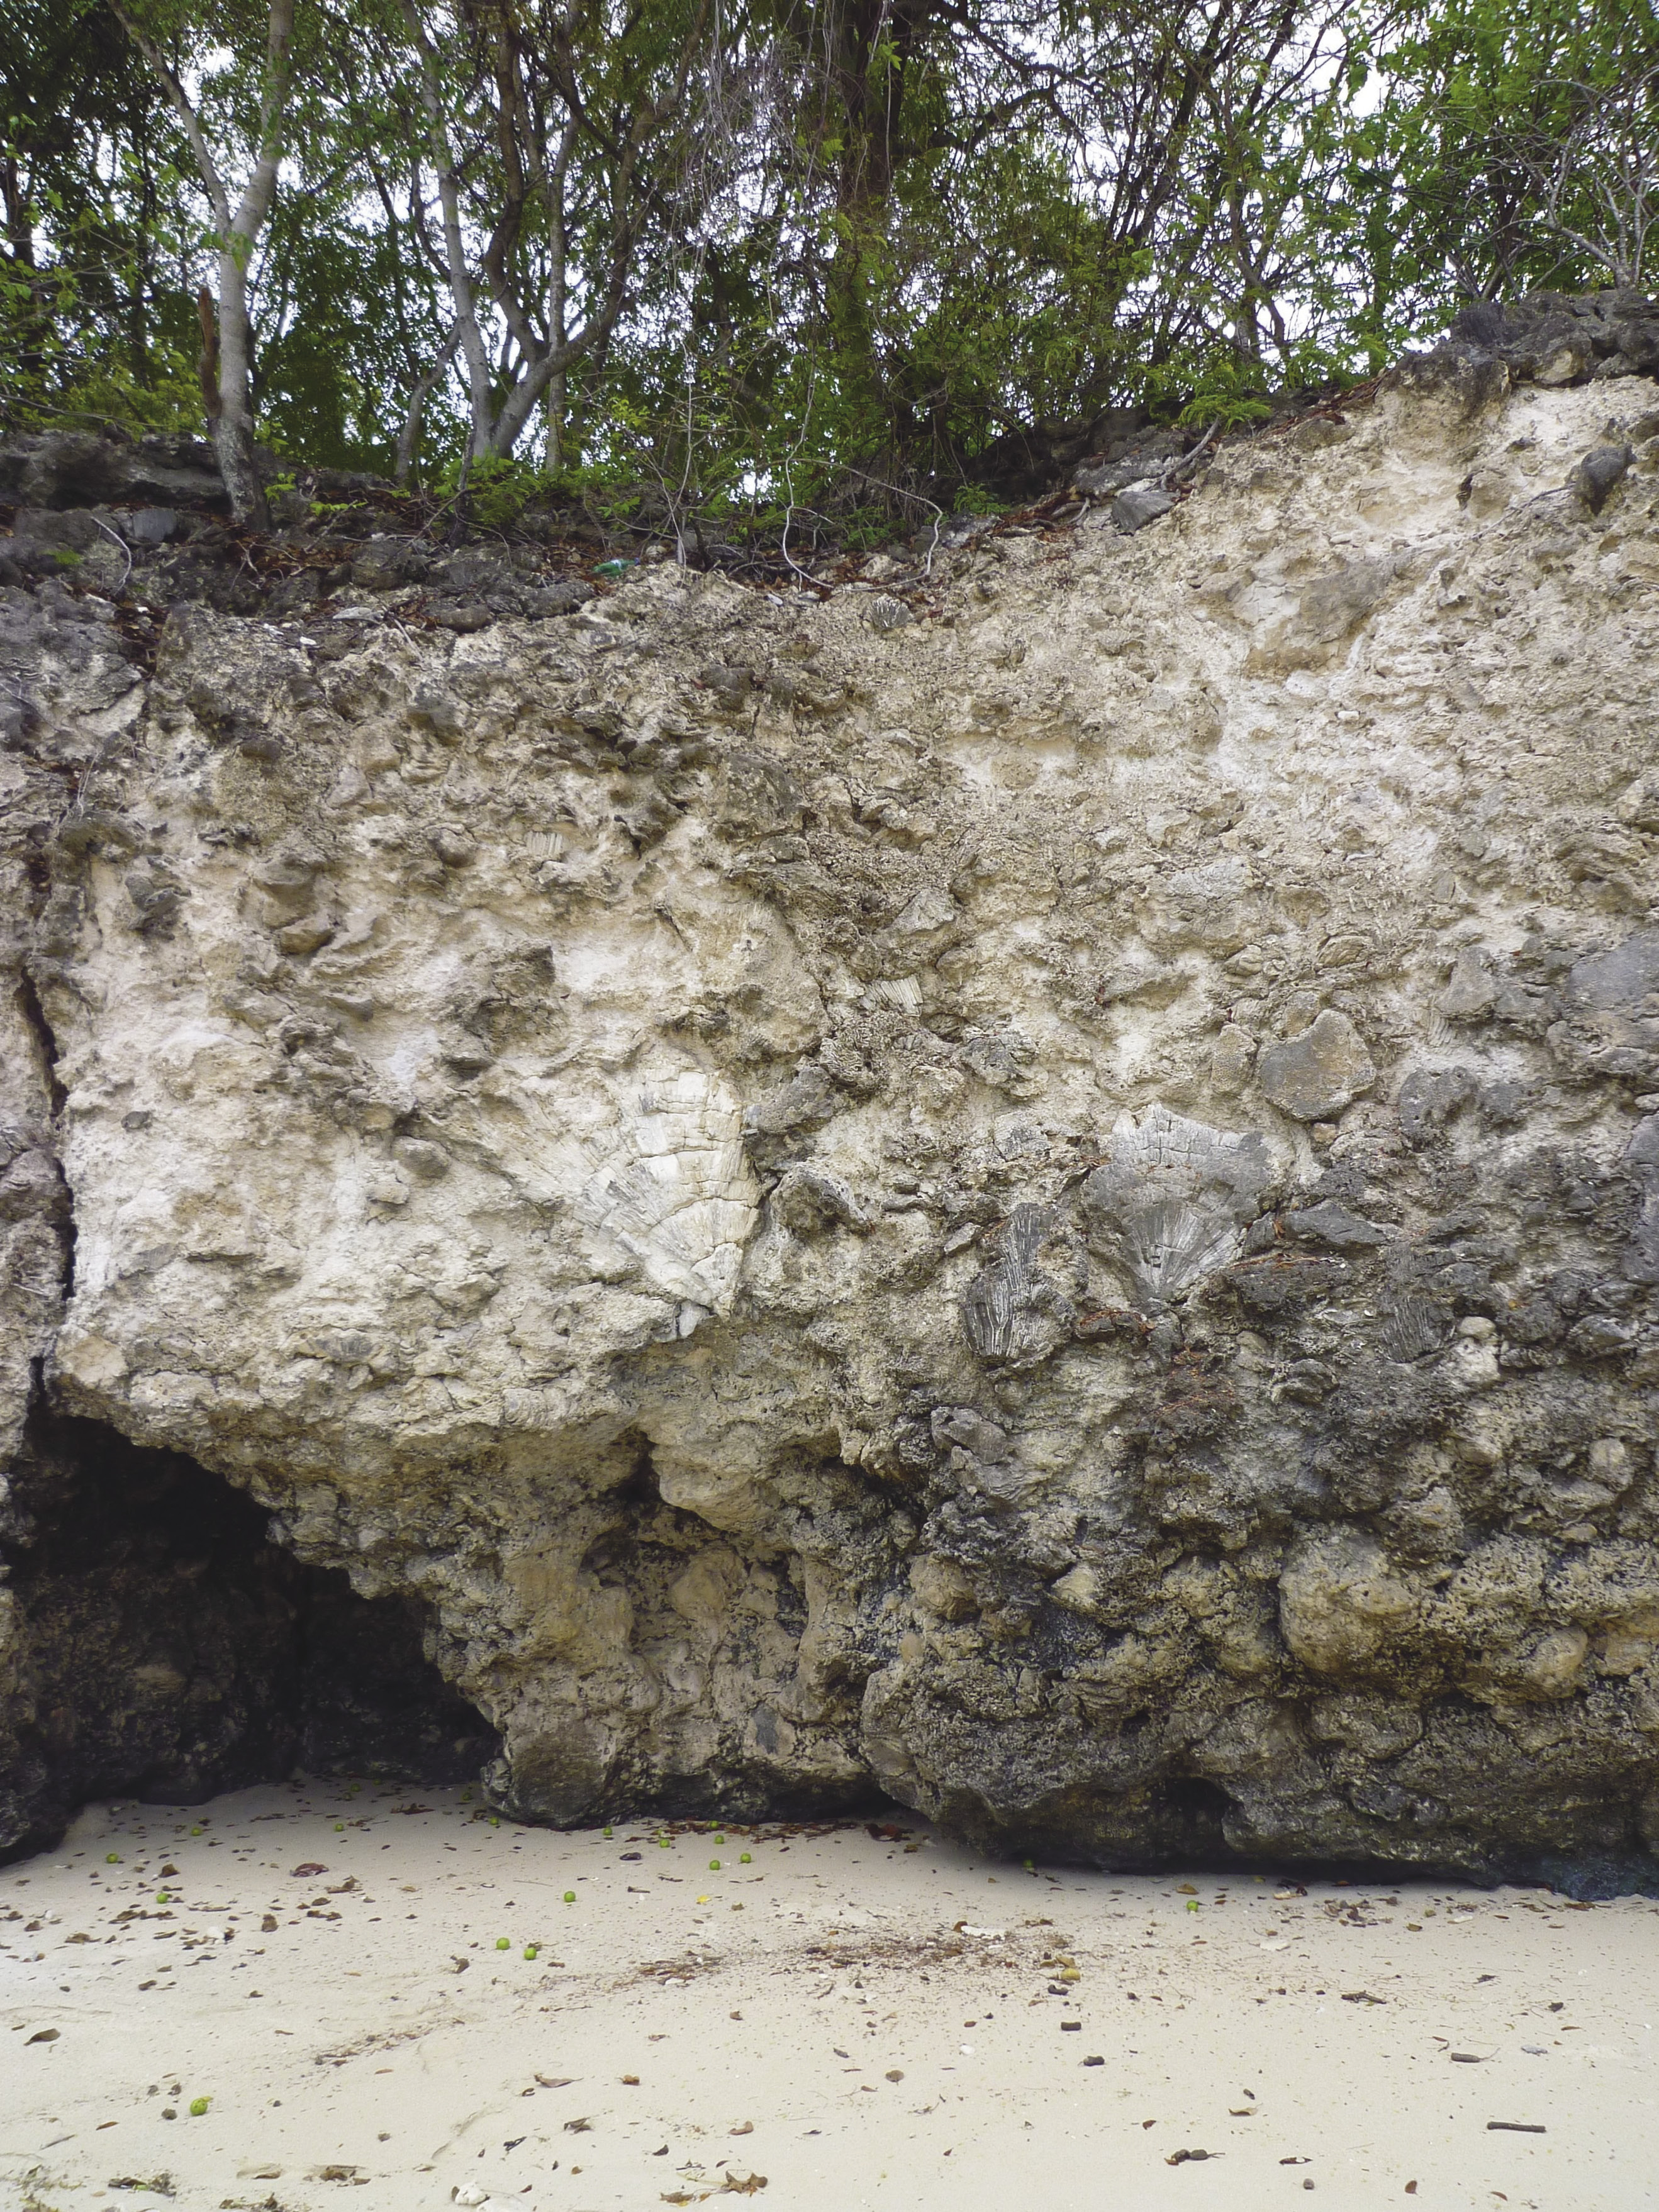
Figure 1: Fossil coral reefs, here from Barbados, are an important archive for reconstructing paleo sea level. Using fossil corals at different localities to reconstruct the deglacial sea-level rise during Termination I are key for determining melt water pulse events and the fingerprinting of sources of the ice-sheet melting (e.g., Antarctica vs. Northern Hemisphere). |
 |
|
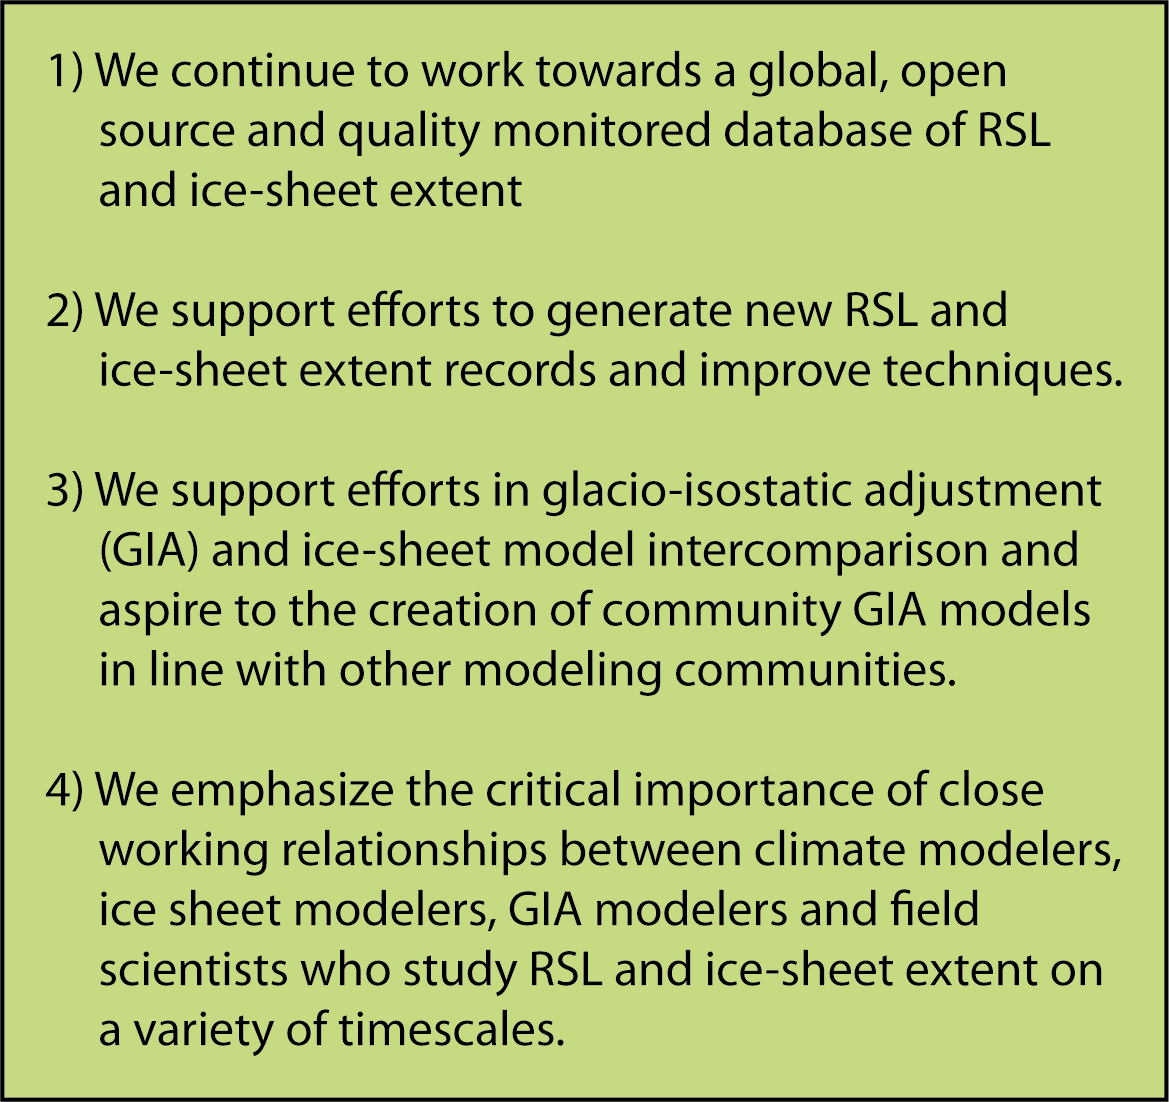
Table 1: 3rd PALSEA Workshop statements. These statements form the core framework for the continuing effort of the PALSEA workgroup. |
The joint PAGES-IMAGES Working Group “PALSEA” (Paleo-constraints on sea-level rise; www.climate.unibe.ch/~siddall/working_group.html) aims to obtain information on climate and sea-level change during the Quaternary period with a multi-disciplinary approach. A better understanding of the relationship between climate, ice-sheet dynamics and sea level is critical for projections of future sea level rise expected from global warming and cannot be achieved using the instrumental record alone. The 3rd PALSEA workshop Relative sea level, ice sheets and isostasy past, present and future (understanding the implications for human populations) was held at University of Bristol.
The workshop was internationally attended by 80 participators from a wide range of sea‐level related research areas including ice sheet and climate modelers, geophysicists with expertise in glacial‐isostatic adjustment, field scientists engaged in reconstruction of ice-sheet extent and relative sea levels, and marine archeologists. Support was provided by PAGES, IMAGES, the Worldwide Universities Network, UK-Integrated Ocean Drilling Program and the University of Bristol. Scientific presentations and discussions were organized into broad themes of: (1) Predicting future sea-level and ice-sheet evolution (2) Sea level and ice sheets during Termination I (3) Ice sheets: observation and modeling (4) Sea level and ice sheets entering and during warm periods (5) Sea levels and ice sheets during the Holocene (6) panel discussions focused on deliverables and future funding strategies.
Among the variety of topics discussed was sea level and ice-sheet evolution following Termination I, including comparisons of records of the last deglacial sea-level rise (e.g., from Sunda shelf and Tahiti corals) and meltwater pulse events (MWP). Specific attention was given to the character of the MWP 1b event, which was suggested to have been very small (if it existed at all) to be consistent with near field data. Ideally, a combination of existing and new observable data on MWPs, with well-defined error estimates, coupled with glacio-isotstatic adjustment (GIA) modeling would help to quantify MWPs more accurately, which is key to the understanding of ice-sheet extent and dynamics. For example, for MWP 1a, there is a discrepancy between glaciological data and glacio‐eustatic modeling on where the melt water was sourced (Antarctica, Northern Hemisphere or both). In order to address this problem, improved cross-disciplinary communication between data and model specialists is essential. Another important topic addressed was the stability of ice sheets during warm periods and in particular over the last 2000 years. Despite considerable attention, there remain many unanswered questions, particularly concerning sea level and ice-volume stability in relation to insolation forcing during warm periods. Research on ice-sheet stability during present and past warm climates will benefit our general understanding of ice-sheet dynamics of both the Antarctic and Greenland ice sheets. Improved sea level estimates for the Pliocene Warm Period (when ice sheets were greatly reduced), provides another way to address this issue and will be the focus of further research within the PLIOMAX project (Raymo et al., 2009).
Because the main focus points of the PALSEA Working Group is to tightly integrate the different communities working on research themes related to reconstruct past and predict future sea-level fluctuations, a set of key workshop statements was formulated (Table 1).
references
 |
Mark Besonen1, P. Francus2, A.E.K. Ojala3, R. Behl4 and B. Zolitschka5
1Texas A&M University-Corpus Christi, USA; mark.besonentamucc.edu
2National Institute of Scientific Research, Québec, Canada
3Geological Survey of Finland, Espoo
4California State University, Long Beach, USA
5University of Bremen, Germany
2nd workshop of the PAGES Varves Working Group, Corpus Christi, USA, 17-19 March 2011
Varved sediment records, i.e., sediment records that accumulate in discrete annual to sub-annual increments, archive an extremely rich variety of paleo information either via their simple physical sedimentology, or from the chemical, isotopic or biological proxies they may contain. Despite this richness, these records are only sparsely used in regional and global climate reconstructions, which tend to favor other annually resolved records such as tree rings. Against this backdrop, and a decade long gap without any large meeting of the varve community, the PAGES Varves Working Group (VWG) was established in 2010. The VWG held a productive first workshop in Tallinn, Estonia in April 2010 that focused on reviewing methodological advances in varved sediment studies over the last decade (Francus et al., 2010; Ojala and Kosonen, 2010). In order to expand the reach of the VWG, recognition by INQUA was recently petitioned, and the VWG was granted project status as “INQUA Project Number 1102—VWG Project”.
A second workshop was held in March 2011 on the campus of Texas A&M University-Corpus Christi, USA. A scientific program and abstract volume is posted on the project’s website www.pages-igbp.org/workinggroups/varves-wg/. This second workshop focused on the development of more robust varve chronologies based on what could be learned from the communities that work with other non-sedimentary annually resolved climate archives. It was attended by 31 scientists from institutions in 10 different countries. Early career scientists, such as graduate students, post-docs and new faculty, accounted for nearly half of the participants (14 of the 31); thus, the workshop provided a great opportunity for knowledge transfer from more experienced varve researchers to young academics.
 |
|
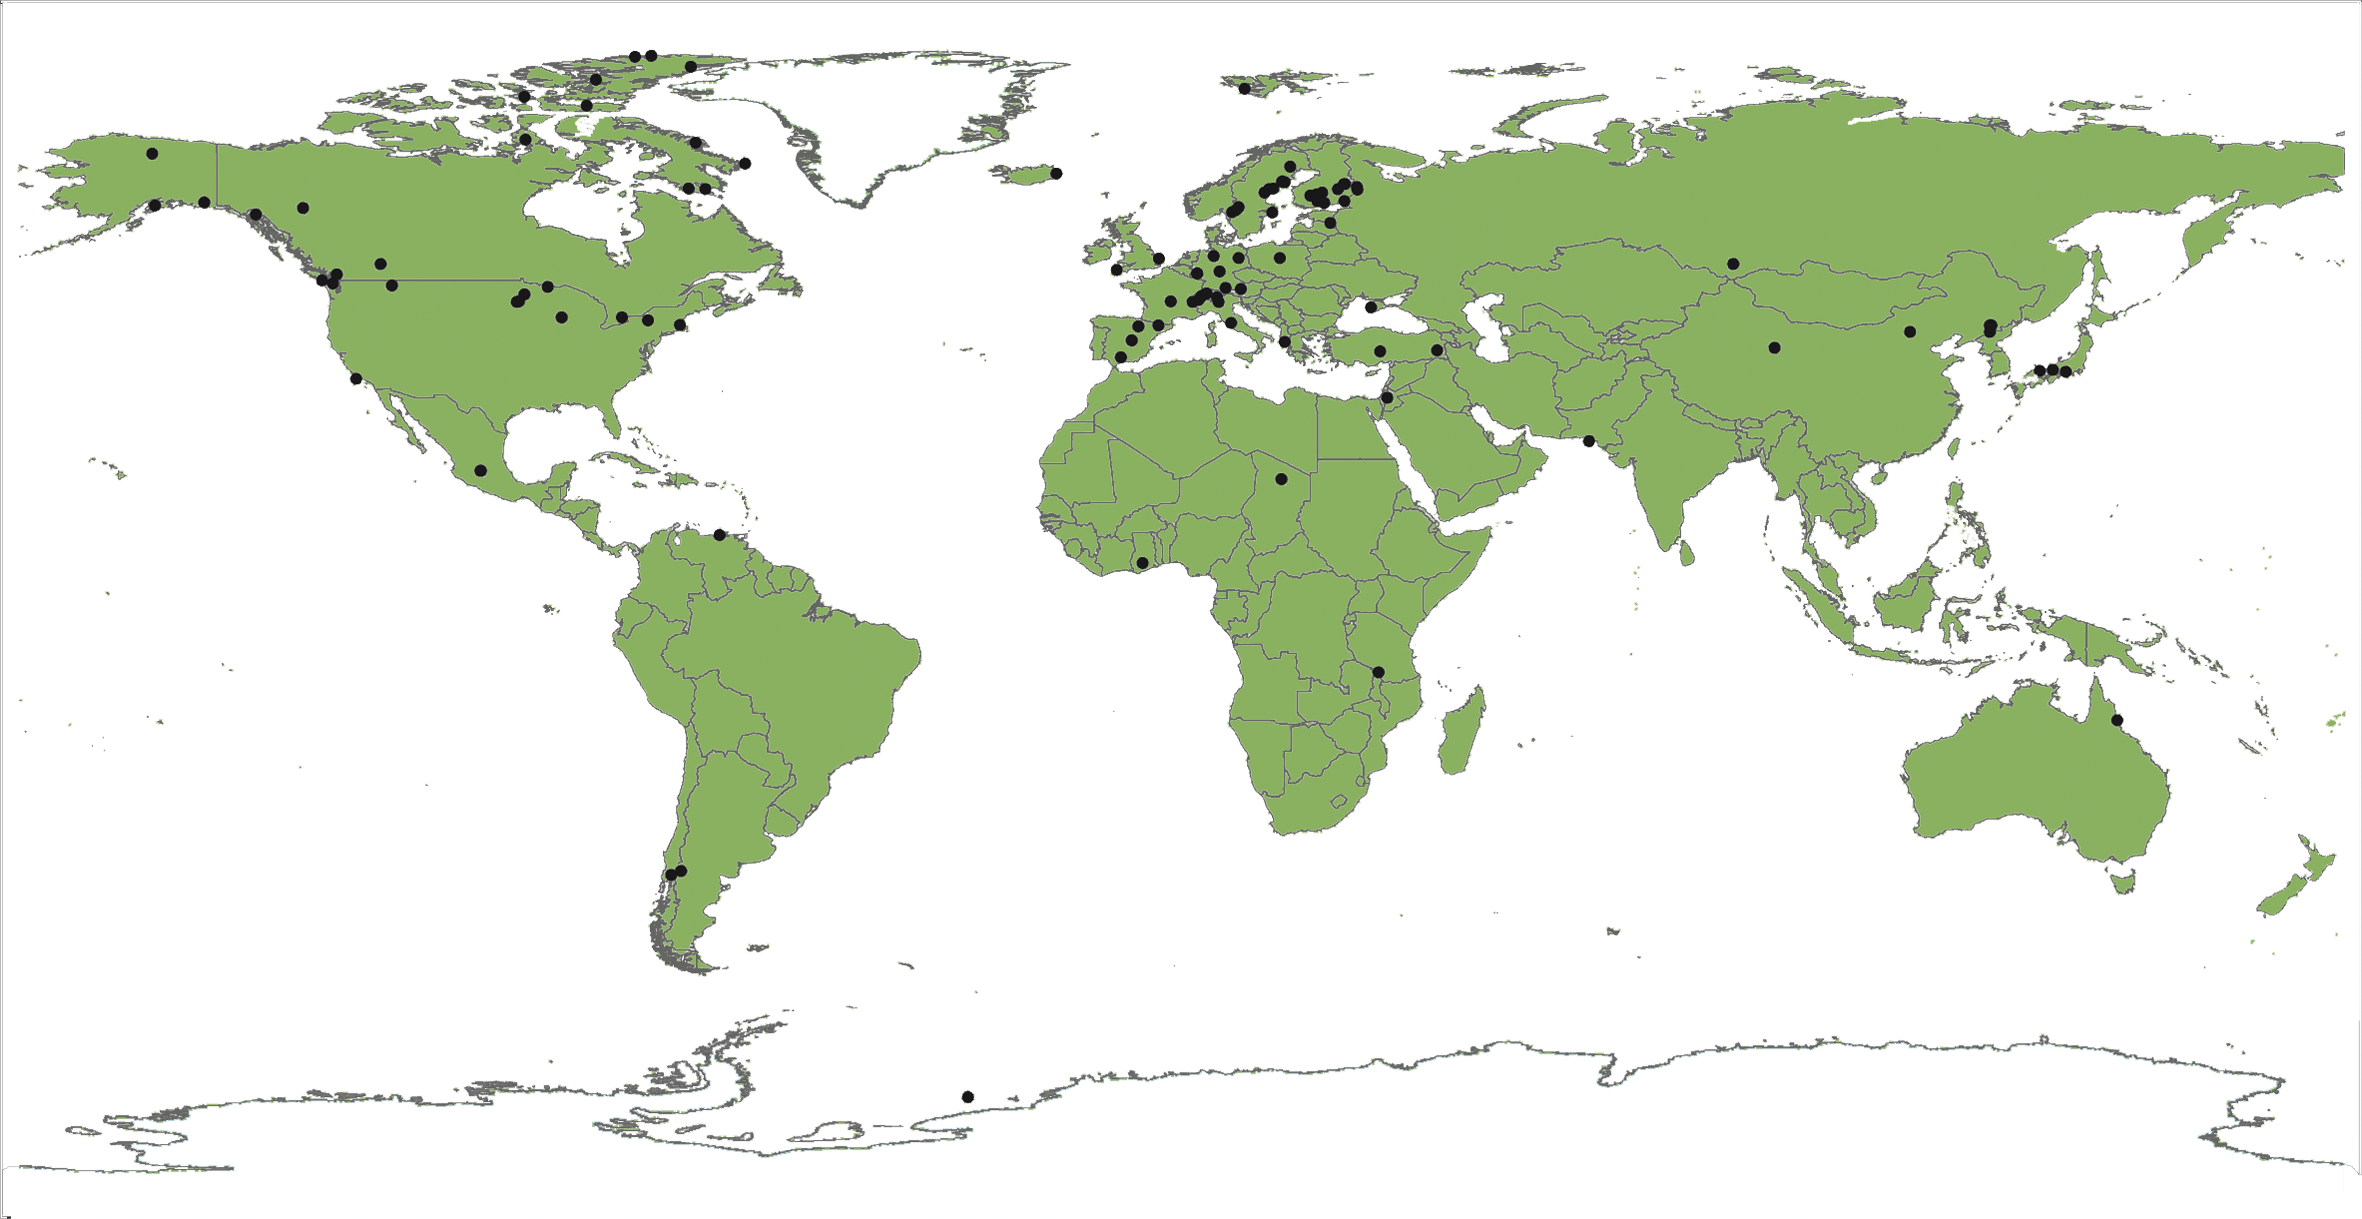
Figure 1: Distribution map of published varved sedimentary records with chronology lengths of at least 100 years. Figure from Ojala et al., in preparation. |
The three-day workshop began with a review of sediment varve chronologies (a task that will form the basis of one of the deliverables of the VWG), specifically, an up-to-date metadatabase and inventory of published varved records (Fig. 1). This exercise allowed the group to better identify gaps in reporting methodologies used to establish age-models for varved records, and thus, areas for improvement.
Keynote addresses were delivered by experts from the tree ring, ice core, coral and speleothem communities. By learning from other communities tools and methodologies, the goal was to address perceived or actual weaknesses in varve chronologies and dating (Jansen et al., 2007), that may, in part, be responsible for the sparse usage of varved records in climate reconstructions. Each of the keynote addresses was followed by an active group discussion about how “best-practice” techniques in these adjacent fields could be applied and adapted to varved sediment records. Presentations by the participants were organized thematically and interspersed with the four keynote addresses.
Several plenary discussion sessions were undertaken on the last day of the workshop to address practical issues, such as how to structure the metadatabase of known varved records, and to provide recommendations for the publication of varved records including the publication of raw data, a full set of images of the entire record, and error estimates. Moreover, it was decided to implement a database of papers dealing with varved sediments, and a metadatabase of varved records on the PAGES website. It was also agreed to produce two group publications, one on protocols and a review about the fidelity of sediment varve chronologies.
A third workshop of the VWG will be held in the Eifel region of Germany, 21-23 March, 2012, focusing mainly on the calibration of varved records for climate reconstructions.
acknowledgements
The organizers wish to thank PAGES, INQUA, and the U.S. NSF (EAR-SGP and OCE-MGG Programs) for the generous financial support that made this workshop possible. Support by staff at Texas A&M University—Corpus Christi was also critical for the success of this workshop, and that support was greatly appreciated.
references
Jansen, E., et al., 2007: Palaeoclimate. In: Solomon, S., et al., (Eds.), Climate Change 2007: The Physical Science Basis. Contribution of Working Group I to the Fourth Assessment Report of the Intergovernmental Panel on Climate Change, Cambridge University Press, Cambridge, United Kingdom and New York, NY, USA.
Ojala, A.E.K. and Kosonen, E. (Eds.), 2010: Programme and Abstracts: First workshop of the PAGES Varves Working Group, April 7-9, 2010, Palmse, Estonia, 130 p
Anupama Krishnamurthy1 and Marie-José Gaillard2
1Laboratory of Palynology, French Institute of Pondicherry, Puducherry, India; anupama.kifpindia.org
2School of Natural Sciences, Linnaeus University, Kalmar, Sweden
IGBP PAGES PHAROS Workshop, Puducherry, India, 27-29 January 2011
This workshop, supported by PAGES and organized under the umbrella of the Golden Jubilee of the Laboratory of Palynology, French Institute of Pondicherry (IFP), was attended by over fifty participants from India and abroad (Sri Lanka, Australia, Sweden, Estonia and France). There was a good mix of participants from different fields (Earth science, ecology, paleoecology, history and archeology) with adequate representation of data producers and modelers. Compiled abstracts of talks, posters and presentations are available at the IFP website (see URL's in supplementary material www.pages-igbp.org/products/newlsetters/ref2011_2.html).
The need for quantifying land cover and land use, and reconstructing climate change in the tropics is well known. Very little has emerged so far in terms of a multidisciplinary synthesis, although much work has been done over the years in South Asia, specifically in the Indian subcontinent. To address this gap and initiate such synthesis, with India and Sri Lanka as a starting point, the workshop aimed to:
i) Bring together paleoecologists, archeologists, historians and ecologists in order to provide a multidisciplinary background
ii) Introduce the novel methodologies applied today to reconstruct past land cover from pollen data in Europe (the
NordForsk POLLANDCAL and LANDCLIM networks, e.g., Gaillard et al., 2008, 2010) to the Indian scientific community
iii) Achieve a synthesis of relevant historical and archeological data.
 |
|
Figure 1: Although there are very few natural lakes in peninsular India, there is an abundance of water reservoirs with artificial levees commonly referred to as “tanks”, dotting the landscape of south India (Gunnell and Anupama, 2003). Several thousand tanks cover the south Indian landscape and offer the best potential for pollen-vegetation modeling in this region, of which Potapuram cheruvu (A) is an example. A late Holocene pollen diagram from a core in this tank (B; Anupama et al., 2008) illustrates human impact on the landscape (red) as interpreted from markers such as Xanthium (a weed) and Casuarina (common plantation tree) and other plantation trees occurring in tandem but in small proportions (Eucalyptus, Cocos, Tamarindus and Tectona). Significant among the deciduous forest catchment’s markers (dark green) are Melastomataceae/Combretaceae, Haldina, Hardwickia, and Lannea. |
After introductory talks on PAGES Focus 4 (Past Human-Climate-Ecosystem Interactions), the LANDCLIM project in Europe and Sugita’s Landscape Reconstruction Algorithm (LRA) (Sugita, 2007 a, b), lectures focused on Holocene time chronologies and vegetation history, modern forest ecosystems and the history of human settlements, providing an overview of the Peninsular India background. This was followed by a session on models and methods in pollen-based Holocene vegetation and land-cover reconstruction. Both theoretical and practical aspects were explained, emphasizing the need for pollen productivity estimates. This session concluded with a presentation on the first quantitative pollen-inferred Holocene land-cover in northwest Europe achieved within the Swedish LANDCLIM project (Gaillard et al., 2010). Lectures on the second day included an introduction to dynamic vegetation models, tools for spatial analyses, and studies in other regions (tropical Africa and Australasia). The third day comprised of invited talks on the dry evergreen forests of southern India and on the online Historical Atlas of south India (http://www.ifpindia.org/hatlas/). Palynological and multiple proxy studies in southern India, Sri Lanka and Borneo were presented during several lecture and poster sessions (Fig. 1).
As a concrete result of the workshop, three geographical regions of focus on the Indian subcontinent and their respective regional coordinators were identified, (1) Western Himalayas, (2) Eastern Himalayas, and (3) Peninsular India with Sri Lanka. These regions will each move forward in developing the following research themes (with their respective thematic coordinators):
A) Indian pollen database (to be housed at the IFP) and application of the biomization approach.
B) Pollen productivity estimates and landscape reconstruction algorithm application.
C) Archeology and paleoecology (syntheses and databases). Given the diversity of Indian archeology, an investigation into the long-term trends in the environmental context of human adaptation is essential. Starting with collecting all available, environmental proxies from archeological and historical contexts, the plan is to select sites/areas to carry out new case studies with standardized methods to answer specific questions through the establishment of multi-disciplinary research groups.
For the names of regional and thematic coordinators, please see the supplementary material (http://www.pages-igbp.org/products/newsletters/ref2011_2.pdf) or contact the first author of this report. The research stemming from the above mentioned aims will contribute to the PAGES Focus 4 PHAROS themes of Regional Integration and Land-cover and Use.
A post-workshop excursion to a 30 year afforestation effort of the Sri Aurobindo International Centre of Education, aptly illustrated land-cover changes and positive aspects of human intervention through restoration ecology.
references
For full references please consult: http://pastglobalchanges.org/products/newsletters/ref2011_2.pdf
Rik Tjallingii1, Y. Hamann2, D. Garbe-Schönberg3, G. Jan Weltje4, U. Röhl5 and workshop participants
1NIOZ-Royal Netherlands Institute for Sea Research, Texel, The Netherlands; Rik.Tjallingiinioz.nl
2Geological Institute, ETH, Zürich, Switzerland
3Institute of Geosciences, CAU University of Kiel, Germany
4Department of Geotechnology, Delft University of Technology, The Netherlands
5MARUM-Center for Marine Environmental Sciences, University of Bremen, Germany
Texel, The Netherlands, 8-10 September 2010
Over the last decade, X-ray fluorescence (XRF) core scanning has become an estab-lished method for non-destructive and fast acquisition of sediment compositions (i.e., element count rates) directly at the surface of split cores. State-of-the-art core scanners can measure element intensities at sub-millimeter resolution that allow detailed recording of compositional variations in finely laminated and even varved sediments. Core-scanning data are widely applied to paleoceanographic and paleoclimate reconstructions on timescales ranging from seasonal to millions of years. New developments in data processing and calibration techniques have increased the need to exchange experiences among users at various laboratories equipped with an XRF core-scanner. Therefore, a three-day workshop was held at the Royal Netherlands Institute for Sea Research to discuss technical aspects and application challenges of XRF core scanning, in particular Avaatech scanners, in the wider field of paleoceanography.
On the first day of the workshop, leading researchers and laboratories gave an overview on applications of geochemistry to scientific problems and on the quality of geochemical data generated by XRF core scanning. The quality of XRF core-scanner data is commonly evaluated by comparing core-scanner records with destructive analyses of discrete samples (e.g., Inductively Coupled Plasma (ICP)-Optical Emission Spectroscopy or ICP-Mass Spectroscopy). Geochemical data are closed-sum data that are intrinsically correlated and cannot be directly quantified on an element-by-element basis. Geochemical data are therefore often represented as element ratios in order to interpret down-core composition variations in terms of changes in climate and environment, sediment transport mechanisms, or diagenetic conditions. Additionally, element intensities from XRF scanners are not solely related to element concentrations, but are also affected by down-core variations of physical sediment properties (size distribution, density, water content), as well as absorption and enhancement effects, and measurement geometry. It was shown that the log-ratio representation of XRF count rates and concentrations allows effective minimization of the noise caused by these down-core variations, and allows enhancement of the signal-to-noise ratio by means of appropriate multivariate filtering techniques. Log-ratio calibration permits rigorous quantification of the precision of XRF core-scanner data based on replicate measurements, which paves the way to fully quantitative applications of XRF core scanning.
 |
|
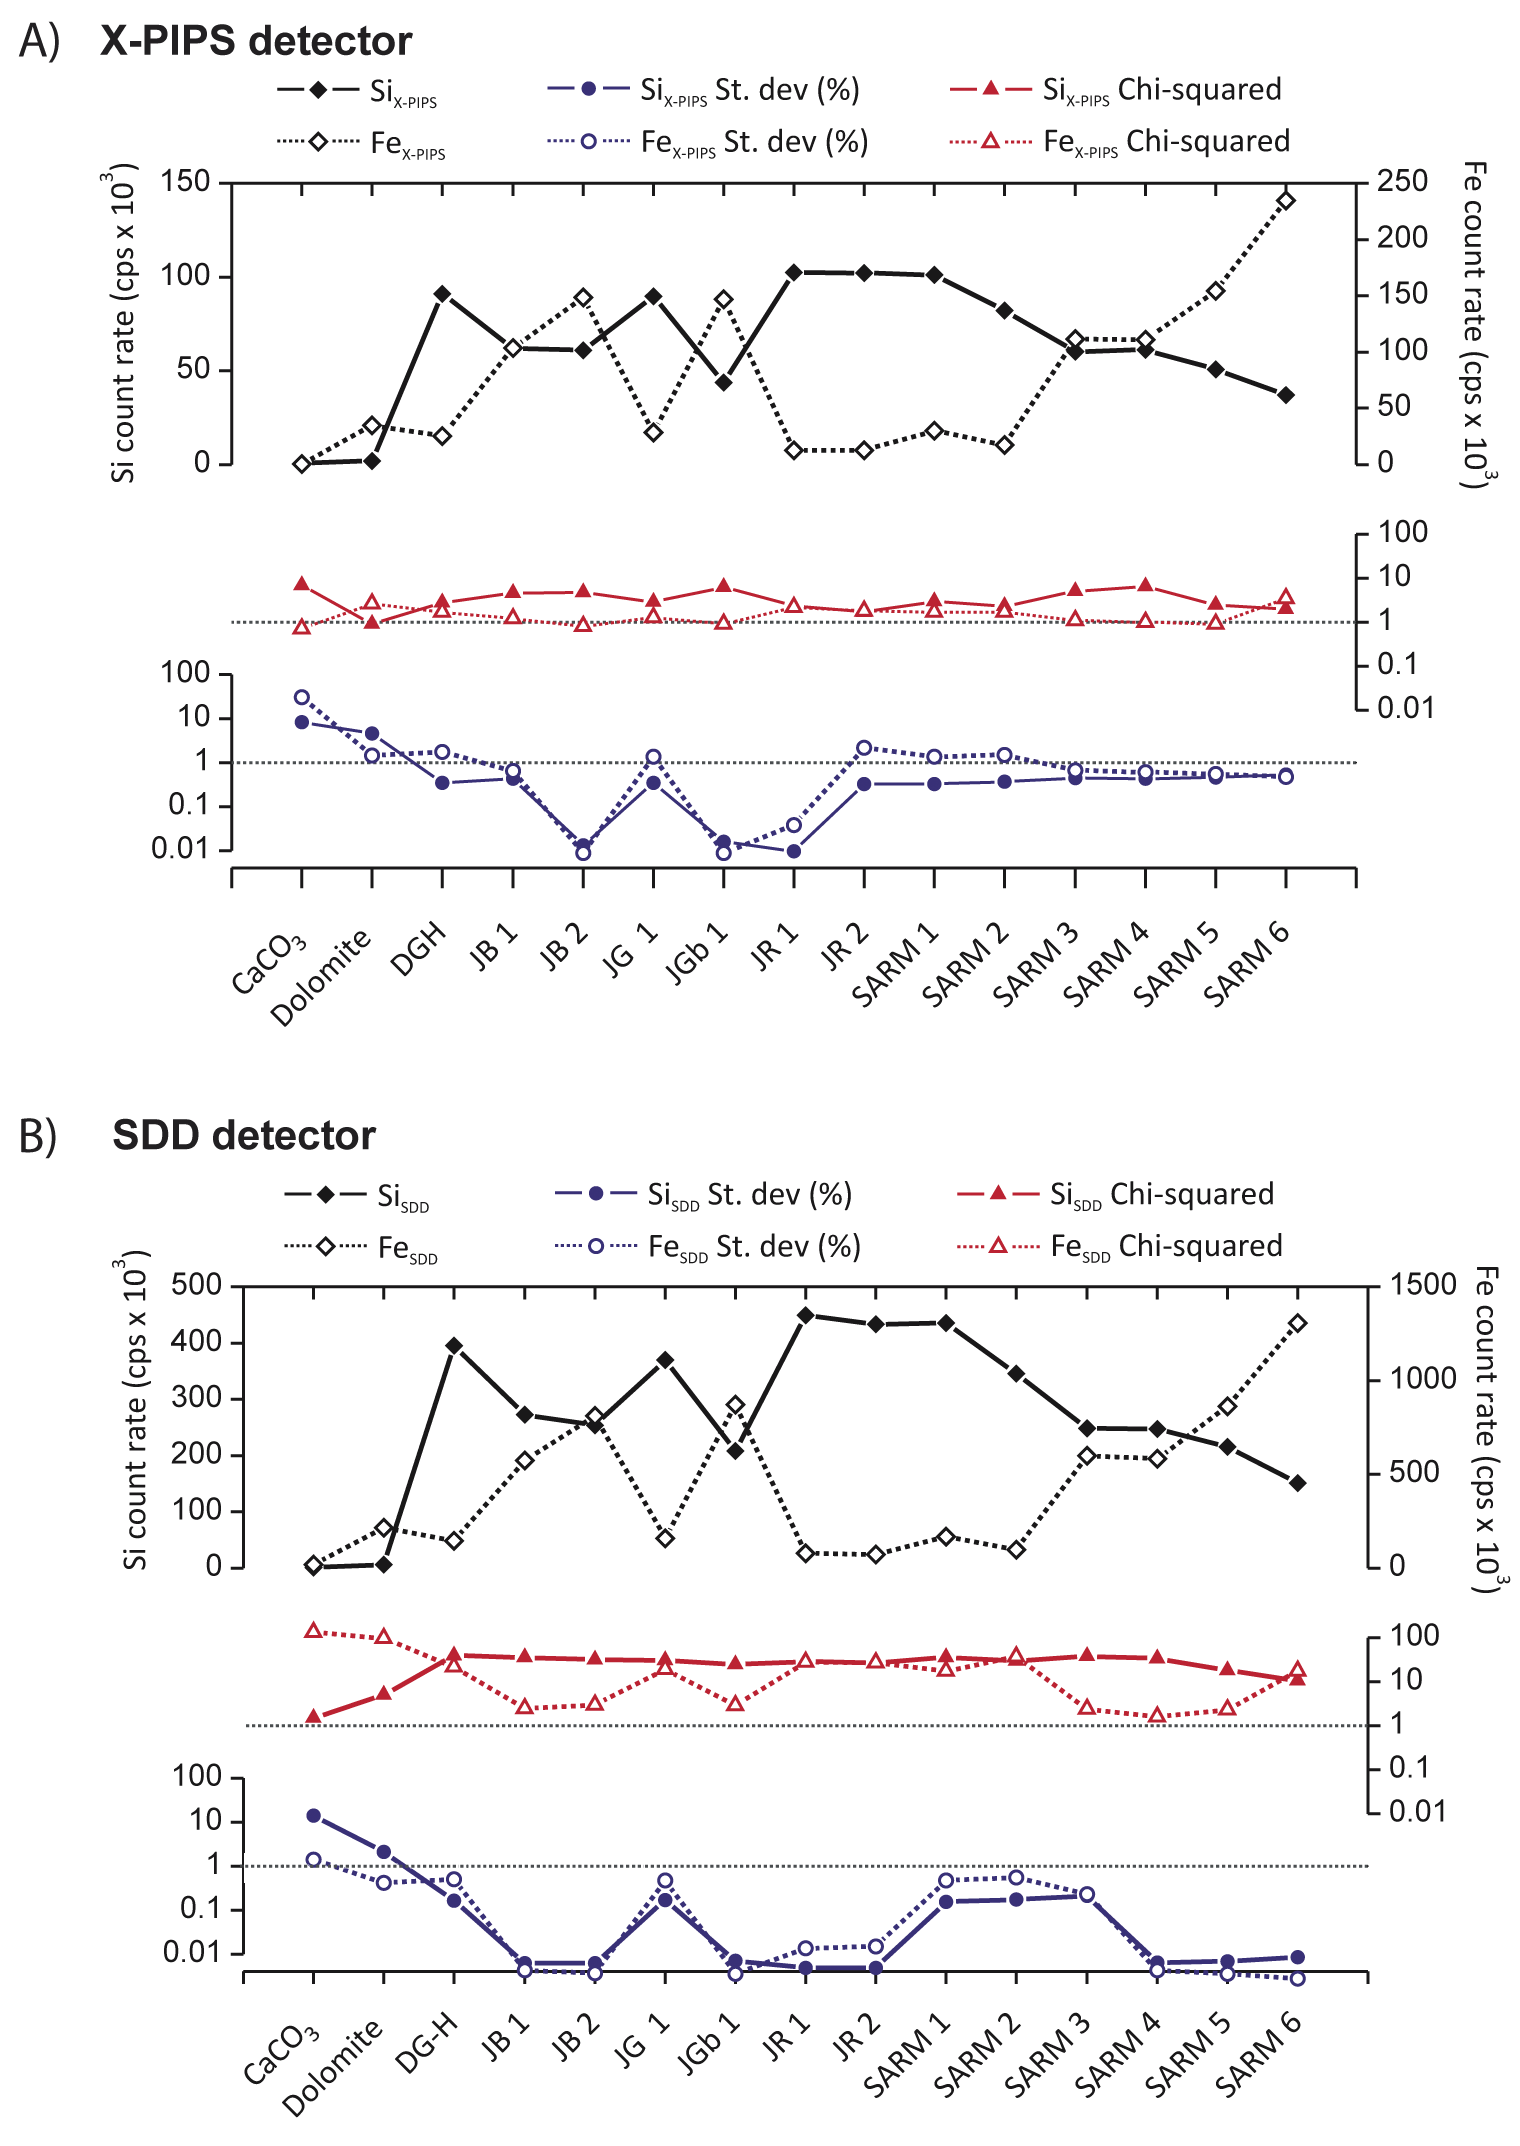
Figure 1: Comparing count rates and goodness-of-fit statistics of element silicon (Si) and iron (Fe) measured on certified geochemical reference standards (x-axis; e.g., http://georem.mpch-mainz.gwdg.de/) with an Avaatech core scanner equipped with A) a pin-diode detector (X-PIPS) and B) a silicon-drift detector (SDD). The newly developed SDD detector increases the count rate (black) but also chi-square statistics (red) for Si and Fe due to higher sensitivity of this detector. The relative standard deviation (blue) decreases indicating better signal-to-noise conditions for measurements acquired with the SDD detector. The relative standard deviation is calculated as D-Area/Element-Area. For practical reasons the chi-square and relative standard deviation are plotted on a logarithmic scale. |
The second day was dedicated to the discussion of the mathematical transformation of XRF spectra into elemental count rates by least-squares fitting of the characteristic X-ray peaks. Practical problems concerning data processing and goodness-of-fit parameters (e.g., chi-squared χ2) were presented by members of the MARUM XRF core scanner laboratory of the University of Bremen, Germany. Many technical issues were discussed in a lively debate between XRF core-scanner users, specialists in XRF acquisition, and specialists in XRF spectrum evaluation. One of the key points in this discussion was that the increased efficiency of recently developed digital XRF detectors significantly reduces measurement times and increases the signal-to-noise ratio. However, this increased sensitivity of digital detectors also brings out the complexity of XRF spectra, which may result in strongly increased c2 statistics suggesting a poor spectrum fit. A suitable alternative approach to the use of c2 statistics is to express the goodness-of-fit in terms of relative errors (i.e., the standard deviation as a proportion of the element intensity; Fig. 1). As a rule of thumb, elements displaying negative count rates or relative errors in excess of 10% are considered to be below the detection limit.
The third day was devoted to complementary non-destructive scanning tools, which are optional for the latest scanners (e.g., visible-light and UV digital line-scan cameras, magnetic susceptibility sensors, radiograph imagery), and their applications to sediment and coral-core analysis. In addition, laser-ablation ICP-spectroscopy was presented as a complementary destructive chemical technique. In a final discussion, the workshop participants expressed the need for an electronic information platform to share practical experience on sample preparation, measurement techniques, data processing, technical solutions and preventive maintenance.
The next international workshop on XRF sediment core scanning will be held in two years time. More information about current developments concerning the electronic information platform and the workshop, including some of the presentations, is available at: www.nioz.nl/xrfworkshop
New PAGES website
PAGES has launched a new version of the website in keeping with the latest trends in website design. During this transition period some web pages and databases may be temporarily unavailable or outdated. We apologize for any inconvenience caused. The new website provides a “My PAGES” section, which is designed to serve as a “one-stop shop” to access PAGES offerings and get involved in PAGES activities.
Staff update
The PAGES Office has seen a lot of staff movement lately due to back-to-back good news; Louise gave birth to a son and Michelle is expecting a child in the coming days! Lucien von Gunten replaces Louise Newman as PAGES Science Officer for the duration of her maternity leave until May 2011. Lucien, a paleoclimatologist working on South American lake sediments, is taking care of the 2k Working Groups and newsletter editing. Christoph Kull, a glaciologist and former PAGES Science Officer, has been roped in to bolster production of newsletters. For the time of her maternity leave, Michelle Kaufmann, the PAGES Finance and Officer Manager, has been replaced by Therese Jost. We congratulate Louise on the birth of her son and welcome Lucien, Christoph and Therese to the PAGES office. We also look forward to welcoming another PAGES baby soon!
PAGES OSM/YSM 2013: an update
In 2010, PAGES invited applications from groups interested in hosting the 4th PAGES Open Science Meeting (OSM) and 2 Young Scientists Meeting (YSM) in 2013. We received 10 exciting bids from 5 different continents and are delighted with this exuberant interest in hosting the events. Bids from Australia, India and Germany have been shortlisted and await a final decision after additional scrutiny.
New PAGES committee members
Heinz Wanner, former Scientific Steering Committee (SSC) co-chair, rotated off the committee after six years of dedicated service but shall continue his association with PAGES as coordinator of the Regional 2k Network.
Two new members have joined the PAGES SSC in 2011:
 |
Hubertus Fischer, Professor of Experimental Climate Physics at the University of Bern, Switzerland is the new SSC Swiss co-chair alongside the US co-chair Bette Otto-Bliesner. Hubertus is an ice core scientist with broad interests in Quaternary changes in climate and biogeochemical cycles. He is active in the PAGES Working Groups Antarctica2k and ADOM.
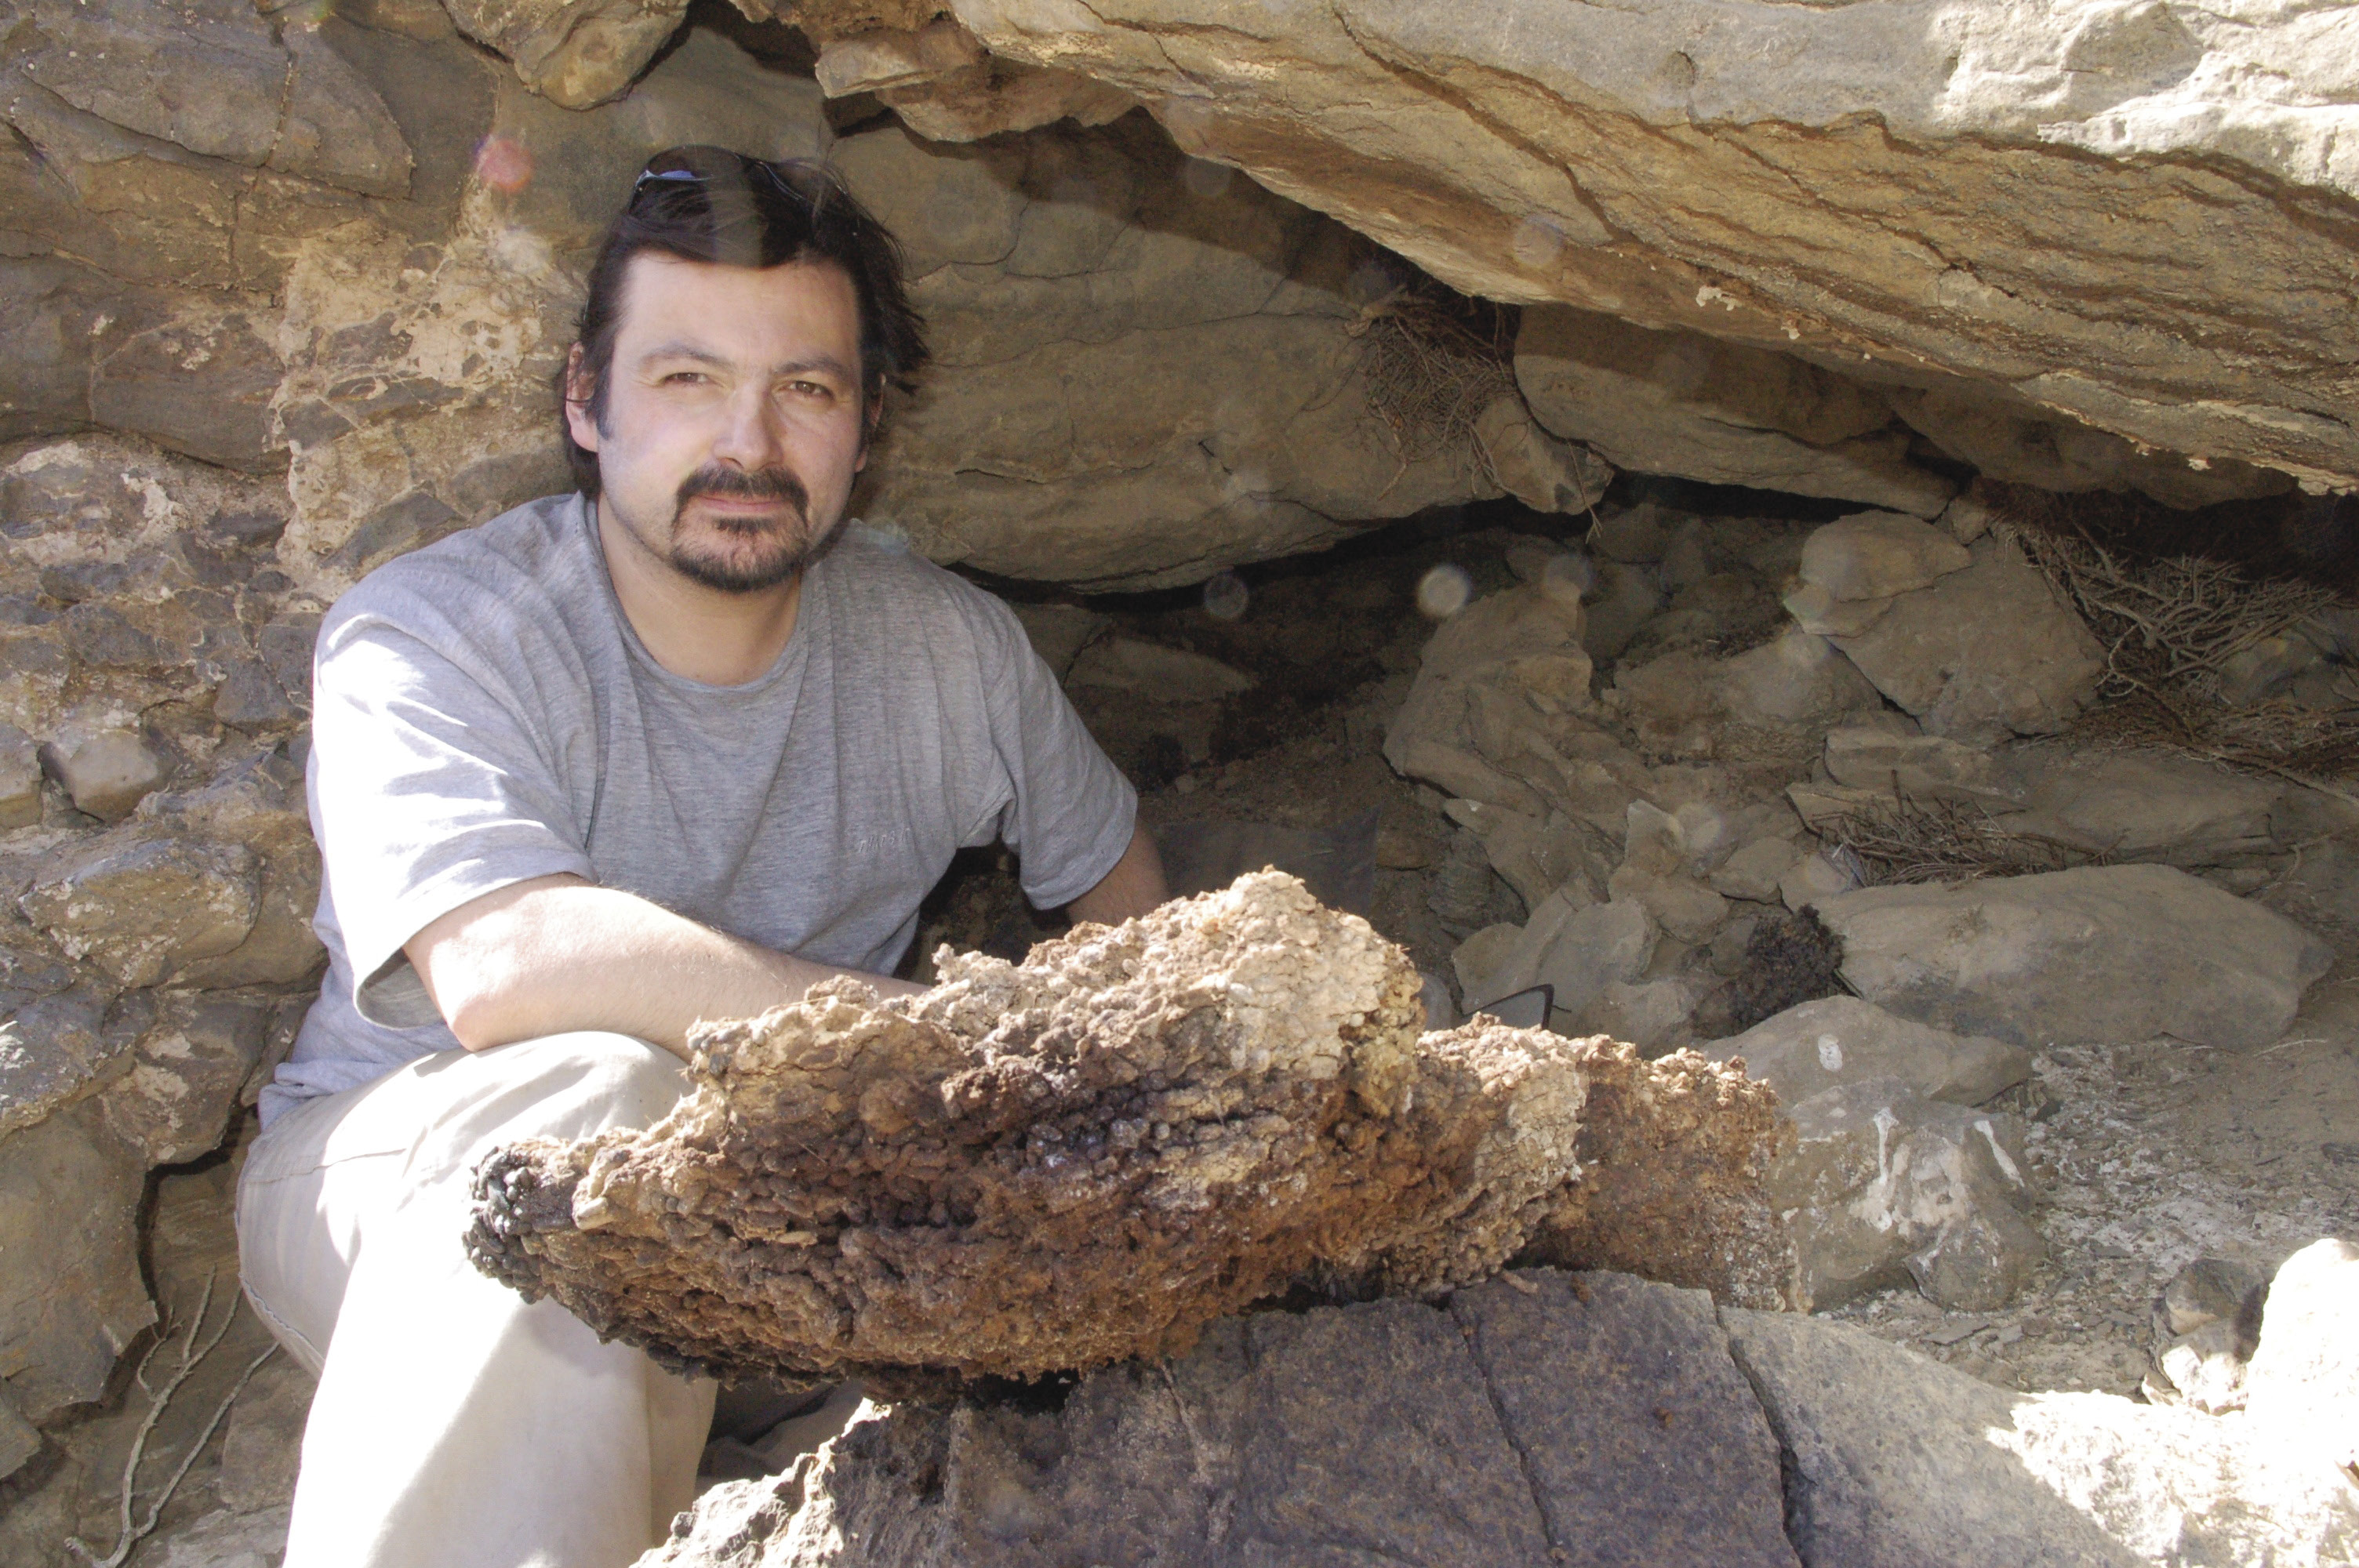 |
Claudio Latorre is an Associate Professor in the Department of Ecology at the Pontificial Catholic University of Chile in Santiago. His research interests include paleoecology and paleoclimatology of arid regions. For over a decade, he has been using rodent middens from the Atacama Desert to learn about the desert’s hydrological cycle over the last 40-50 ka. Claudio Latorre also specializes in plant macrofossil analyses and the applications of stable isotopes in these environments. His appointment to the SSC will strengthen and stimulate PAGES Focus 4.
Nominations for the PAGES SSC
PAGES invites nominations for new SSC members for 2012. Bette Otto-Bliesner (USA), Cathy Whitlock (USA) and Mohammed Umer (Ethiopia) will be rotating off the SSC at the end of 2011. The SSC provides overall guidance for PAGES and oversees major scientific activities. Members are chosen on the basis of their scientific excellence and their potential to promote PAGES science and activities. PAGES particularly encourages the nomination of women and scientists from underrepresented regions. The nomination deadline is 30 June 2011. A list of current SSC members and nomination details can be found on the PAGES website (My PAGES>Get involved).
PAGES support for meetings
PAGES Executive Committee (EXCOM) discussed the workshop proposals submitted to the second call in 2010. A total of 13 meetings were awarded financial support. PAGES Working Groups that were allocated workshop support include PALSEA (Sea-Level), LUCIFS (Fluvial Systems), NICOPP (Marine Nitrogen Cycle), Varves, PAGES-CLIVAR Intersection, and the Australasian, Antarctic and North American groups of the Regional 2k Network, as well as a workshop for the entire 2k Network.
In addition, three proposals for general workshops relevant to PAGES science were approved. These include an interdisciplinary workshop on constraining estimates of future climate variability from geological records, a workshop on Greenland Ice Sheet reconstruction, and a regional paleoscience workshop focused on the Balkan and Carpathian region and community. An educational workshop on marine diatoms was also supported.
More information on funded workshops is available on the PAGES website (Meetings>PAGES supported). The next deadline for proposals is 15 June 2011 for evaluation by EXCOM in late July (online proposal submission under My PAGES).
Planet Under Pressure Conference 2012
An open international Planet Under Pressure conference will be held on 26-29 March 2012 in London. It will be led by the PAGES parent organization, the International Geosphere-Biosphere Programme (IGBP), and involve its sister programs of the Earth System Science Partnership (ESSP). The conference is a unique opportunity to bring together global-change scientists with decision-makers in policy, development, resource management, industry and other non-government organizations. It aims to provide scientific leadership towards the 2012 UN Conference on Sustainable Development - Rio+20. (www.planetunderpressure2012.net)
New PAGES publications
A special issue on the timing and geographic extent of extreme arid and humid events during the Holocene, captured in lake sediment records from hydrologically sensitive regions was published recently (Quaternary International, 229: 1-148). The special issue is comprised of 18 selected papers from the 3rd PAGES LIMPACS (Human Impacts on Lake Ecosystems) Conference held in Chandigarh, India in March 2009.
Additionally, the PAGES special issue “Retrospective views on our planet's future – PAGES Open Science Meeting 2009” is now complete with all 10 articles now published open access in Climate of the Past.
Next newsletter issues
The next issue of PAGES news will highlight the PAGES Focus 4 Theme of “Regional integration of past records for management of modern resources and landscapes”. This issue stems from the Regional Integration workshop held in Southampton in September 2010.
The 3rd PAGES news issue for 2010 will highlight the complementary science of PAGES and the other IGBP projects. Paired topical articles will provide different temporal perspectives on global change questions. Please contact the IPO if you would like to contribute to this issue.
You are also invited to submit Science Highlights, Program News and Workshop Reports for the open section of PAGES news. The next deadline for such contributions is 30 June 2011. Guidelines for authors can be found on the PAGES website (Products>Contribute a product)
Elena Xoplaki1, Dominik Fleitmann2, and Henry F. Diaz3
1Institute of Geography and Oeschger Centre for Climate Change Research, University of Bern, Switzerland; xoplakigiub.unibe.ch
2Institute of Geological Sciences and Oeschger Centre for Climate Change Research, University of Bern, Switzerland; fleitmangeo.unibe.ch
3Cooperative Institute for Research in Environmental Sciences, University of Colorado, Boulder, USA; Henry.F.Diaznoaa.gov
Research on the climate of the Middle Ages began in the 1960s. Motivated by historical accounts Hubert H. Lamb documented the increase in relative frequency of warm episodes, primarily around the North Atlantic and increased cool season precipitation across Britain during medieval times (Lamb, 1965). Lamb wrote first of a “Medieval Warm Epoch” and later of a “Medieval Warm Period” ending at approximately AD 1300. Lamb recognized that the available evidence implied that due to a ‘‘… shift in the upper westerlies, the depression tracks should have had an average position north of the modern normal (AD 1900–1939) position — a displacement that probably implies less sea ice …’’ (Lamb, 1965; 1969). He thus emphasized the relationship between changes in circulation and surface climate, and the idea of modest but persistent shifts in winter circulation over the North Atlantic and Europe during medieval times (see also Graham et al., 2010). Later, LaMarche (1974) used multi-elevation tree-ring and other data to infer late Holocene climate changes in the White Mountains of California. His analyses indicated that conditions were predominantly warmer and drier from AD 1000–1300, and cooler and wetter from AD 1400–1800. He showed that such changes could be explained by a northward-to-southward shift of the storm track over the region. LaMarche pointed out that the transition from the Medieval Warm Period to the subsequent Little Ice Age (LIA) over the western US was synchronous with the one inferred by Lamb (1965) for the North Atlantic and Western Europe, possibly indicating a shift in global circulation patterns, as already surmised by Lamb (1969; see also Graham et al., 2010).
Interestingly, within this period various important cultural events took place. From AD 800-1000 Iron Age Scandinavians colonized the North Atlantic islands and eastern North America. Iceland was settled around AD 874, Greenland ca. AD 985, and the short lived Vinland colony survived a few years around AD 1000 in Newfoundland (Arneborg, 2000; Wallace, 2000). By their arrival to Iceland, Scandinavian settlers encountered a mid–Atlantic island with favorable climatic and environmental conditions similar to those prevailing in Scandinavia (McGovern et al., 2007). In North America, the Vinland colony of the Vikings was abandoned by the mid–11th century. At that time drift ice had already started its appearance along the vital trade routes to Greenland (Lamb, 1995), increasing the threat of ice for seafarers. Climate change and human environmental effects on the island ecosystems played an important role in the unhappy ending to the “Norse Atlantic Saga” (Amorosi et al., 1997; Dugmore et al., 2004; Ogilvie and McGovern, 2000) combined with changes in politics and market forces in Europe (Ladurie, 1983; Jones, 1986).
A large number of studies on the temporal and regional expression of the Medieval Warm Period for different parts of the world have followed since the pioneering works of Lamb and LaMarche. A comprehensive review of those studies can be found in Hughes and Diaz (1994), Graham et al. (2010) and Diaz et al. (2011). The time frame is nowadays more commonly referred to as the Medieval Climate Anomaly (MCA). This term was coined originally by Stine (1994), who sought an explanation for the results of a wide-ranging geomorphic investigation of century-long low stands of lakes in the sub-tropical latitudes of western North and South America. The subsequent adoption of this term reflects the availability of much more information on the climate during medieval times since Lamb‘s pioneering studies. Since then, new proxy paleoclimate records, temporally and spatially highly resolved reconstructions, and detailed modeling studies allow for a more accurate and detailed study of the climate since the MCA (Mann et al., 2009; Cook et al., 2010; Graham et al., 2010; Diaz et al., 2011 and references therein).
Bradley et al. (2003) questioned the statement “Climate in Medieval time is often said to have been as warm as, or warmer than, it is today. Still, many aspects of the climate during the MCA require careful examination and further investigations. Among areas of ongoing research are the onset and termination as well as the positioning of the MCA in the Holocene climatic context, the climate characteristics of the period, the nature of the transition to the subsequent LIA, the spatial extent and local expression as well as the impacts on societies, associated forcing factors, and most prominently its magnitude compared to the instrumental temperature records and the magnitude and pace of the twentieth century warming.
These aspects are the focus of this PAGES Newsletter. The special section compiles latest information on climate and impacts during the MCA on global and regional scales. Historical documents, proxy records and climate models provide new insights into the temporal and spatial climatic pattern and related dynamics and forcings during medieval times.
references
Bradley, R.S., Hughes, M.K. and Diaz, H.F., 2003: Climate in Medieval Time, Science 302: 404-405.
For full references please consult: http://pastglobalchanges.org/products/newsletters/ref2011_1.html
Friedhelm Steinhilber and Jürg Beer
Swiss Federal Institute of Aquatic Science and Technology, Dübendorf, Switzerland; friedhelm.steinhilbereawag.ch
Solar activity highs and lows coincide with the Medieval Climate Anomaly and the Little Ice Age, respectively.
 |
|
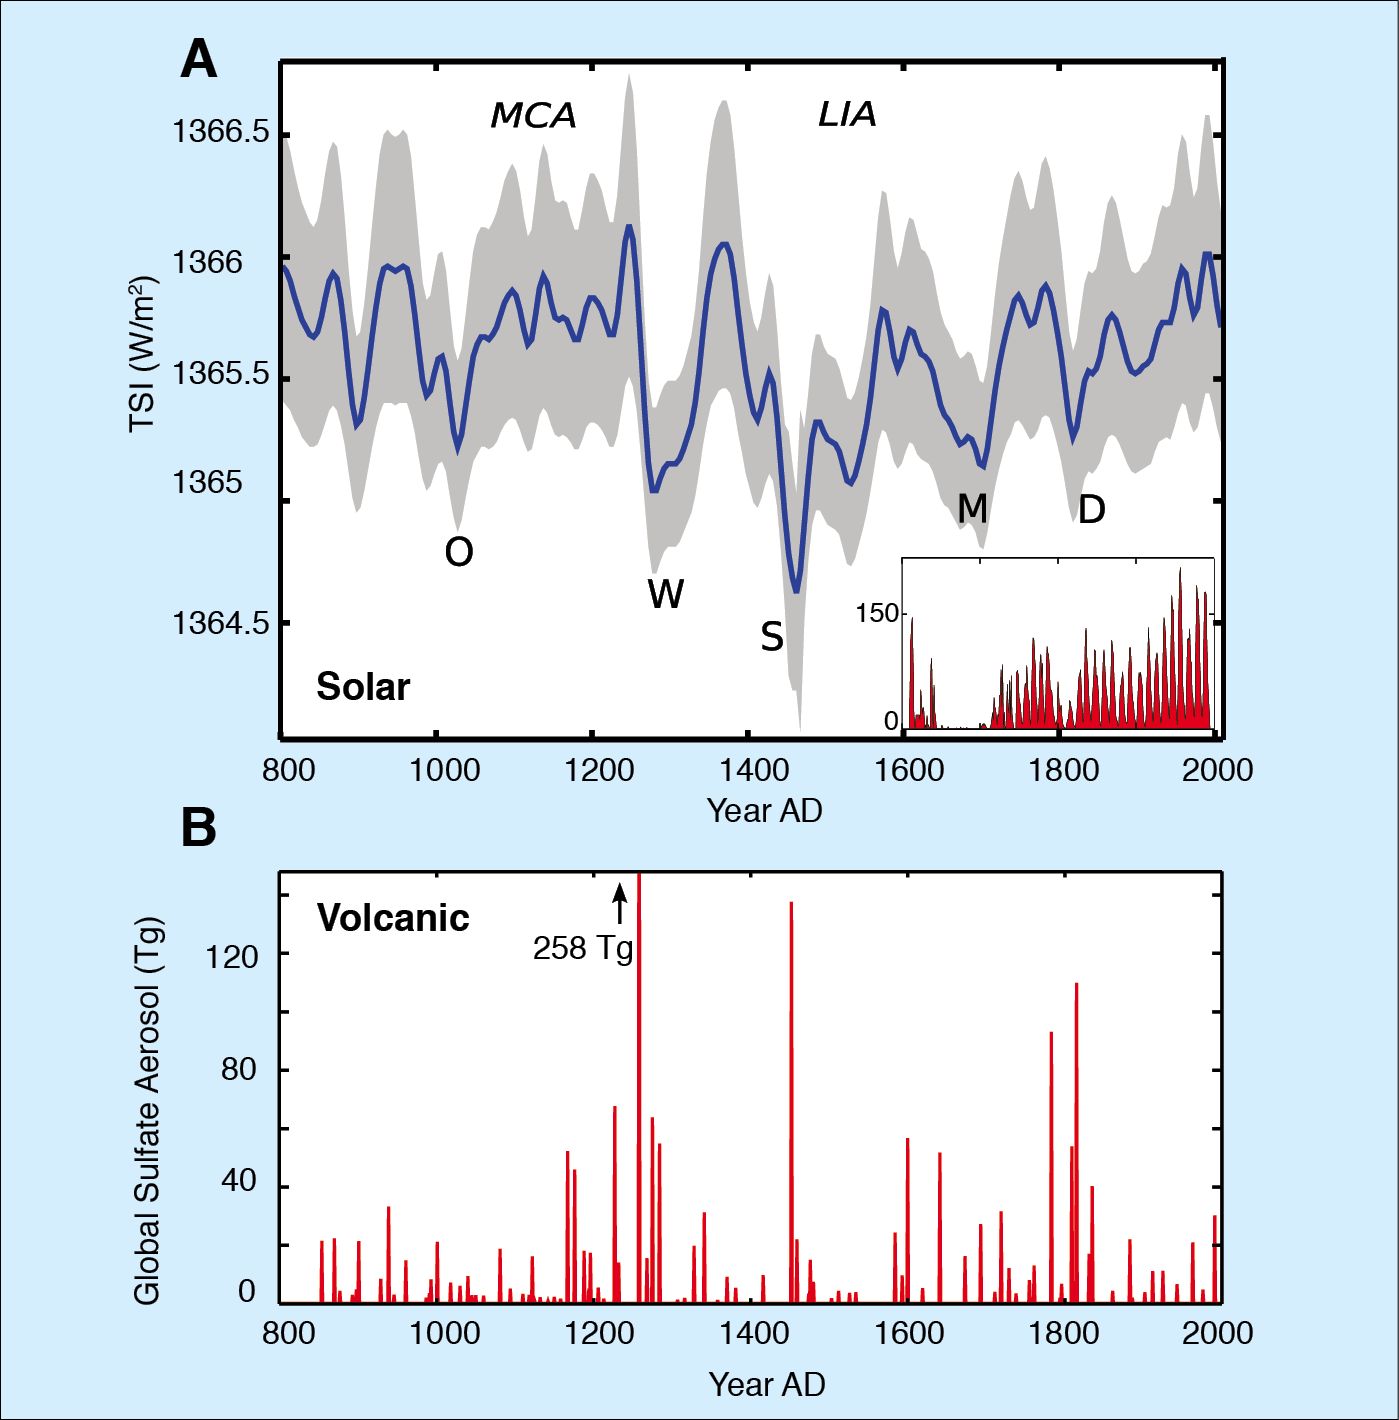
Figure 1: A) Zoom-in of the 9300-year long total solar irradiance (TSI) reconstruction (Steinhilber et al., 2009) for the past 1200 years. The gray band is the 1σ uncertainty. Inset shows the group sunspot number. MCA: Medieval climate anomaly; LIA: Little Ice Age. Capital letters mark grand solar minima: O=Oort, W=Wolf, S=Spörer, M=Maunder, D=Dalton. B) Total global stratospheric volcanic sulfate aerosol injection in teragram (Tg) (Gao et al., 2008). |
The Sun is a variable star and the most important source of energy for the Earth. This raises the question whether the Sun affects the Earth’s climate. Several solar activity records show that the Sun has short- and long-term variability. An example is the well-known sunspot record (inset curve in Figure 1a), which reaches back to the year 1610 AD, when people started to use the telescope for astrophysical purposes such as observing the Sun. From the sunspot record it is known that solar activity was lower during the 17th and 18th century than today. In particular, the period from 1645 to 1715 AD named the Maunder Minimum (Eddy, 1976) is characterized by a nearly complete absence of sunspots. The sunspot record “only” goes back to 1610 AD and before this time other proxies of solar activity must be used. Presently the only proxies capable of extending the record of solar activity beyond 1610 AD are cosmogenic radionuclides, such as 14C and 10Be. The term “cosmogenic” points to the origin of the radionuclides — cosmogenic radionuclides are produced by nuclear reactions between cosmic ray particles and the gases of the Earth’s atmosphere. Thus, cosmogenic radionuclides record the intensity of the cosmic ray intensity at Earth.
Link to the Sun
 |
|
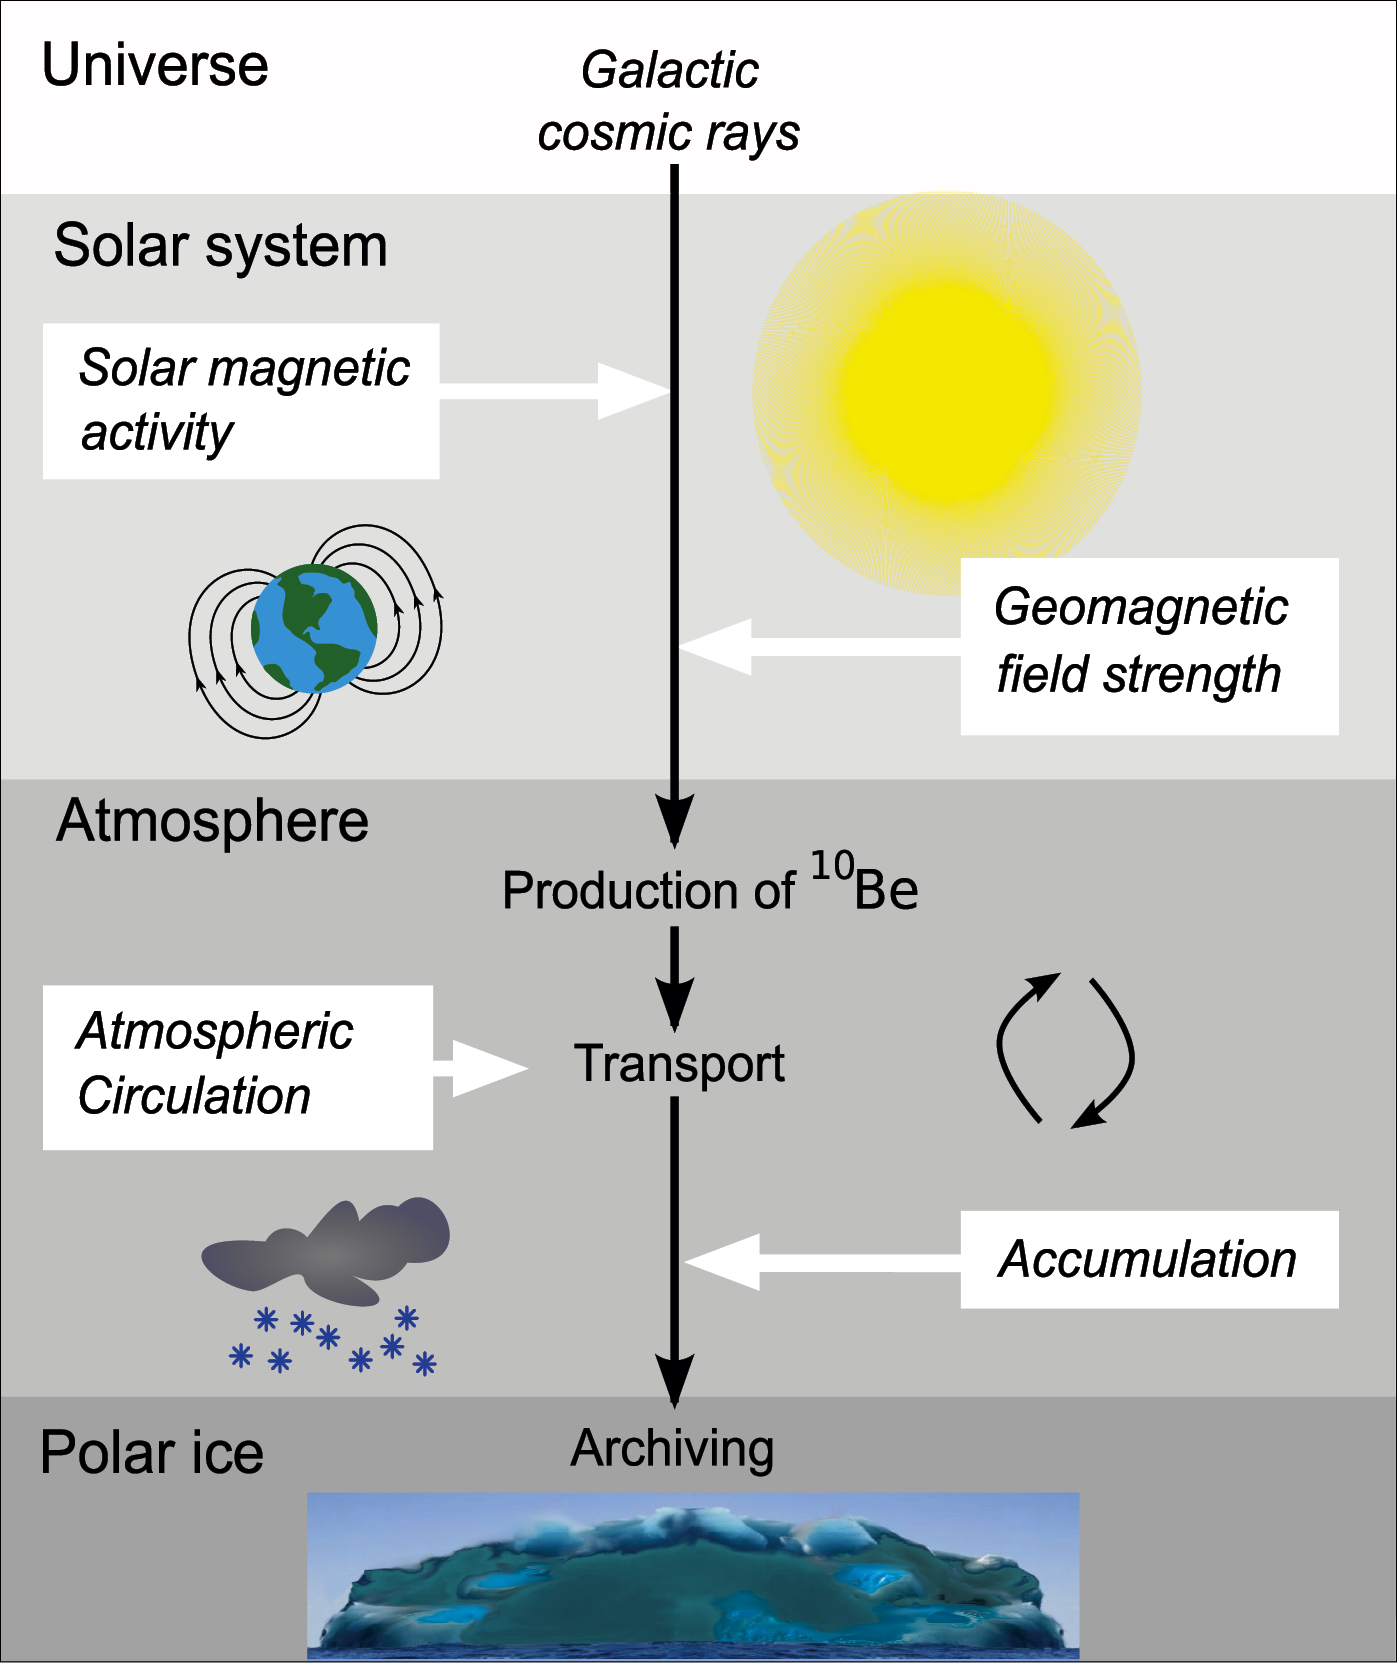
Figure 2: Illustration of the 10Be system and its relationship to solar activity. |
Why do cosmogenic radionuclides record the solar activity? The link between 10Be and solar activity is illustrated in Figure 2. Cosmic ray particles are accelerated to high energies in the vicinity of supernova explosions in our galaxy. To reach the Earth they have to propagate through the heliosphere, which is formed by the solar wind carrying the solar magnetic field. Cosmic ray particles are charged and therefore get deflected by the solar magnetic field. The larger the strength of the solar magnetic field, the stronger is the deflection of cosmic ray particles and the lower the cosmic ray intensity at Earth. The solar magnetic field is directly related to solar activity, i.e., when solar activity is weak the strength of the solar magnetic field is weak. To summarize, the radionuclide production rate is high during a grand solar minimum like the Maunder Minimum and low during periods of high solar activity. Thus the radionuclide signal principally allows reconstructing solar activity.
In addition to the solar magnetic field, the geomagnetic field also modulates the cosmic ray intensity. From archeointensity data it is known that the geomagnetic field has varied in time (e.g., Knudsen et al., 2008) and therefore a part of the variation found in cosmogenic radionuclides is of geomagnetic origin. Hence, variations of the geomagnetic field must first be removed from the radionuclide record before solar activity can be calculated. The physics-based dependencies between radionuclide production, solar activity and geomagnetic field strength have been determined using the Monte Carlo technique (Masarik and Beer, 2009). These calculations provide the dependence of the radionuclide production on solar activity and geomagnetic field strength. Based on this dependence and the known paleo-geomagnetic field, the solar activity can be derived from the radionuclide signal.
After their production in the Earth’s atmosphere, the radionuclides are transported and distributed within the environment and partly stored in natural archives. The best-suited archives are tree rings (14C) and polar ice (10Be) and both have recorded the solar activity signal with high temporal resolution over many millennia. Tree rings and polar ice can both be dated very accurately, which is a prerequisite for high temporal resolution reconstructions. Some existing records have annual resolution for the past ca. 600 years (Berggren et al., 2009), and resolutions of a few years to decades for the Holocene (e.g., Muscheler et al., 2007; Usoskin et al., 2007; Steinhilber et al., 2008). Note that cosmogenic radionuclides are also found in other archives (e.g., alpine glaciers, lake sediments, ocean sediments) but generally the chronologies are less accurate.
The radionuclide signal not only reflects the cosmic ray variation due to solar and geomagnetic activity, it is also influenced by “system effects”. System effects are variations induced by the transport from the atmosphere where the radionuclides are produced to the ground where they are archived. In addition to the system effects, the cosmic ray signal has uncertainty due to uncertainty in the timescale and in the radionuclide measurements.
Solar activity during the past 1200 years
Recently, total solar irradiance (TSI) has been reconstructed from a composite of several 10Be records measured in polar ice for the past 9300 years (Steinhilber et al., 2008, 2009). The composite is mainly based on the 10Be record from the GRIP ice core, Greenland. As system effects mostly influence the signal on short time-scales, 40-year averages have been built from the 10Be records.
A part of the Holocene TSI reconstruction is shown for the past 1200 years in Figure 1a. Five distinct grand solar minima can be identified known as the Oort (1040-1080 AD), Wolf (1280-1350 AD), Spörer (1460-1550 AD), Maunder (1645-1715 AD), and Dalton (1790-1820 AD) Minima. The last four grand solar minima: Wolf, Spörer, Maunder and Dalton, occurred in a cluster. This cluster coincides with the Little Ice Age (LIA), a period of cold climate conditions from about 1350 to 1850 AD. Between the Oort and the Wolf Minimum a period of high solar activity of approximately 200 years is evident. This period coincides with the Medieval Climate Anomaly (MCA), which is generally characterized by warmer and drier climate conditions. The simultaneous occurrences of the LIA with a cluster of grand solar minima and of the MCA with a long-lasting period of high solar activity, points to an influence of the Sun on the Earth’s climate during these periods. In addition to solar activity, volcanic eruptions played an important role (Fig. 1b; Gao et al., 2008). During the LIA, several strong volcanic eruptions occurred at the time of grand solar minima, which had a further cooling effect. An inverse pattern is found for the MCA when only weak volcanic eruptions are identified and solar activity was high. With the beginning of industrialization in the 18th century, the importance of solar and volcanic forcing decreased while the influence of the anthropogenic greenhouse effect due to fossil fuel burning began to increase and is currently playing the dominant role (Hegerl et al., 2007).
Future solar activity
An interesting question is what role the Sun is going to play in the near future. The 9300-year long composite of solar activity (Steinhilber et al., 2008) shows that during the past six decades the Sun has been in a state of high solar activity compared to the entire period of 9300 years. The statistics of the occurrence of periods of high activity suggests that the current period of high activity will come to an end in the next decades (Abreu et al., 2008). Furthermore, the distribution of grand solar minima in the past 9300 years shows that it is likely that a Maunder Minimum-like period would occur around 2100 AD (Abreu et al., 2010). Such a period of low solar activity would probably lead to a temporary reduction in Earth’s temperature rise due to the anthropogenic greenhouse effect. However, the 9300-year long record shows that in the past a grand maximum has always been followed by a period of high activity, with the very likely assumption that the Sun's future behavior will be similar to that of the past, it is clear that the Sun will not permanently compensate for human-made global warming.
references
Hegerl, G.C., Zwiers, F.W., Braconnot, P., Gillett, N.P., Luo, Y., Marengo Orsini, J.A., Nicholls, N., Penner, J.E. and Stott, P.A., 2007: Understanding and Attributing Climate Change. In: Solomon, S., et al. (Eds), Climate Change 2007: The Physical Science Basis. Contribution of Working Group I to the Fourth Assessment Report of the Intergovernmental Panel on Climate Change, Cambridge University Press.
For full references please consult: http://pastglobalchanges.org/products/newsletters/ref2011_1.html
Fidel J. González-Rouco1, L. Fernández-Donado1, C.C. Raible2,3, D. Barriopedro4 , J. Luterbacher5, J.H. Jungclaus6, D. Swingedouw7, J. Servonnat7, E. Zorita8, S. Wagner8 and C.M. Ammann9
1Departamento Astrofísica y CC. de la Atmósfera, Universidad Complutense de Madrid, Spain; fidelgrfis.ucm.es
2Climate and Environmental Physics, University of Bern, Switzerland
3Oeschger Centre for Cimate Change Research, University of Bern, Switzerland
4Laboratory IDL, University of Lisbon, Portugal
5Department of Geography, Justus Liebig University Giessen, Germany
6Max Planck Institute for Meteorology, Hamburg, Germany
7Laboratoire des Sciences du Climat et de l’Environnement, Gif-sur-Yvette, France
8Helmholtz-Zentrum Geesthacht, Germany
9National Center for Atmospheric Research, Boulder, USA
Inter-model differences and model/reconstruction comparisons suggest that simulations of the Medieval Climate Anomaly either fail to reproduce the mechanisms of climate response to changes in external forcing, or that anomalies during this period are largely influenced by internal variability.
Comparing model simulations with proxy-based climate reconstructions offers the possibility to explain mechanisms of climate variability during key periods, such as the Medieval Climate Anomaly (MCA) and the Little Ice Age (LIA). Discrepancies between both sources of information may also help to identify possible deficiencies in our understanding of past climate, its modeling or its representation by proxy records.
Information derived from proxy records suggests the following picture of the MCA in comparison to the subsequent colder period, the LIA, that involves quasi-coordinated climate shifts across different regions of the globe (e.g., Seager et al., 2007; Mann et al., 2009; Graham et al., 2010): evidences of an increased zonal gradient in the tropical Pacific produced by La Niña-like conditions in the eastern Pacific and anomalous warmth in the western Pacific and Indian Ocean, and a broad expansion of the Hadley Cell with associated northward shift of the zonal circulation that might have led to a more positive North Atlantic Oscillation (NAO) type of signature in the North Atlantic. Graham et al. (2010) recently showed that a pattern of change consistent with such anomalies is obtained for the MCA with an Atmosphere Ocean General Circulation Model (AOGCM) if anomalously warm sea surface temperatures are induced on the Indian Ocean and western tropical Pacific.
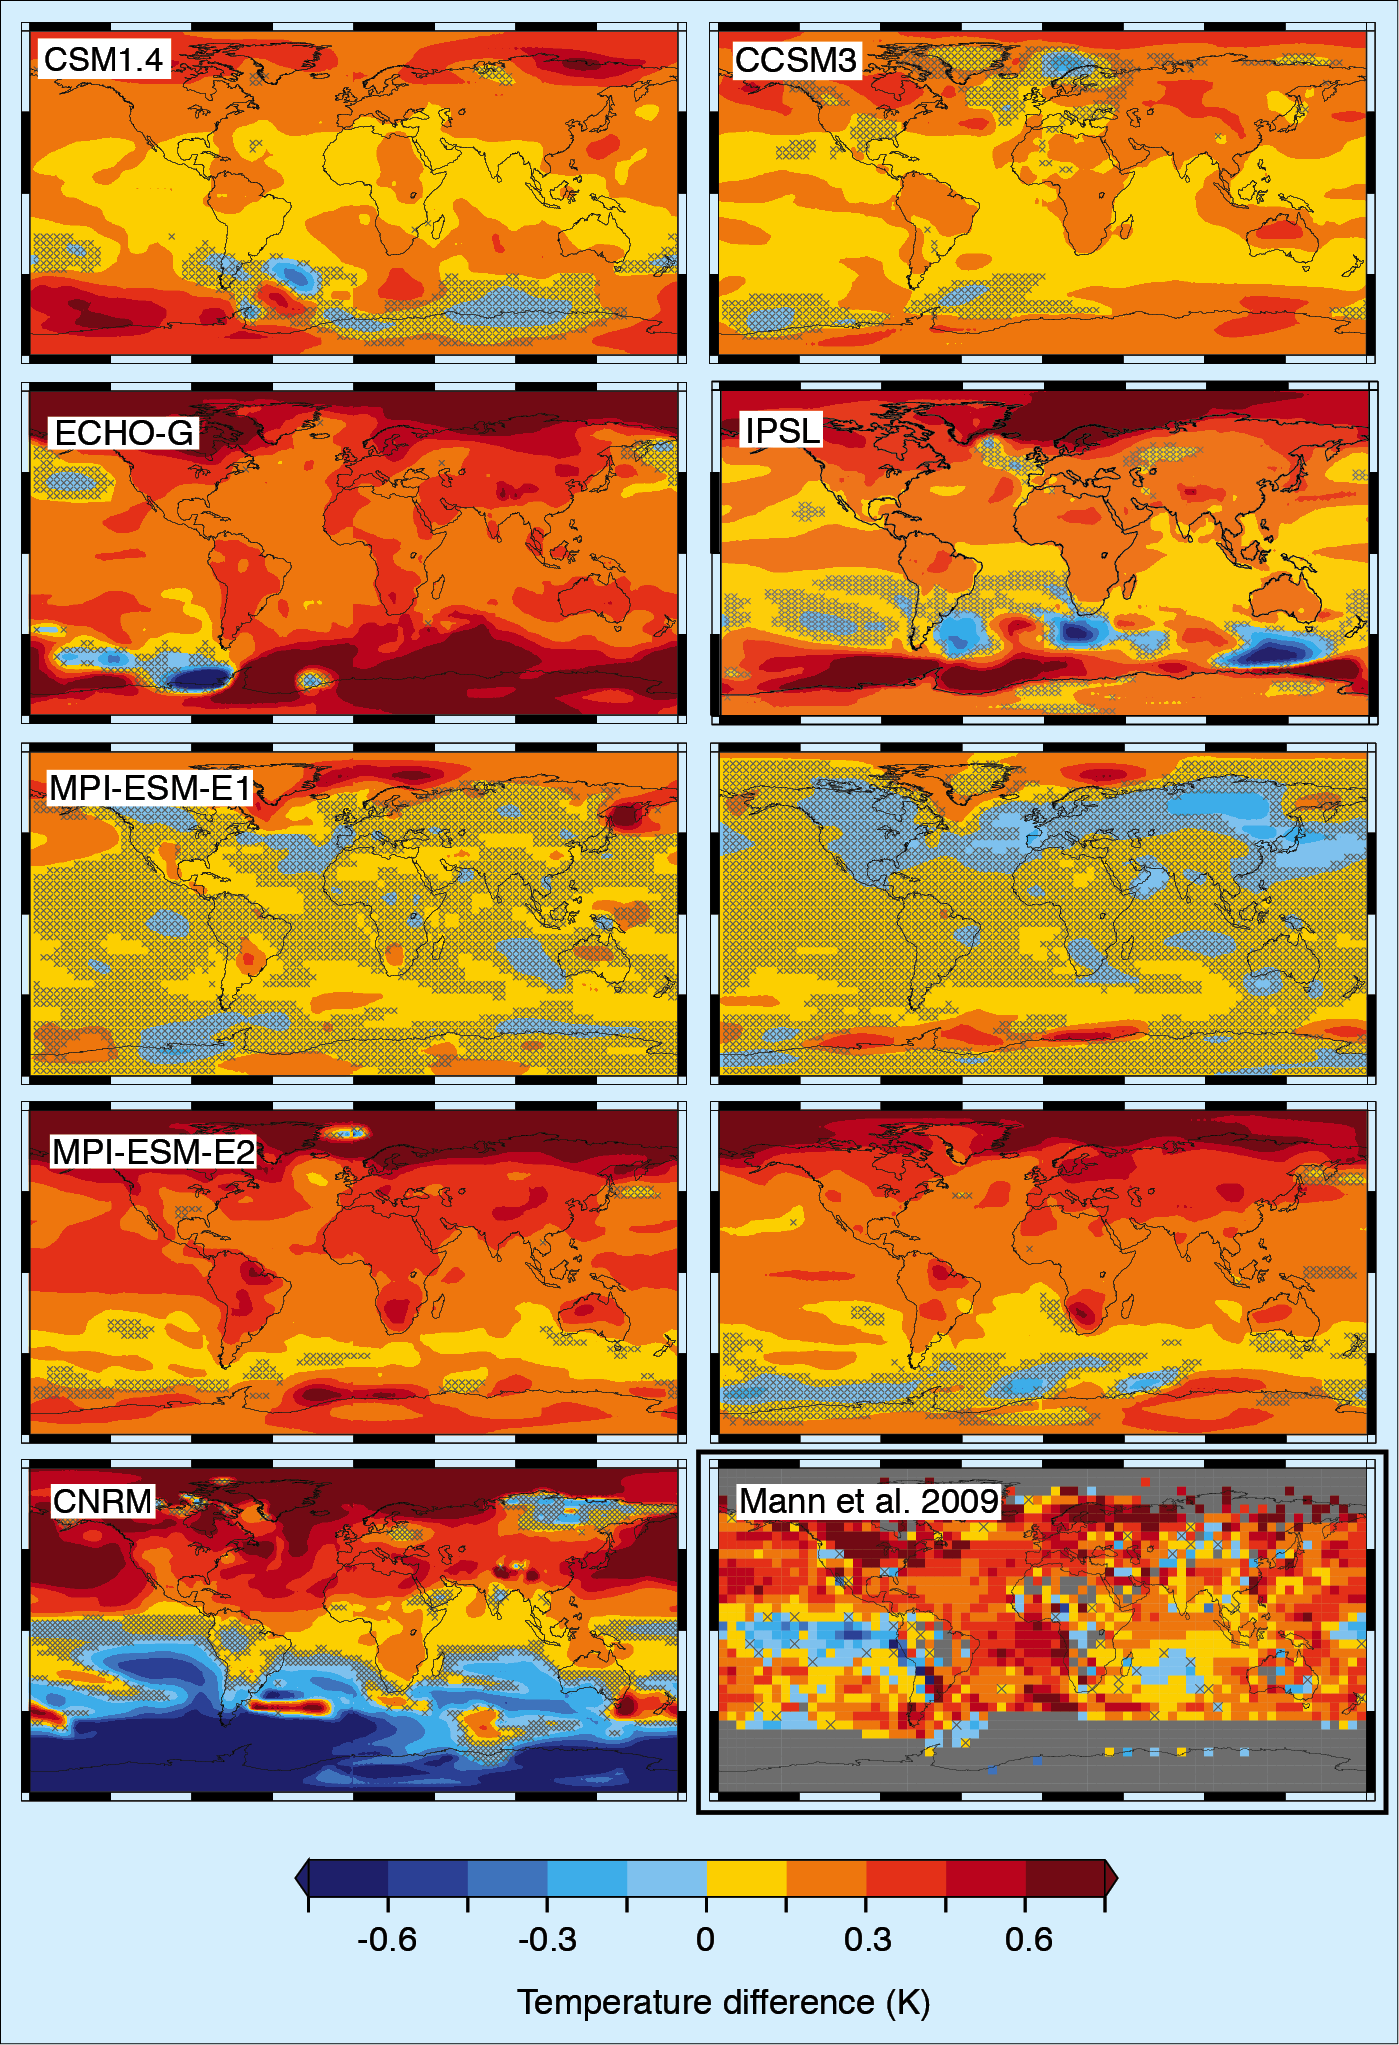
Current AOGCM millennial forced simulations do represent an overall warmer MCA and a cooler LIA at global and hemispherical scales (e.g., González-Rouco et al., 2006; Ammann et al., 2007) as a response to long-term changes in volcanic activity and solar irradiance. The amplitude of this response is dependent on the model sensitivity and on the specific set of forcing reconstructions used to drive the simulations. Mann et al. (2009) show that in spite of agreement in simulating global and hemispheric warming, the reconstructed pattern of MCA-LIA temperature change, and specifically the La Niña-like conditions in the eastern Pacific, were not reproduced by forced simulations with the GISS-ER and the NCAR CSM1.4 climate models. In this contribution, we will examine the MCA-LIA transition in all available high complexity AOGCM transient simulations of the last millennium.
Simulation of MCA-LIA temperature difference by AOGCMs
Simulations from six different AOGCMs are considered (see original references for details): the National Center for Atmospheric Research Climate System Model 1.4 (Ammann et al., 2007; CSM1.4 hereafter); a new version of the same model, the Community Climate System Model 3 (Hofer et al., 2011; CCSM3 hereafter); the Max Planck Institute for Meteorology ECHO-G (González-Rouco et al., 2006); the Institute Pierre Simon Laplace IPSLCM4_v2 (Servonnat et al., 2010; IPSL hereafter); the Centre National de Recherches Météorologiques CNRM-CM3.3 (Swingedouw et al., 2010; CNRM hereafter); and the Max Plank Institute for Meteorology Earth System Model (Jungclaus et al., 2010; MPI-ESM hereafter). This suite of simulations has been performed by different groups and institutions and represents forcing uncertainty through somewhat different choices of external forcing. Only some comments about the forcing that are relevant for the MCA-LIA period are provided herein.
All simulations incorporate solar variability, volcanic activity (except for IPSL) and greenhouse gas concentration changes. Variations in solar irradiance for the last millennium are smaller than previously thought (see discussion in Jungclaus et al., 2010 and Schmidt et al., 2011). The majority of simulations were performed with a comparatively high solar variability scenario, except for the specific case of MPI-ESM for which two different ensembles were made including smaller (E1) and larger (E2) irradiance changes. The total solar irradiance (TSI) change in the high solar variability scenarios ranges from 0.24% (CSM1.4, CCSM3) to 0.29% (ECHO-G) from the Late Maunder Minimum (LMM) to present and from 0.17% (CCSM3) to 0.27% (MPI-ESM-E2) from the MCA to the LMM; in MPI-ESM-E1 the values of TSI change are of 0.09% (0.04%) for the transition LMM-present (MCA-LMM). Volcanic forcing was implemented differently in the suite of models, although comparable global and annual averages were retained. With regard to greenhouse gases, all models incorporate prescribed values of CO2 concentration except for MPI-ESM, which interactively calculates them within the carbon cycle submodel. Similarly, land use changes before 1700 AD are incorporated only in the MPI-ESM simulations as variations in vegetation types due to agricultural activities.
 |
|
Figure 1: MCA–LIA (950-1250 AD minus 1400-1700 AD annual mean temperature difference in forced simulations produced with six different AOGCMs (see text for details on acronyms) and in the multiproxy climate field reconstruction from Mann et al. (2009). For the simulations starting in 1000 AD (CCSM3, ECHO-G, IPSL, CNRM) the period 1000 to 1250 was selected instead to define the MCA. In the case of the ECHO-G model, results are shown for the FOR2 simulation in González-Rouco et al. (2006). Hatched areas indicate non-significant differences according to a two-sided t-test (p<0.05). |
Figure 1 shows the MCA–LIA annual temperature differences (hatched areas indicate non significance for a p<0.05 level) in a forced simulation from each of the six models and also in the proxy-based reconstruction from Mann et al. (2009). For the specific case of the MPI-ESM model, results are shown for four simulations, two arbitrarily selected from each ensemble to illustrate the existing differences between the members. All simulations tend to produce an almost globally warmer MCA, except for the one of CNRM, which shows a large cooling in the Southern Hemisphere. Warming tends to be higher over the continents than oceans, particularly over the sea-ice boundary at the high latitudes of both hemispheres. Regional scale cooling (not significant everywhere) is simulated around Antarctica, mid-latitudes of the Southern Hemisphere (all models), in the North Pacific (ECHO-G), in the North Atlantic (CCSM3) or in northern Asia (CNRM). However, many of these regional scale features may well be simulation-dependent and related to initial conditions and internal variability as evidenced by the differences within the members of each MPI-ESM ensemble. Differences arise in the magnitude of warming and cooling over the North Pacific, South America or Africa in E2 or in the spread of cooling regions in the E1 members. Among the two ensembles, E1 simulates more regional/large-scale widespread cooling, a sign of the lower weight of TSI changes that allows for internal variability to become more prominent. Therefore, even if widespread warming is simulated in the MCA, the spatial pattern of temperature change is very heterogeneous and can vary considerably from model to model and even within simulations of the same model.
None of the model simulations reproduce the reconstructed pattern in Mann et al. (2009) depicting a La Niña-like state in the Pacific. Other features in the reconstructed evidence discussed by Graham et al. (2010) are also not evident in the simulated MCA–LIA temperature differences. This includes the anomalous warm pool over the western Pacific- Indian Ocean and enhanced tropical zonal temperature gradient, as well as an NAO-like temperature signature, suggestive of a northward shift of the zonal circulation. Therefore apart from the generally higher changes in continental and polar areas, the MCA–LIA change across the available model simulations is inconsistent, and shows a different response to proxy evidences.
Conclusions
The results presented here highlight major discrepancies between millennium simulations and reconstructions. If proxy-based reconstructions were considered reliable and changes in radiative forcing factors were responsible for the MCA–LIA reconstructed temperature signal, these results would have implications on our understanding of the MCA–LIA transition. These discrepancies suggest that either the MCA–LIA changes arose from internal variability only, or transient simulations with state-of-the-art AOGCMs fail to correctly reproduce some mechanisms of response to external forcing: for instance, changes in the tropics like the enhancement of the zonal gradient in the tropical Pacific is not well simulated, with implications for related teleconnections elsewhere.
Most models have used relatively high TSI variations from the MCA to the LIA and their pattern of response is typically a uniform warming in the earlier period. In spite of this, there are considerable differences among the simulations that highlight a feasible influence of initial conditions and internal variability. Furthermore, if reduced levels of past TSI are given more credit, as in the MPI-ESM-E1 ensemble, the temperature response for the MCA–LIA is less uniform in sign and visibly more influenced by internal variability. Therefore, under both high and low TSI change scenarios, it is possible that the MCA–LIA reconstructed anomalies would have been largely influenced by internal variability.
references
For full references please consult: http://pastglobalchanges.org/products/newsletters/ref2011_1.html
Nicholas E. Graham1,2, C.M. Ammann3, D. Fleitmann4,5, K.M. Cobb6 and J. Luterbacher7
1Hydrologic Research Center, San Diego, USA; ngrahamhrc-lab.org
2Scripps Institution of Oceanography, La Jolla, USA
3National Center for Atmospheric Research, Boulder, USA
4Institute of Geological Sciences, University of Bern, Switzerland
5Oeschger Centre for Climate Change Research, University of Bern, Switzerland
6Georgia Institute of Technology, Atlanta, USA
7Justus-Liebig-University, Giessen, Germany
A synthesis of global climate model results and inferences from proxy records suggests an increased sea surface temperature gradient between the tropical Indian and Pacific Oceans during medieval times.
 |
|
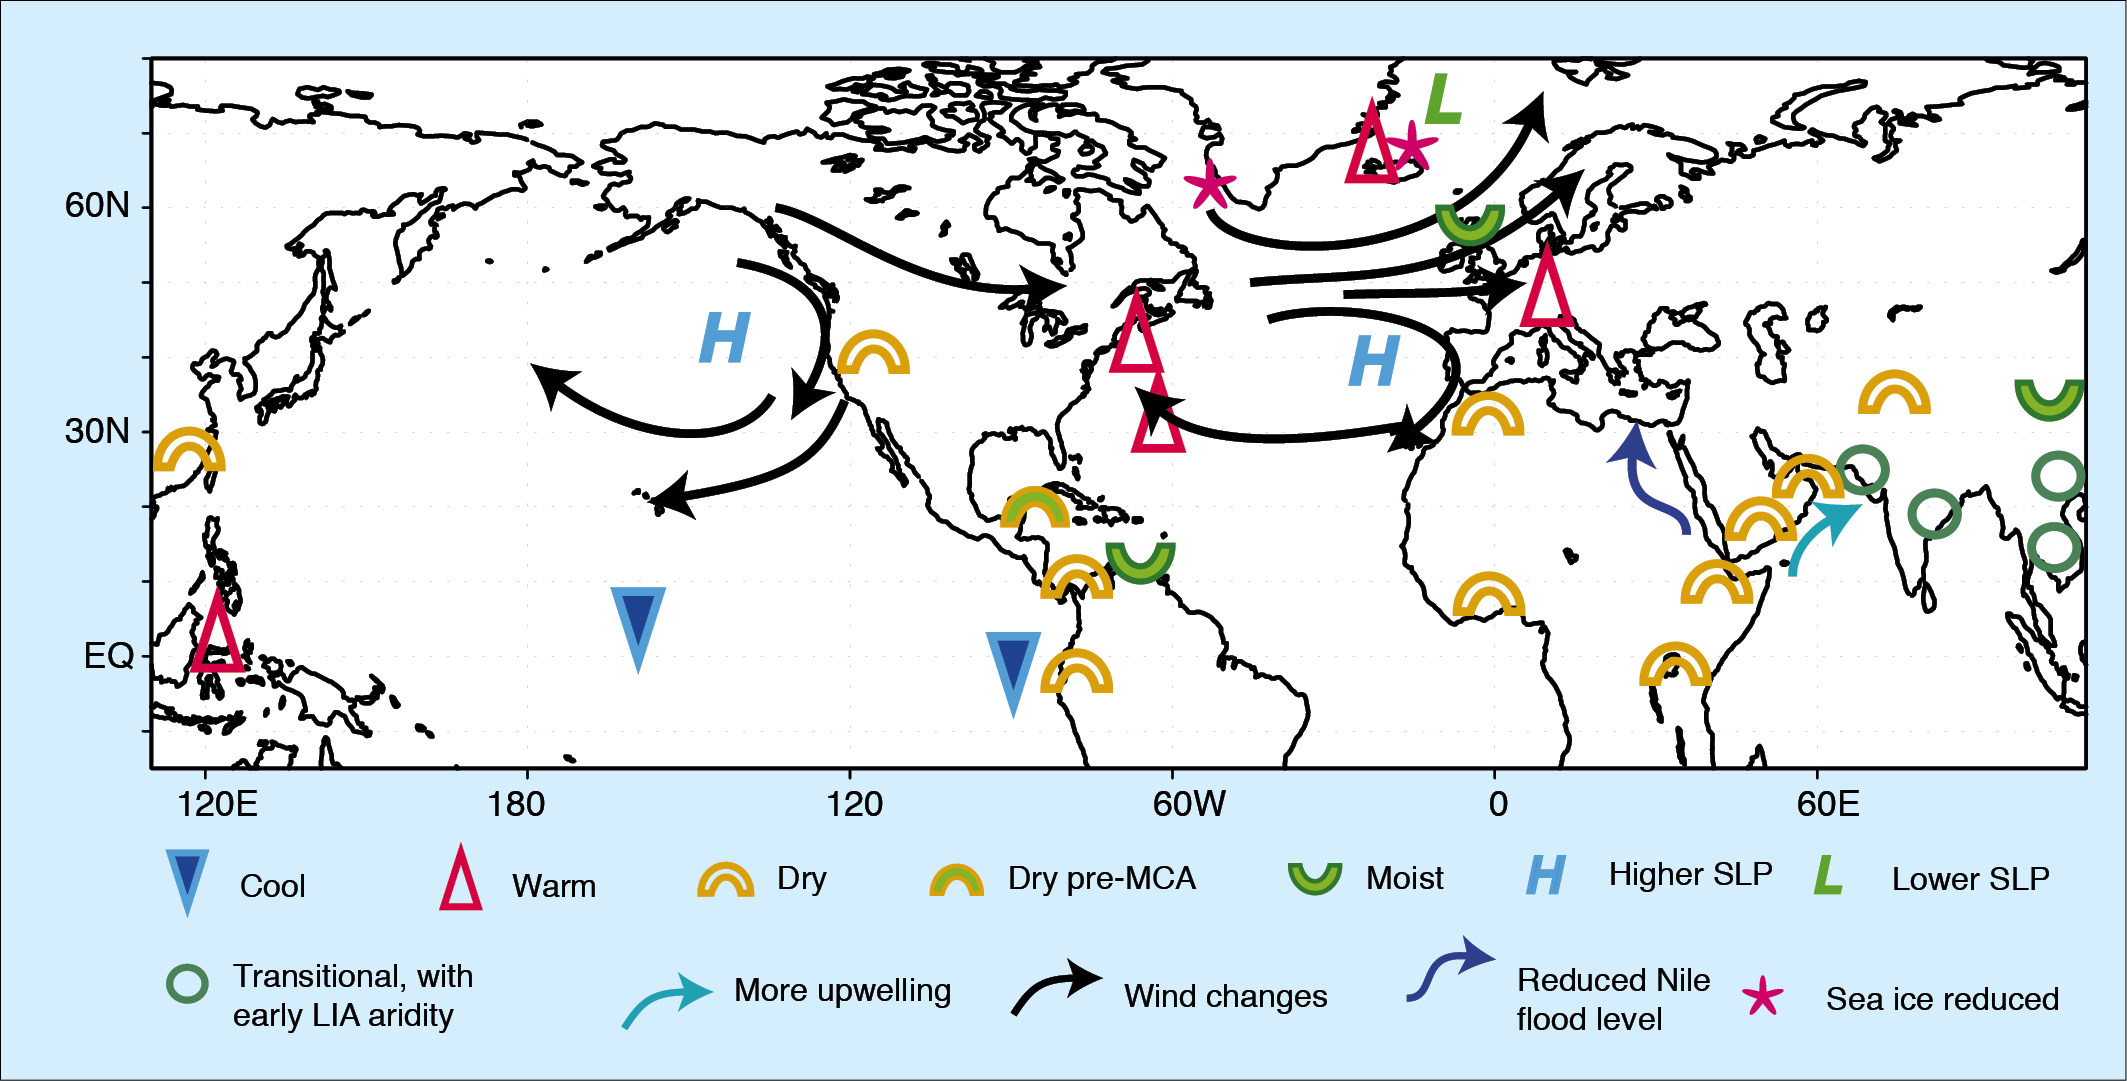
Figure 1: Schematic diagram of MCA vs LIA climate shifts as seen in a range of globally distributed proxy records |
A range of in-situ proxy records indicate that tropical eastern and central Pacific sea surface temperatures (SSTs) were relatively cool during the Medieval Climate Anomaly (MCA, ca. 900-1350 AD; e.g., Cobb et al., 2003; Rein et al., 2004; Conroy et al., 2008). This idea is supported by hydroclimate changes indicated by proxy records from extra-tropical western North and South America (e.g., Swetnam et al., 1993; Stine et al., 1994; Jenny et al., 2002; Cook et al., 2004; see Fig. 1). At the same time, indications of a distinct MCA appear in proxy records distributed around the planet, many far removed from the Pacific sector (also Fig. 1). Many of the climate shifts inferred from these latter records are inconsistent in strength or character of the changes expected on the basis of a cooler tropical Pacific alone (at least as judged from observations and model results) suggesting an important role for SST changes in other tropical oceans (Seager et al., 2007; Graham et al., 2007; Graham et al., 2010). Among such “inconsistent” shifts are indications of a more “positive NAO”-like circulation pattern during boreal winter, with impacts on European climate (e.g., Lamb, 1965; Mangini et al., 2005; Trouet et al., 2009), North Atlantic SST and sea ice (e.g., Keigwin, 1996; Jensen et al., 2004; Sicre et al., 2008; Wanamaker et al., 2008; Massé et al., 2009), aridity in equatorial Africa (Verschuren et al., 2004; Russell et al., 2007; Shanahan et al., 2009) and in parts of southwest Asia (Hassan, 1981; von Rad et al., 1999; Fleitmann et al., 2003), and increased monsoon rainfall in parts of south-central and eastern Asia (Sinha et al., 2007; Tan et al., 2008; Zhang et al., 2008; Buckley et al., 2010).
 |
|
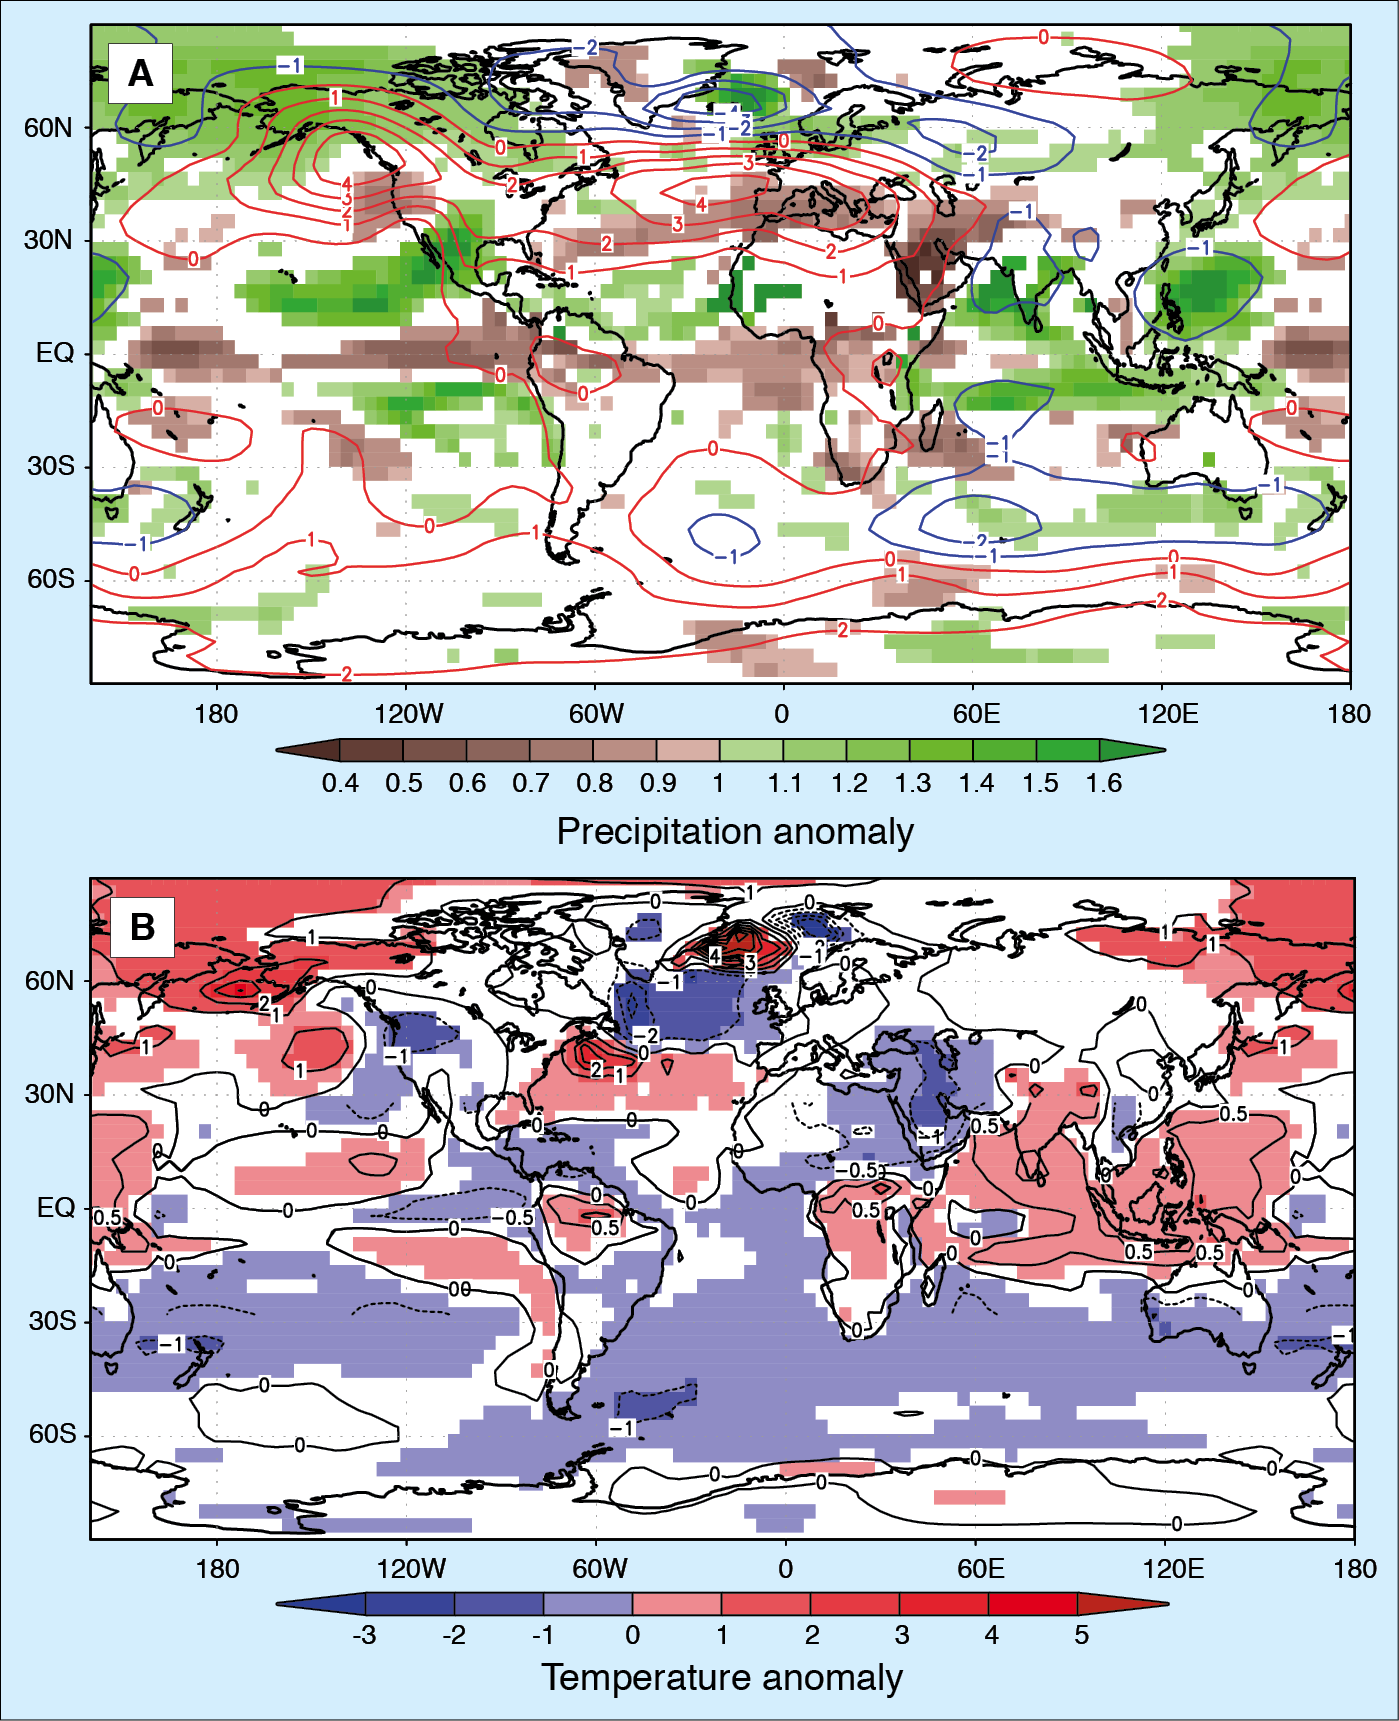
Figure 2: A) Changes in December-March precipitation (fraction of control simulation climatology; color) and sea level pressure (difference with control simulation climatology; hPa, contours) for a simulation with increased tropical Indian and western Pacific SST; precipitation changes are shown only where the differences exceed the 95% confidence level. B) As in (A), but for December-March temperature (°C, color; values are SST over ocean and 2-meter temperature over land). Colors are shown only where temperature differences exceed the 95% confidence level. Lined contour interval is 0.5°C between 30°N and 30°S and 1°C elsewhere. Global average temperature change has been subtracted. |
Model simulations of the climate and circulation changes ensuing from the late 20th century warming of the Indian Ocean (e.g., Bader and Latif, 2003; Hurrell et al., 2004; Hoerling et al., 2004; Bader and Latif, 2005) show some of the “inconsistent” features noted above. To explore the possibility that similar warming may have occurred during the MCA, simulations were performed with a full-physics global coupled model (NCAR CCSM) in which tropical Indian, or tropical Indian and western Pacific, SSTs were increased over the range ~0.2-0.8°C. The simulated global climate and circulation shifts for boreal winter (Figs. 1 and 2; see Graham et al. (2010) for the corresponding results for boreal summer) show many of the climate changes inferred from global proxy records for the MCA, including many of those not well explained by a cooler tropical Pacific alone. These include a systematically stronger NAO during boreal winter, with associated changes in North Atlantic SSTs and sea ice, and European/North African precipitation. The simulated changes also include cooling and reduced rainfall in the equatorial eastern Pacific (boreal winter), seasonal aridity in equatorial and northeast Africa and into southwest Asia, transitioning towards relatively more moist conditions proceeding east across the Indian subcontinent, southeast Asia and into parts of China.
Overall, the findings support the general pattern of tropical SST changes seen in a recent statistical reconstruction (Mann et al., 2009), with a stronger zonal SST gradient between the Indo-Pacific Warm Pool and the eastern/central tropical Pacific during medieval times, relative to subsequent centuries.
acknowledgements
N.E.G. was supported by funding from grants NA06OAR4310120 and NA08OAR4310732 from the US National Oceanographic and Atmospheric Administration (NOAA) CCDD program. N.E.G. is also grateful to PAGES program and the Oeschger Centre for Climate Research at the University of Bern for their support of a visit to the PAGES office and Oeschger Centre in 2008 during which the research reported here was advanced.
references
For full references please consult: http://pastglobalchanges.org/products/newsletters/ref2011_1.html