PAGES Magazine articles
Felipe Franco-Gaviria1 and Mónica Amador-Jiménez2
Online, 2-3 June 2021
This workshop on socio-environmental histories of the Colombian tropical Andean forests (pastglobalchanges.org/calendar/27028) fostered relevant academic and institutional exchanges between social and environmental disciplines. The workshop included eight invited panelists, two main speakers, eight working group moderators, eight poster presenters, and over 120 attendees each day. On average, 60 attendees participated in the breakout activities, which focused on understanding past human and landscape interactions in the tropical Andes of Colombia.
The workshop was a multidisciplinary event with 40% of academics and students from the natural sciences and 60% from the social sciences and the arts. The workshop followed a hybrid methodological concept, designed to promote interdisciplinary discussions. Over the course of two five-hour days, we held open conferences, panel discussions with experts and small discussion groups. In order to participate, it was compulsory to read articles, in advance, on environmental change issues in the Andes from journals and prestigious authors from the natural and social sciences. The breakout activity led to discussions within groups of eight people. This setting allowed for better interaction among participants, moderators, and panelists.
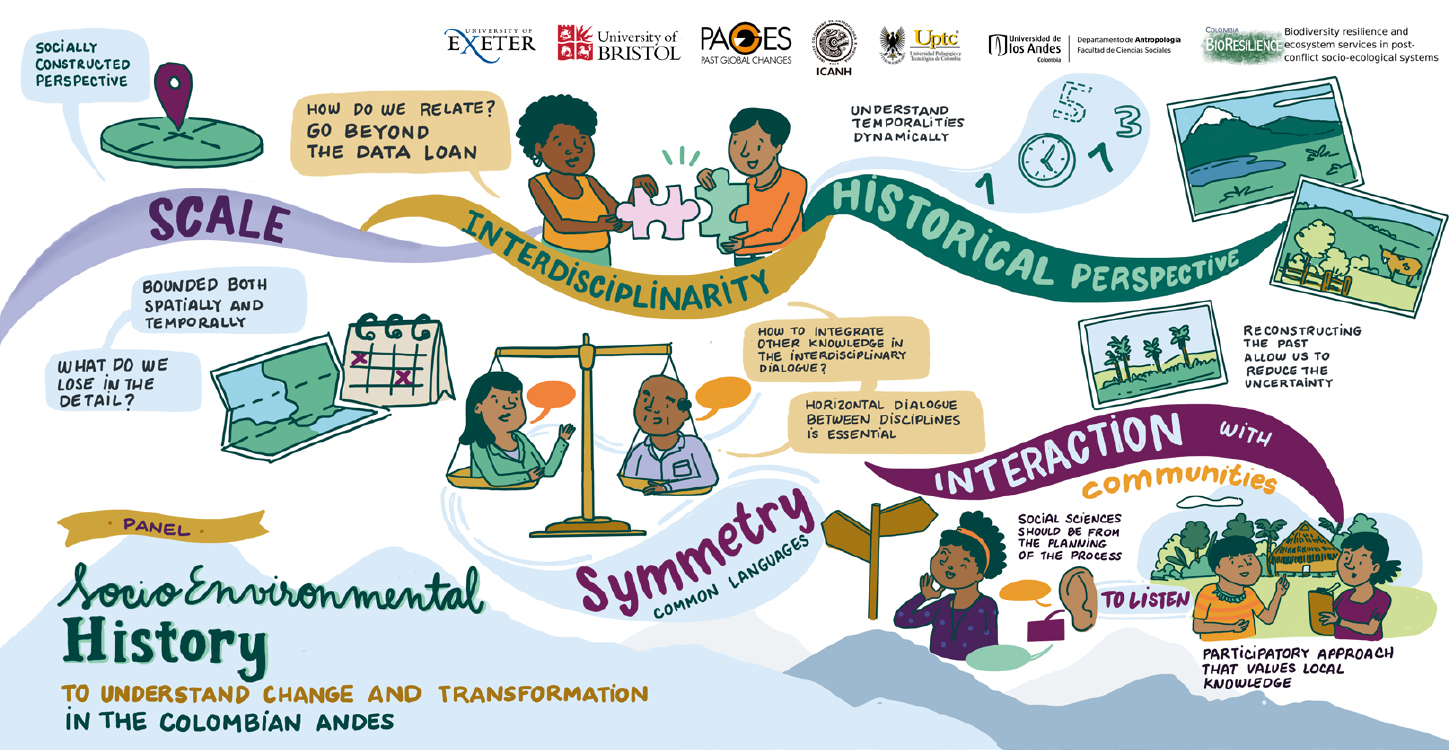
During the event we also experimented with "real-time illustrations" to summarize the discussions (Fig. 1). These six illustrations were widely distributed and shared among participants and the general public.
 |
|
Figure 1: A real-time illustration made at the meeting following working group discussions on integration frameworks that could bring social and natural sciences together. |
On the first day, the central theme was socio-environmental history, with the aim of understanding change and transformation in the Colombian Andes, thereby fostering a dialog between biophysical and social sciences. Introductory talks by Dunia Urrego and Henry Hooghiemstra, and the panel discussion moderated by Monica Amador, led the audience to reflect on the importance of temporal and spatial scales in studying the past. Some observations and comments led to the identification of pathways for integrating disciplines of the social and biophysical sciences into socio-environmental history. These discussions during the plenary session sparked a debate within the working groups where experts and attendees addressed possibilities of integrating knowledge, but also some of the assumptions that are made within the various disciplines regarding our interpretation of the interactions between humans and non-humans in the past (Fig. 1).
Following the same methodology, the second day was dedicated to addressing the relationships between socio-environmental history and public policy. This session began with Naomi Millner, who spoke on social aspects of socio-environmental history within the BioResilience research project (blogs.exeter.ac.uk/bioresilience), followed by Sonia Archila who presented a multi-species perspective on socio-environmental history. The panel of experts moderated by Nicolás Loaiza and Mónica Amador encouraged the interdisciplinary discussion on how a placed social and environmental history could be a tool to manage natural resources and integrate policymakers and stakeholders. For the plenary session with experts, the discussions highlighted the importance of integrating knowledge between different academic disciplines and local communities to improve our understanding of the long history of the territories. Extending historical projections of the landscapes could allow us to determine when laws were formulated and understand the public policy of each territory. All the presentations and discussions were recorded and transcribed, and will be synthesized into a document that condenses the meeting's outcomes. This will form the basis for an academic article on interdisciplinarity in socio-environmental reconstruction and history in the Andes.
After the workshop, discussions have continued between organizers and national institutions, such as the National Institute of Anthropology (ICANH), to give continuity to these working groups in socio-environmental history. The organizing committee is aiming for a second integration meeting, in person, in 2022. The planned outcomes after the first workshop are to publish (1) video recordings for the two sessions, (2) graphic summaries created in real-time, and (3) an interdisciplinary paper gathered from the different workshop discussions.
Acknowledgements
Many thanks to the panelists and keynote speakers Dunia Urrego (University of Exeter, UK), Henry Hooghiemstra (University of Amsterdam, The Netherlands), Juan Carlos Berrio (University of Leicester, United Kingdom), Katherinne Mora (Universidad Pedagógica y Tecnológica de Colombia), Javier Aceituno (Universidad de Antioquia, Colombia), Naomi Millner (University of Bristol, United Kingdom), Sonia Archila (Universidad de los Andes, Colombia), Andres Etter (Universidad Pontificia Javeriana, Colombia), Olga Lucia Hernandez (Instituto von Humboldt, Colombia), Hermán Amaya (Copoboyacá, Colombia), and Nicolás Loaiza (Instituto Colombiano de Antropología e Historia), and all moderators and the logistical team behind the screens. We also thank PAGES and the BioResilience research project for their support.
Affiliations
1College of Life and Environmental Sciences, University of Exeter, UK
2School of Geographical Sciences, University of Bristol, UK
contact
Felipe Franco-Gaviria: J.Franco-Gaviria exeter.ac.uk
Eugenia M. Gayo![]() 1,2, M. Lima
1,2, M. Lima![]() 1,3, J. Freeman
1,3, J. Freeman![]() 4, E. Robinson
4, E. Robinson![]() 4 and C. Latorre
4 and C. Latorre![]() 2,3
2,3
Online, 25-26 March 2021
The PEOPLE 3000 (pastglobalchanges.org/people3000) working group aims to understand how the interplay between human population growth, upscaling in social complexity, and climate variability might have driven resilience or collapse of socio-ecological systems during the Holocene. By integrating long-term timeseries for ecological, climatic, and demographic trends under common mathematical frameworks, we formally evaluate convergences/divergences in feedback loops between biophysical and social systems in different regions of the globe. We are thereby interested in exploring explanations beyond statistical correlations between human population change, climate variability, and anthropogenic land use, based on modeling theoretical climate–ecosystem–population feedback relationships.
One of the modeling approaches that we have developed to explain the trajectory of Holocene SES is based on the Population Dynamic Theory (PDT), which allows us to test empirically for the interplay between climate, ecosystem and population processes. PDT proposes that the impact of climate variability on human populations cannot be evaluated independently of demographic levels. Simply put, climatic conditions affect food production, which in turn set the carrying capacity (k). Clearly, unfavorable conditions necessarily affect k through resource limitation, but if the population/food production ratio is defining the per-capita share of resources as well as competition strength, the availability of a limiting factor will decrease regardless of the effect of climate on food production. This implies that even small changes in a relevant climate variable might trigger disproportionate impacts in population growth rates. We have begun to explore this kind of dynamic in several past populations from the Americas and Polynesia (Bird et al. 2020; Lima et al. 2020).
 |
|
Figure 1: (A) Paleo-population levels inferred for the Atacama Desert from the summed probability distribution (SPD) of radiocarbon dates. (B) Population growth rates during the period 3300-2150 cal yr BP. |
Our last workshop before the final PEOPLE 3000 synthesis, "Understanding long-term human-environment feedback loops through the integration of archaeology, paleoclimate and ecological models" (pastglobalchanges.org/calendar/26995) was held virtually due to restrictions of the ongoing COVID-19 pandemic. This activity aimed to expand our number of case studies by establishing collaborative strategies to integrate ecological, climate and demographic proxy data into a PDT framework for addressing the question: Does human population size and/or rates of change better correlate with climate driven changes in ecosystem structure, diversity or functionality?
Through keynote and flash-poster presentations, we discussed approaches for extracting refined paleodemographic signals from archaeological radiocarbon timeseries as well as trends for anthropogenic land-use changes from paleoecological archives. We established synergies with researchers from other complementary initiatives, e.g. LandCover6k (pastglobalchanges.org/landcover6k), Paleoclimate Modelling Intercomparison Project (PMIP; pmip.lsce.ipsl.fr) and Humans on Planet Earth (HOPE; www.uib.no/en/rg/EECRG/107501/hope) for assessing human-environment feedback loops based on the integration of our PEOPLE 3000 radiocarbon database (Bird et al. 2021) and global paleoenvironmental datasets collated previously by our collaborators.
A manuscript has been outlined that will allow us to explore relationships between technological innovations and population growth in past agrarian societies from around the world. For the case presented in Figure 1, accelerated growth rates occurred as population sizes increased in the inland Atacama Desert and the adoption of agriculture spurred on new forms of cooperation among individuals (i.e. pottery, metal-working, irrigation, pastoralism). Nevertheless, as population sizes approached the higher k set by agriculture, growth rates started to decrease due to the interplay between population levels and increased competition strength.
Breakout sessions on the second day were dedicated to discussing the future of PEOPLE 3000. Directions for a new Phase 2, which launched in August 2021, focus on exploring coevolutionary relationships between social organization, changes in human populations, and disturbance regimes over the Holocene. Phase 2 will broaden our number of case studies by including early-career researchers from traditionally under-represented regions in paleoscience that attended the workshop, and delve further into new computational tools available for the paleoenvironmental record (e.g. Neotoma). New collaborations with other initiatives such as LandCover6k, PMIP and HOPE will help develop novel synergies to examine mechanisms proposed to explain the variable deep histories of resilience (or lack thereof) observed in past socio-ecological systems.
Acknowledgements
PAGES, Fondecyt 1180121, ANID_PIA AFB170008, ANID_Millenium Initiative UPWELL NCN19_153, ANID_PIA/BASAL FB0002
Affiliations
1Center of Applied Ecology and Sustainability (CAPES), Pontifical Catholic University of Chile, Santiago, Chile
2Millennium Nucleus UPWELL, Concepcion, Chile
3Department of Ecology, Pontifical Catholic University of Chile, Santiago, Chile
4Anthropology Program, Utah State University, Logan, UT, USA
contact
Eugenia M. Gayo: emgayouc.cl
references
Bird D et al. (2020) Holocene 30: 1345-1359
Julie A. Hoggarth1, C. Latorre![]() 2, J. Freeman
2, J. Freeman![]() 3, E. Robinson
3, E. Robinson![]() 4, E. Gayo
4, E. Gayo![]() 5 and D. Bird6,7
5 and D. Bird6,7
Understanding what makes some socio-ecological systems (SES) more resilient to changing disturbance regimes (e.g. the length of fire season caused by abrupt climate change) is integral to explain long-term patterns in the development of human societies over the past 3,000 years. The PAGES PalEOclimate and the PeopLing of Earth (PEOPLE 3000; pastglobalchanges.org/people3000) working group explores this question by integrating archaeological data, paleoecological data, and dynamic modeling (Fig. 1) to identify regionally comparative case studies across the world.
Humans adapt to natural conditions, including variability in climate systems, over time with each generation inheriting ecological and cultural knowledge. Drawing from niche construction theory, we further argue that humans modify selection pressures in their environments that affect both humans and other species (Odling-Smee et al. 2003). As disturbances may change over time, an SES may become vulnerable when those changes extend outside of the range held within the cultural and ecological memory of a society.
More flexible systems may improve the resilience of SESs over even highly productive but rigid systems. Using radiocarbon datasets as proxies of populations, Freeman et al. (2021) explored whether systems with greater variability in production developed differing population stability patterns than those with more landscape engineering over time. They found that agricultural societies that relied on landscape engineering to intensify production and control variability of production experienced the most stability and the least severe population declines during times of environmental stress.
 |
|
Figure 1: Conceptual diagram of PEOPLE 3000, showing the three areas of archaeology, dynamic models, and paleoecology that are integrated in the project. |
Scientific goals and activities
The PEOPLE 3000 working group has three primary goals: (1) to develop low- and high-precision coupled records of paleoclimate, human population, and human institutions over the last 3000 years; (2) compare changes in population, paleoclimate, and institutions from region to region; and (3) identify regionally comparative patterns to explain relationships between variation in ecosystem change, subsistence and social diversity, and the severity of social-ecological reorganization. To explore these questions, we are building a global data infrastructure for comparing patterns of human population ecology. To date, in Phase 1 of PEOPLE 3000, this has taken the form of a global radiocarbon database, compiling, and curation of over 150,000 radiocarbon dates from around the world and developing protocols for using those data (Bird et al. 2021).
PEOPLE 3000's goals in Phase 2 of the project are to integrate radiocarbon and paleoecological/ paleoenvironmental data, as well as information on social institutions, to develop coevolutionary models on carrying capacity, social integration, and data from paleoclimate and paleoecology. To date we have collected data from 17 core case study regions and will work on issues of quality control and integrating data from each region.
PEOPLE 3000 is currently seeking members from around the world. We will hold open online meetings each May to present research findings from individual members and to recruit new case studies. Visit the PEOPLE 3000 website at pastglobalchanges.org/people3000 and sign up to the mailing list to be contacted by us on our upcoming meetings and activities.
Upcoming activities
We held a hybrid meeting to wrap up Phase 1 of the project in November 2021 (pastglobalchanges.org/calendar/27099), with separate working groups meeting in individual countries and communicating over Zoom. Our first online meeting of Phase 2 will take place in May 2022, open to all PEOPLE 3000 members and interested researchers.
Affiliations
1Department of Anthropology and Institute of Archaeology, Baylor University, Waco, TX, USA
2Departamento de Ecología, Pontificia Universidad Católica de Chile, Santiago, Chile & Institute of Ecology and Biodiversity, Santiago, Chile
3Anthropology Program and The Ecology Center, Utah State University, Logan, UT, USA
4Department of Anthropology and Center for Applied Archaeological Science, Boise State University, ID, USA
5Millennium Nucleus UPWELL & Center of Applied Ecology and Sustainability (CAPES), Santiago, Chile
6Department of Anthropology, Washington State University, Pullman, WA, USA
7Max Planck Institute for the Science of Human History, Jena, Germany
contact
Julie Hoggarth: Julie_Hoggarthbaylor.edu
Claudio Latorre: clatorrebio.puc.cl
references
Odling-Smee FJ et al. (2003) Niche construction: The neglected process in evolution. Princeton University Press, 488 pp
Marie-Eve Monchamp![]() 1,2, L. Armbrecht
1,2, L. Armbrecht![]() 3,4, E. Capo
3,4, E. Capo![]() 5, M.J.L. Coolen
5, M.J.L. Coolen![]() 6, T. Cordier
6, T. Cordier![]() 7, I. Domaizon
7, I. Domaizon![]() 8, L.S. Epp
8, L.S. Epp![]() 9, C. Giguet-Covex
9, C. Giguet-Covex![]() 10, I. Gregory-Eaves
10, I. Gregory-Eaves![]() 1,2, U. Herzschuh
1,2, U. Herzschuh![]() 11, L. Parducci
11, L. Parducci![]() 12, K.R. Stoof-Leichsenring
12, K.R. Stoof-Leichsenring![]() 11 and J.W. Williams
11 and J.W. Williams![]() 13
13
PaleoEcoGen is a new working group that was launched with the aim of bringing together scientists from around the world who use ancient environmental DNA (ancient eDNA) as a novel proxy to examine the response of past biological communities to environmental changes (pastglobalchanges.org/paleoecogen). We are particularly interested in exploiting the added value of these emerging ancient eDNA tools to advance our knowledge of critical transitions in Earth's Quaternary history. To this end, we aim to stimulate and enhance international ancient eDNA research by organizing topical workshops to discuss new methodologies in the field (including synthetic analyses and modeling approaches), and to coordinate research efforts for bigger picture analyses that, ultimately, will help to inform conservation efforts and future biodiversity assessments.
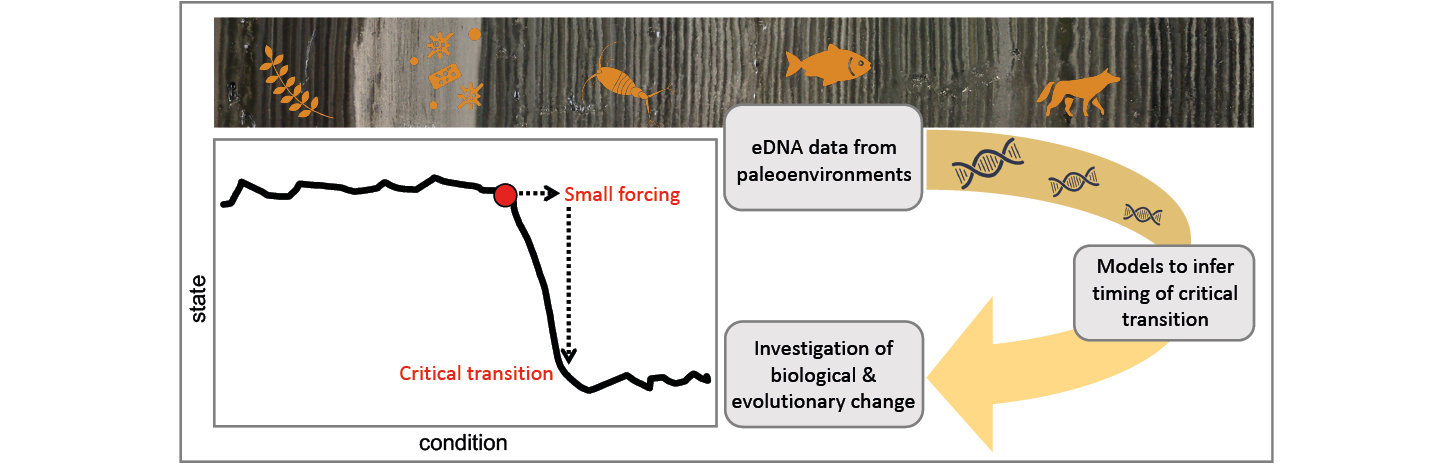
Changes in ecosystem dynamics can occur gradually over centuries to millennia, or abruptly (i.e. at decadal to annual timescales). Rapid changes may challenge the fitness and survival of organisms, including those that are essential for ecosystem maintenance. Even small disturbances may weaken the stability and resilience of an ecosystem (Fig. 1), and ultimately lead to "critical transitions" where the system is pushed from one equilibrium state to another (Taranu et al. 2018). These "tipping points" are often hard to predict because of the complexity of the interactions between organisms and their environment, and they imply prolonged ecosystem consequences that may not be reversible.
 |
|
Figure 1: (Left) Schematic representation of a critical transition between two states triggered by a small forcing. (Right) Simplified workflow of the proposed approach to identify past critical transitions and evaluate subsequent biological changes based on ancient environmental DNA timeseries. |
Critical transitions have been documented for terrestrial and aquatic ecosystems, as well as social-ecological systems, and they have been studied across many scientific disciplines (Scheffer et al. 2009; 2012). In the context of global changes, especially the "Great Acceleration" (Steffen et al. 2015), studying critical transitions has been identified as a priority in paleoecological research by the scientific community (Seddon et al. 2014). With new methodological approaches on the rise in the paleosciences, we now have the opportunity to describe past critical transitions and their effects on biological communities (Taranu et al. 2018; Capo et al. 2021).
Our working group is motivated to address two key questions:
- How can we use (sedimentary) ancient eDNA timeseries to better identify and characterize past critical transitions?
- What are the subsequent evolutionary and ecological trajectories, and which projections for future biodiversity and ecosystem change can be drawn from past critical transitions during the Quaternary?
The detailed study of critical transitions in paleoecology requires the generation of the most comprehensive view possible—of an ecosystem, its drivers, and their interactions. To meet this challenge, stratigraphic analysis of ancient eDNA is a key analytical approach because of its potential to provide new insights into: (1) the composition of biological communities across multiple trophic levels including organisms that do not fossilize; (2) species interactions within communities; and (3) the response of organisms, from individual taxa to communities, to past environmental changes (Coolen et al. 2013; Domaizon et al. 2017; Schulte et al. 2021; Liu et al. 2021). Like any other proxy, ancient eDNA has its limitations (Capo et al. 2021), but the field is now sufficiently mature to offer exciting new opportunities to expand our knowledge using paleoenvironmental data.
Upcoming activities
Our first online workshop will be in 2022 in collaboration with the sedaDNA scientific society (ercapo.wixsite.com/sedadna-society). The workshop will be dedicated to improving inclusion of African ancient eDNA researchers by offering a collaborative platform and training opportunities in molecular techniques applied to sedimentary ancient eDNA. A second workshop (in-person or online, depending on COVID-19 pandemic regulations) will focus on developing a multivariate modeling approach based on ancient eDNA temporal data (Taranu et al. 2018) to investigate the timing and magnitude of shifts in paleoenvironmental records.
Visit our website (pastglobalchanges.org/paleoecogen) and register to our mailing list to keep up to date with our activities and find out how to get involved. PaleoEcoGen is also on Twitter: @PaleoEcoGen
Affiliations
1Department of Biology, McGill University, Montreal, Canada
2Groupe de recherche interuniversitaire en limnologie (GRIL), Montreal, Canada
3Australian Centre for Ancient DNA, School of Biological Sciences, The University of Adelaide, Australia
4Institute for Marine and Antarctic Studies, Centre for Ecology and Biodiversity, Tasmania, Australia
5Department of Aquatic Sciences and Assessment, Swedish University of Agricultural Sciences, Uppsala, Sweden
6Western Australia Organic and Isotope Geochemistry Centre (WA-OIGC), School of Earth and Planetary Sciences, Curtin University, Bentley, Australia
7NORCE Climate, NORCE Norwegian Research Centre AS, Bjerknes Centre for Climate Research, Bergen, Norway
8INRAE, CARRTEL, USMB, Thonon les bains, France
9Limnological Institute, Department of Biology, University of Konstanz, Germany
10Environnements Dynamiques et Territoires de la Montagne, Université Savoie Mont Blanc, Le Bourget du Lac, France
11Alfred Wegener Institute Helmholtz Centre for Polar and Marine Research, Potsdam, Germany
12Department of Environmental Biology, La Sapienza University of Rome, Italy
13Department of Geography, University of Wisconsin, Madison, WI, USA
contact
Marie-Eve Monchamp: me.monchampgmail.com
references
Capo E et al. (2021) Quaternary 4: 1-58
Coolen MJL et al. (2013) Proc Natl Acad Sci USA 110: 8609-8614
Domaizon I et al. (2017) J Paleolimnol 58: 1-21
Liu S et al. (2021) Nat Commun 12: 2995
More KD et al. (2018) Earth Planet Sci Lett 496: 248-256
Scheffer M et al. (2009) Nature 461: 53-59
Scheffer M et al. (2012) Science 338: 344-348
Schulte L et al. (2021) Mol Ecol Resour 21: 801-815
Seddon AWR et al. (2014) J Ecol 102: 256-267
Julia C. Hargreaves
The Past to Future Working Group enables paleoclimate information from both PMIP models and climate proxies to be used to better constrain predictions of future climate change.
Strategy
The Past to Future Working Group (P2F; pmip.lsce.ipsl.fr/working_groups/Past2Future) was formed to enable paleoclimate information from both PMIP models and climate proxies to be used to better constrain predictions of future climate change. The remit of the group is wide; in principle any spatial and temporal scales of change and any metric of the climate system may be considered. Here we mostly focus on the equilibrium response of the climate system. In this context, the most significant progress over the last few years has been made in better defining and constraining climate sensitivity. Related work focusing on variability is reported elsewhere in this issue. Paleoclimate model simulations were included in the fifth iteration of the Climate Model Intercomparison Project (CMIP5), making this the first time that ensembles of historical, paleo, and future projections were run with the same model versions. In anticipation of this, the P2F group was initiated at the 2012 PMIP3 workshop in Crewe, UK (Crucifix et al. 2012). The overarching purpose of the group was to encourage the use of paleoclimatic information to improve predictions of climate change.
As a cross-cutting group, the main focus of P2F was to facilitate research activities. The working group website was used to improve accessibility to outputs from model simulations and data from climate proxies, and to highlight relevant publications in the field. The main meeting point has been at the European Geophysical Unuin General Assembly, where there have been a variety of EGU sessions with a focus on Past to Future activities. There have also been several workshops with a significant Past to Future element. Connections between the Cloud Feedback Model Intercomparison Project (CFMIP; cfmip.org) and PMIP have strengthened through the activities of the working group. Joint experiments have been planned; scientists from CFMIP have given keynote presentations at PMIP (and vice-versa); and there are a number of scientists who are active in both MIPs.
The status of early research focused on combining models and data from paleoclimates to constrain predictions of future climate change is well described by Schmidt et al. (2014). This paper outlines various methodologies, illustrated by examples, each of which "uses a specific target (or targets) from a palaeo-climate reconstruction of change that is within the scope of the modelled system, defines a metric of skill that quantifies the accuracy of the modelled changes and assesses the connection to a future prediction". The P2F group promoted a very similar methodology for using the CMIP ensemble, and additionally, highlighted a number of research targets, including:
- Estimating future climate by exploring information from multiple PMIP intervals;
- Exploring divergent estimates of climate sensitivity—towards reconciliation; and
- Predicting regional climate change—going beyond climate sensitivity.
Achievements
Climate sensitivity is the equilibrium global temperature change resulting from a doubling of the atmospheric carbon dioxide concentration. Estimation of climate sensitivity has been the main focus for quantitative P2F research using statistical methods. The recent community assessment of climate sensitivity by Sherwood et al. (2020) included a substantial paleoclimate component and involved several P2F members working alongside researchers with primary expertise in the interpretation of paleodata. Results from PMIP activities influenced almost every aspect of the paleoclimate component of the assessment.
 |
|
Figure 1: (A) Reconstruction of Last Glacial Maximum surface air temperature anomaly (ºC) based on multi-model regression. Proxy data are represented as colored dots. (B) Uncertainty in Last Glacial Maximum surface air temperature anomaly (ºC) from bootstrap resampling. Results presented as half-width of 95% confidence interval (Fig. 1 and 3 from Annan and Hargreaves 2013). |
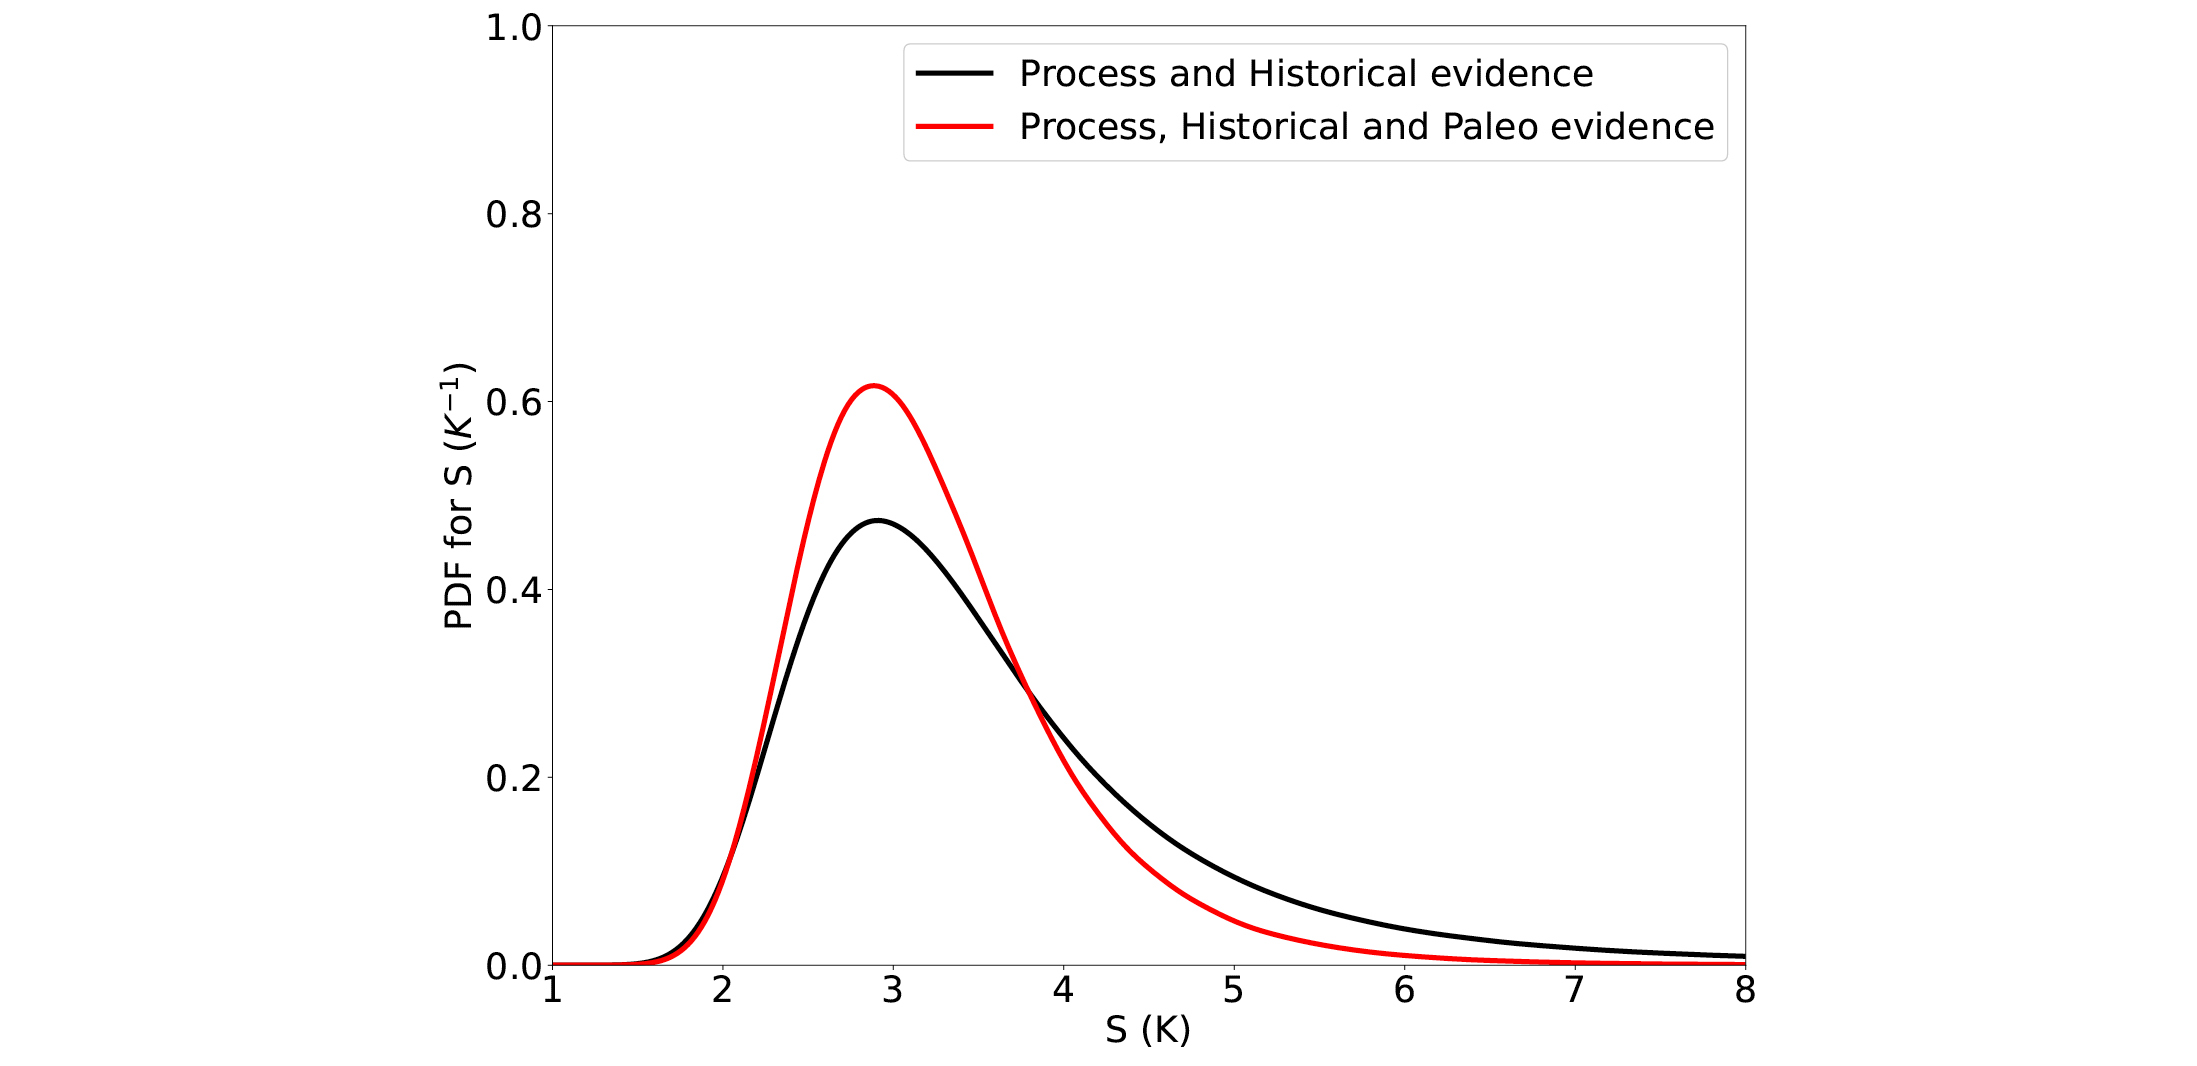
For example, in order to estimate climate sensitivity using paleoclimates, an estimate of the large scale temperature changes for paleoclimates relative to modern is required. Figure 1 shows a reconstruction of the Last Glacial Maximum temperature anomaly that was included in the evidence for the assessment. This estimate (from Annan and Hargreaves 2013) was a result of the P2F working group activities, and combined information from the PMIP2 ensemble and from climate proxy compilations (MARGO Project Members 2009; Bartlein et al. 2011; Schmittner et al. 2011). Uncertainty estimates are critical to these kinds of assessments, and the estimated uncertainties in this reconstruction are shown in the lower sub-figure. Figure 2 shows the baseline result from Sherwood et al. (2020), and the result that would be obtained if paleoclimate information was, instead, entirely ignored. It is clear that the paleoclimatic component significantly constrains the high end of the assessed range for climate sensitivity.
The assessment also made significant progress on one of the other goals of the working group: reconciling the previously divergent estimates of climate sensitivity from different constraints, which were found to be due in part to the pattern effect (Andrews et al. 2018) and some differences in the precise definitions of climate sensitivity that had been used. An emergent constraint is the term used to describe model variables for which measurements are available which may, through use of the multi-model ensemble, be used to refine probabilistic estimates of future climate change given certain emissions forcings. Members of the working group have further developed the use of emergent constraints to estimate climate sensitivity. Initial work focused on analyzing correlations between the Last Glacial Maximum (LGM) temperature anomaly and climate sensitivity, with the mid-Pliocene considered more recently (e.g. Hargreaves et al. 2012; Hopcroft and Valdes 2015; Hargreaves and Annan 2016). Recently Renoult et al. (2020) presented a Bayesian framework for combining emergent constraints from different periods, potentially including non-paleo emergent constraints. This method makes all assumptions explicit and enables emergent constraints to be incorporated into assessments of climate sensitivity, although some caveats remain.
 |
|
Figure 2: Estimated PDFs for climate sensitivity (S) with and without using paleo information, based on the values estimated by Sherwood et al. (2020). The baseline 66% range not including paleo information was 2.6–4.6 K. Including the paleoclimatic constraint, the range tightens to 2.6–3.9 K. |
Progress in regional climate change has usually been more qualitative and process based (e.g. Schmidt et al. 2014; Koh and Brierley 2015; Seth et al. 2019). Large-scale changes such as Arctic amplification and land–ocean contrast may be expected to be useful for constraining future climate but direct temperature comparisons have not so far indicated robust past–future relationships in the ensembles. However, detailed analyses of the processes involved in Arctic amplification may enable particular seasons for particular paleoclimate intervals to be used as constraints (LGM: Laîné et al. 2016; mid-Holocene: Yoshimori and Suzuki 2019). There is also potential for Arctic ice extent to be used to constrain likely future Arctic sea-ice changes (Last Interglacial: Kageyama et al. 2021). The merger of P2F with Paleovar (to make P2Fvar) in PMIP4 has increased the range of spatial and temporal scales being studied (Rehfeld et al. 2020; Brown et al. 2020; D'Agostino et al. 2020), a trend which we hope to see continue.
In addition to developing the more regional focus, the simulations of the last deglaciation which have been performed within PMIP have the potential to develop towards a new P2F activity of directly paleoclimate-constrained projections, as modelers extend the deglaciation runs into the next centuries (Fieg et al. 2021).
In summary, even with relatively few scientists working primarily in this area, the group is able to use the resources of PMIP, CFMIP, and CMIP, and has been very successful in raising the profile of paleoclimate as a topic of increasing interest to a wide range of researchers.
Affiliation
Blue Skies Research Ltd, Settle, UK
contact
Julia C. Hargreaves: julesblueskiesresearch.org.uk
references
Andrews T et al. (2018) Geophys Res Lett 45: 8490-8499
Annan JD, Hargreaves JC (2013) Clim Past 9: 367-376
Bartlein P et al. (2011) Clim Dyn 37: 775-802
Brown JR et al. (2020) Clim Past 16: 1777-1805
Crucifix M et al. (2012) Eos 93: 539-539
D'Agostino R et al. (2020) J Clim 33: 9595-9613
Fieg R et al. (2021) EGU General Assembly 2021, 19-30 Apr 2021, EGU21–11083
Hargreaves JC, Annan JD (2016) Clim Past 12: 1591-1599
Hargreaves JC et al. (2012) Geophys Res Lett 39: L24702
Hopcroft PO, Valdes PJ (2015) Geophys Res Lett 42: 5533-5539
Kageyama M et al. (2021) Clim Past 17: 37-62
Koh JH, Brierley CM (2015) Clim Past: 11: 1433-1451
Laîné A et al. (2016) J Clim 29: 3297-3316
MARGO Project Members (2009) Nat Geosci 2: 127-132
Rehfeld K et al. (2020) Earth Syst Dyn 11: 447-468
Renoult M et al. (2020) Clim Past 16: 1715-1735
Schmidt GA et al. (2014) Clim Past 10: 221-250
Schmittner A et al. (2011) Science 334: 1385-1388
Seth A et al. (2019) Curr Clim Change Rep 5: 63-79
Kira Rehfeld![]() 1,2 and Josephine Brown
1,2 and Josephine Brown![]() 3
3
Here, we outline recent insights into interannual to decadal variability of Earth's surface climate based on PMIP experiments and comparison with future climate simulations. These studies have provided new perspectives on large-scale changes of surface climate, low- and high-latitude modes of variability, and internally versus externally forced variability.
Climate variability in past, present and future
Interannual to decadal variability of surface climate variables arises through internal dynamics in the atmosphere-hydrosphere-biosphere-cryosphere system driven by the incoming solar radiation. External forcing impacts the climate system on multiple timescales. Constant adjustment of the Earth's energy budget through feedbacks and dynamics lead to changes in the global mean temperature, regional patterns, and fluctuations around the regional mean—in other words, to climate variability. Variations in the Earth's orbit (104–103 years) change the seasonal distribution of insolation quasi-periodically, while changes in solar luminosity (103–101 years) modulate the overall energy input to the system. At the same time, explosive volcanic eruptions stochastically perturb the system on seasonal to interannual timescales.
Equilibrium simulations from PMIP3 and PMIP4 allow us to examine the response of the climate system to different orbital insolation, topography, ice-sheet configurations and greenhouse-gas concentrations (Braconnot et al. 2012; Kageyama et al. 2018). Simulations for the last (pre-industrial) millennium (Jungclaus et al. 2017) have been used frequently to test the impact of solar and volcanic forcing on climate at interannual to centennial timescales. The PMIP4 working group "Past2Future: Insights from a constantly varying past" (pmip4.lsce.ipsl.fr/doku.php/wg:ptof:index) aims to improve our general understanding of climate stability through multi-model analyses of a range of climate states, focusing on large-scale patterns of change and internal modes of variability. It builds on the efforts of the PMIP3 working groups "Past to future" and "Paleovar".
Large-scale changes in simulated climate variability
The PMIP last millennium experiments have been key to improving our understanding of the role of volcanism and solar variability in driving climate variations. Studies incorporating both proxy and model data to assess mechanisms, blended reconstructions, and impacts on society draw on the considerable overlap between observations, and the dense proxy networks fostered by different PAGES working groups.
One key insight is that current climate models show too little variability locally, at individual observation locations. This was shown by Laepple and Huybers (2014), who investigated ocean surface temperature variability in CMIP5/PMIP3 last millennium simulations. At interannual timescales (2–5 years), no systematic offset between simulated regional temperature variability and observations could be found. However, on decadal to multicentennial timescales they observed a progressive increase in the underestimation of variability in gridbox-scale model surface ocean temperatures. On the other hand, the global mean simulated and reconstructed/observed temperature variability on interannual to multidecadal timescales are of similar magnitude over the last millennium (Laepple and Huybers 2014; Parsons et al. 2020) and the Common Era (PAGES 2k Consortium 2019). This consistency of simulated and reconstructed variability at the global scale, despite the lack of modeled regional variability at decadal and longer timescales, remains unexplained.
PMIP experiments targeting time periods prior to the late Holocene include a range of boundary conditions such as the land–sea mask, orbital parameters, greenhouse gas concentrations, and ice-sheet distribution. These experiments generally do not consider forcing on interannual to centennial timescales by changes in solar luminosity or explosive volcanism, as proxy-based reconstructions do not yet exist (and may not be possible given archive and proxy uncertainties). This implies that changes in interannual to multidecadal variability in these equilibrium simulations reflect the internal dynamical response of the climate system to the boundary conditions.
 |
|
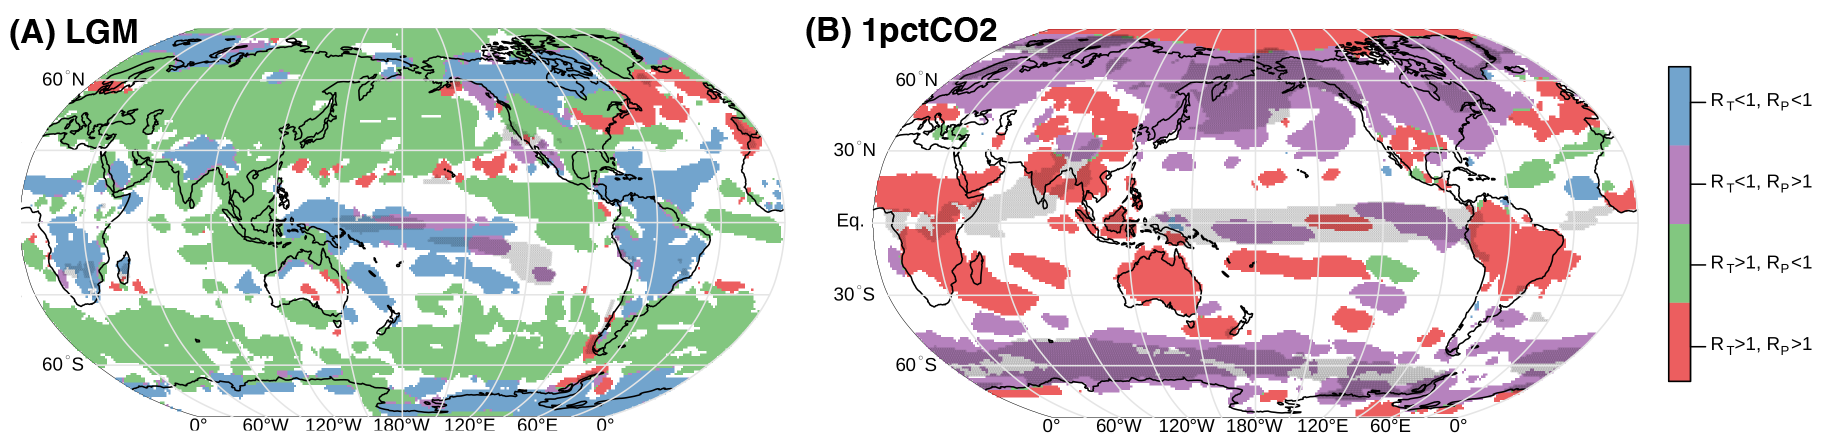
Figure 1: Temperature and precipitation variance change systematically with global mean temperature. Variance ratios (R = σscen/σpi where σpi is the standard deviation of the preindustrial control simulation and σscen is the variance of {LGM,4xCO2}) were calculated from each CMIP5/CMIP6/PMIP3 model on (A) the last 50 years of the LGM simulations and (B) years 101–150 of the 1pctCO2 increase scenarios and compared to the final 50 years of the pre-industrial simulations. All simulations were linearly detrended and variance ratios were averaged. Colors classify regions with concurrent changes in temperature (RT) and precipitation (RP) variability. Changes of less than 5% are masked as white. Black shading indicates an increase in total precipitation by more than 0.4 mm/day in the annual mean. Visualization by J. Bühler based on data from Rehfeld et al. (2020). |
Interannual to multidecadal variability changes systematically across equilibrium simulations for the LGM, the mid-Holocene, and for idealized warming scenarios (abrupt4xCO2 and 1pctCO2; Taylor et al. 2012). Figure 1 illustrates the large-scale and mirroring changes between interannual to decadal temperature and precipitation variability in the LGM and 1pctCO2 cases. At the global scale, the colder climate is characterized by more variability in temperature and less in precipitation in most regions. The warming scenario is associated with increasing temperature and precipitation variability across the tropics and subtropics. Changes follow a contrasting land–sea pattern. Spectral analysis showed that these general patterns hold from seasonal to multidecadal timescales across the PMIP3/CMIP5/CMIP6 model ensemble (Rehfeld et al. 2020).
Changes in modes of climate variability
Many studies have investigated changes in the El Niño Southern Oscillation (ENSO) characteristics in PMIP experiments. Zheng et al. (2008) compared multiple models for paleoclimate (PMIP2 LGM, mid-Holocene experiments) and future simulations, finding relationships between the tropical Pacific mean state and ENSO amplitude, as well as a reduced mid-Holocene ENSO variability. An and Choi (2014) compared ENSO in PMIP2 and PMIP3 mid-Holocene experiments and found a significant reduction in ENSO amplitude for PMIP2 models but only a marginal reduction in PMIP3 models due to competing processes, with weakened air–sea coupling leading to suppressed ENSO but weakening of the annual cycle over the tropical eastern Pacific supporting intensified ENSO.
Using an ensemble of PMIP3 and PMIP4 mid-Holocene experiments, Brown et al. (2020) found a consistent reduction in ENSO amplitude of 7% for PMIP3 models and 10% for PMIP4 models relative to pre-industrial ENSO amplitude. Comparison of mid-Holocene proxy records and PMIP3 simulations showed that models underestimated the reduction in ENSO amplitude compared with proxy reconstructions (Emile-Geay et al. 2016). Investigation of PMIP4 last interglacial experiments showed a stronger reduction in ENSO amplitude of around 20%, consistent with the larger seasonal insolation anomalies than the mid-Holocene experiments (Brown et al. 2020).
 |
|
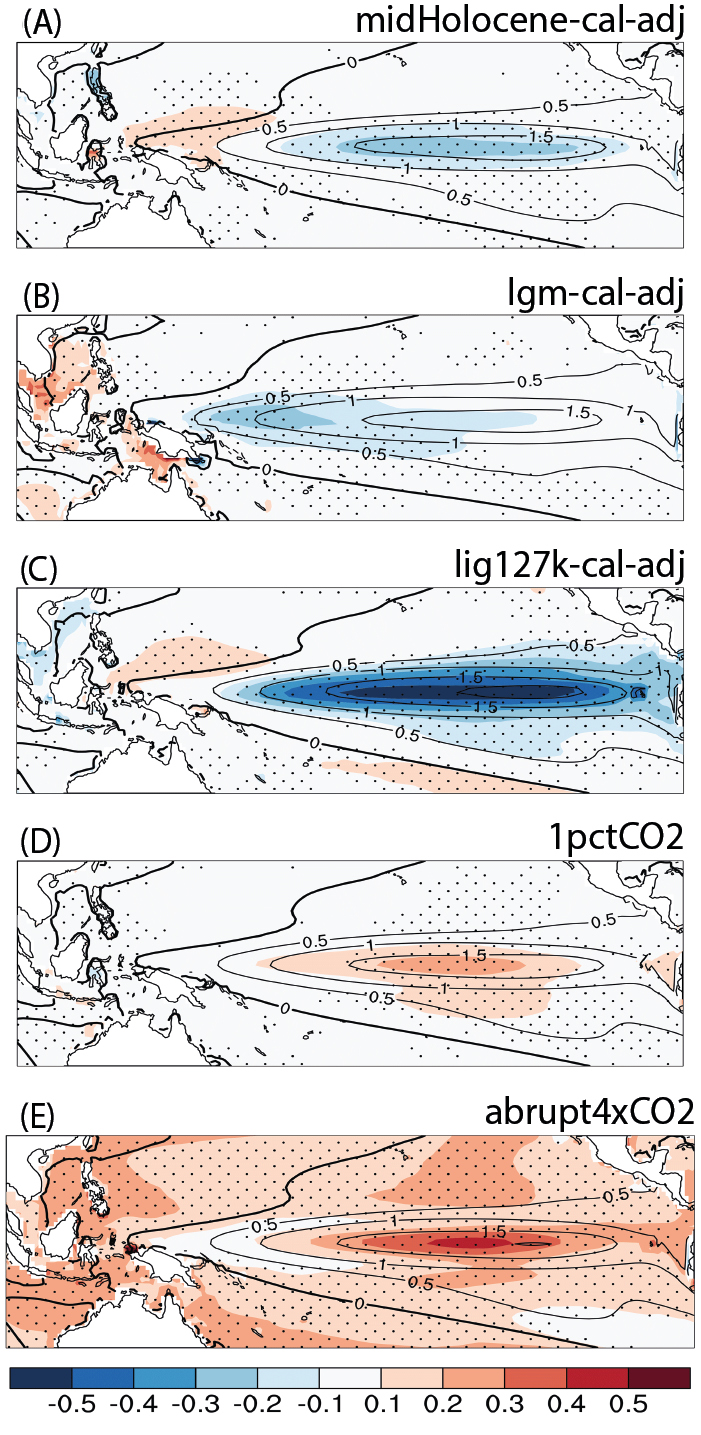
Figure 2: Changes in SST variability associated with ENSO for PMIP and CMIP experiments. The ensemble mean difference between the SST composites in each model during El Niño minus La Niña (defined as ±1 standard deviation) in the (A) midHolocene, (B) lgm, (C) lig127k, (D) 1pctCO2 and (E) abrupt4xCO2 experiments minus the same pattern for the piControl simulations is shown. The ensemble mean ENSO SST patterns in the piControl simulations are shown as black contours. Stippling indicates that more than two-thirds of the ensemble members agree on the sign of the change. Modified from Brown et al. (2020). |
Simulations of ENSO in PMIP2 and PMIP3 LGM experiments showed a range of changes in ENSO characteristics (Masson-Delmotte et al. 2013). PMIP4 LGM simulations show no significant change in ENSO amplitude but reduced variability in the western Pacific SST variability, indicating a spatial shift in the ENSO pattern (Brown et al. 2020). Examination of ENSO in past cold and warm climates (as shown in Fig. 2) can provide insights into the relationship between changes in the mean state and ENSO variability (Saint-Lu et al. 2015), and may assist in constraining projections of future ENSO change.
Across the PMIP3/CMIP5/CMIP6 ensemble, ENSO indices showed increasing variability with warming, but the changes were not significant given the large intermodel spread (Rehfeld et al. 2020). Similarly, some other interannual to multidecadal modes of variability showed systematic, but weak, changes in variability with increasing global mean temperature across the PMIP3 ensemble. This included the boreal winter North Atlantic Oscillation and the Northern Annular Mode (weakly positive), amongst others. The Atlantic meridional and zonal modes showed decreasing variability with warming. For many of the other proposed modes of variability the integration length (typically 50–100 years) was insufficient to assess whether or not systematic changes are expected to occur with regional or global warming.
This general perspective of reduced temperature variability with warming at the global scale is consistent with the direction of temperature variability changes from a multi-proxy study targeting multicentennial to millennial timescales (Rehfeld et al. 2018). Proxy-based confirmation on shorter timescales will, however, require reduced age uncertainties, removal of confounding effects due to other climate variables, the environment, or the archive structure, and an expansion of the high-resolution proxy network.
Challenges and Perspectives
A series of interconnected challenges need to be tackled regarding the paleoclimate record and paleoclimate modeling, in order to further enhance our understanding of changes in interannual to multidecadal variability. Firstly, this entails testing the impact of centennial- to millennial-scale variations in the mean state on variability at these shorter timescales. On the modeling side this requires the incorporation of nonstationary elements such as ice sheets, biogeochemistry, and land surface processes, but also a reasonable understanding of the nature of the variability of the glacial ocean circulation. This could be facilitated by considering an ensemble of models of different complexity together to assess stabilizing and destabilizing feedbacks of low frequency changes on interannual variability.
Spatio-temporal shifts in modes operating on interannual to decadal timescales can be expected to occur with warming. This has been extensively studied for ENSO, where shifts in the frequency of different "flavors" or spatial patterns of ENSO may occur. Examination of PMIP mid-Holocene simulations suggested changes in the occurrence of Central Pacific versus Eastern Pacific events (e.g. An and Choi 2014; Emile-Geay et al. 2016). Shifts in the spatial pattern of ENSO in past climates therefore need to be considered when carrying out model–proxy comparisons. To evaluate the simulated variability, especially in pre-Holocene time periods, the proxy network needs further consolidation in time and space, in order to assess signal-to-noise ratios and distinguish model deficiencies (e.g. underestimated SST variability) from archive noise (e.g. from bioturbation, intermittency, or aliasing). The comparability of modeled and reconstructed signals could further be improved by forward modeling of tracer species (e.g. water isotopologs) in collaboration with PMIP/CMIP experiments, longer model integrations, and the inclusion of solar and volcanic forcings in experiments.
Affiliations
1Geo- und Umweltforschungszentrum, Tübingen University
2Institute of Environmental Physics, Heidelberg University, Germany
3School of Geography, Earth and Atmospheric Sciences, University of Melbourne, Australia
contact
Kira Rehfeld: kira.rehfelduni-tuebingen.de
Josephine Brown: josephine.brownunimelb.edu.au
references
An S-I, Choi J (2014) Monthly Weather Review 43: 957-970
Braconnot P et al. (2012) Nat Clim Chang 2: 417-424
Brown JR et al. (2020) Clim Past 16: 1777-1805
Emile-Geay J et al. (2016) Nat Geosci 9: 168-173
Jungclaus JH et al. (2017) Geosci Model Dev 10: 4005-4033
Kageyama M et al. (2018) Geosci Model Dev 11: 1033-1057
Laepple T, Huybers P (2014) Proc Natl Acad Sci USA 111: 16682-16687
PAGES 2k Consortium (2019) Nat Geosci 12: 643-649
Parsons LA et al. (2020) Geophys Res Lett 47: e2019GL086588
Rehfeld K et al. (2018) Nature 554: 356-359
Rehfeld K et al. (2020) Earth Syst Dyn 11: 447-468
Saint-Lu M et al. (2015) Earth Planet Sci Lett 412: 18-24
Jian Liu![]() , L. Ning
, L. Ning![]() , M. Yan
, M. Yan![]() , W. Sun
, W. Sun![]() , K. Chen
, K. Chen![]() and Y. Qin
and Y. Qin![]()
The recent progress on paleomonsoon modeling on various timescales within the five typical periods included in PMIP4 simulations are summarized in this paper. The remaining controversial issues and potential directions of the paleomonsoon modeling for future studies are also discussed.
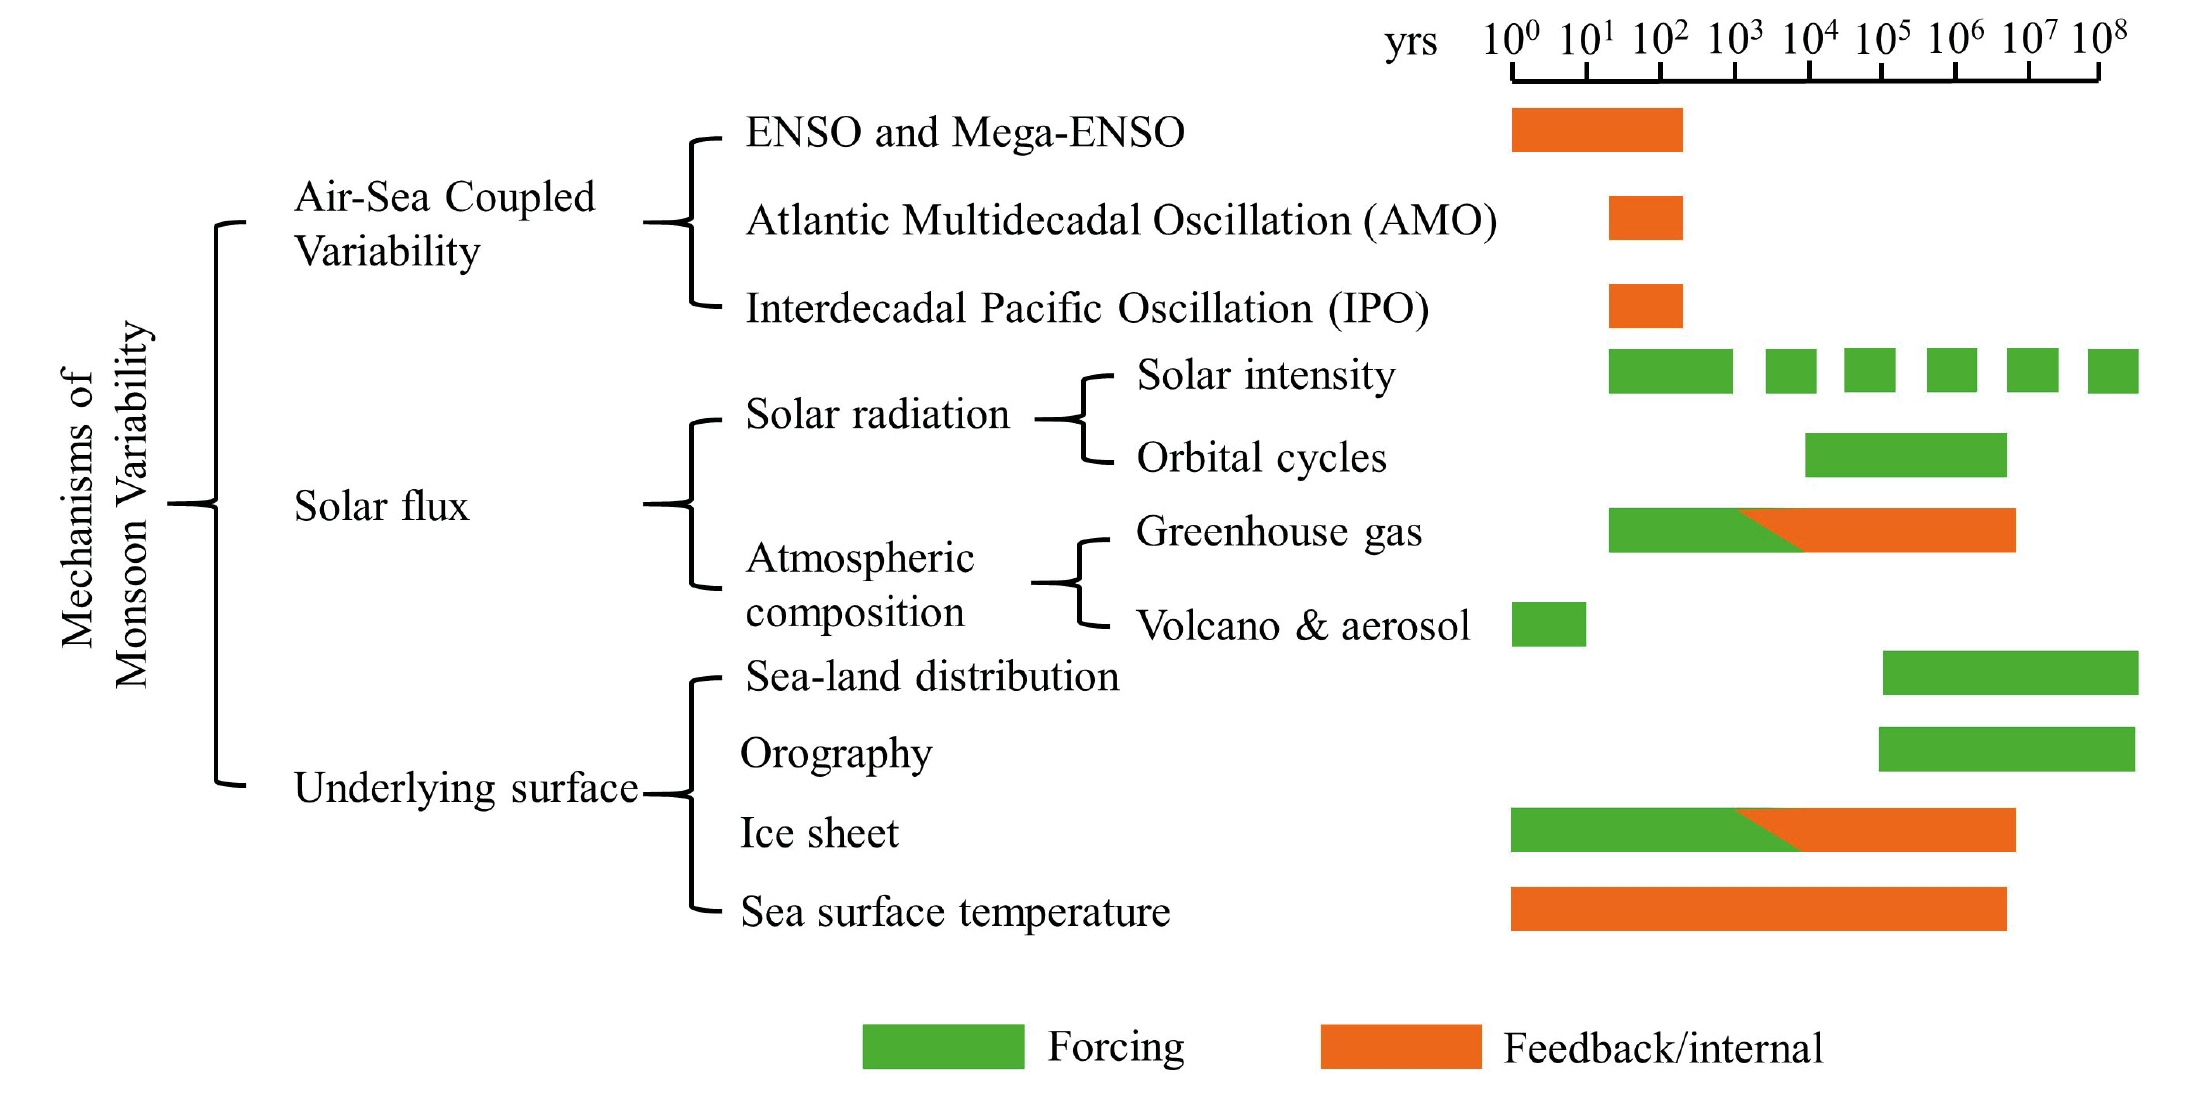
During recent decades, remarkable progress has been made on monsoon variability and physical mechanisms, both by the modern and paleoclimatic communities (Fig. 1; Wang et al. 2017). However, paleomonsoon variability on different spatiotemporal scales is a complex topic requiring more studies from both proxy reconstructions and numerical modeling simulations. Phase 4 of the Paleoclimate Modelling Intercomparison Project (PMIP4) provides unique opportunities to better understand the past changes and corresponding physical mechanisms of the paleomonsoon on different timescales using updated models, more comprehensive boundary conditions, and improved experimental protocols compared with previous PMIP phases (Kageyama et al. 2018).
 |
|
Figure 1: Mechanisms of global monsoon variability and the timescales (Fig. 6 from Wang et al. 2017). |
Last millennium
Previous paleomonsoon studies focusing on centennial changes during the last millennium (LM) have mainly compared the monsoon variability during the typical climatic periods within the LM, i.e. the Medieval Climate Anomaly (MCA) and the Little Ice Age (LIA; e.g. Jungclaus et al. 2017). Results indicate stronger (weaker) East Asian summer monsoon (EASM) and Indian summer monsoon during the MCA (LIA) due to the changes in the land–sea thermal contrast and atmospheric circulation, which were induced by total solar irradiance and volcanic eruptions. The coherent responses of monsoon systems to centennial-scale modulation of the total solar irradiance and volcanic eruptions found in both model simulations and proxy reconstructions indicate the robustness of the physical mechanisms behind this variability. However, despite the remarkable progress, it is not easy to quantitatively separate the contributions from external forcings and internal variability (Wang et al. 2017).
On the decadal timescale, monsoon variability is primarily associated with internal variability, e.g. Pacific decadal oscillation and Atlantic multi-decadal oscillation. Meanwhile, external forcings, such as volcanic eruptions, solar radiation, and land-use and land-cover change, could also influence the monsoon variability through regulating the land–sea thermal contrast, cycle of surface water, and energy balance (e.g. Qin et al. 2020). Although transient model simulations cannot exactly match the decadal monsoon phases with those found in the proxy reconstructions because models have their own initial conditions, specific events relevant to external forcings could still be reproduced through design of sensitivity experiments. Moreover, in addition to the experiments with default forcings, further experiments with different combinations of external forcings will focus on either specific periods during LM or the last two millennia in PMIP4. These will contribute to the exploration of the forcing uncertainties and the model–data comparisons on multi-scale monsoon variability (Jungclaus et al. 2017).
Mid-Holocene and last interglacial
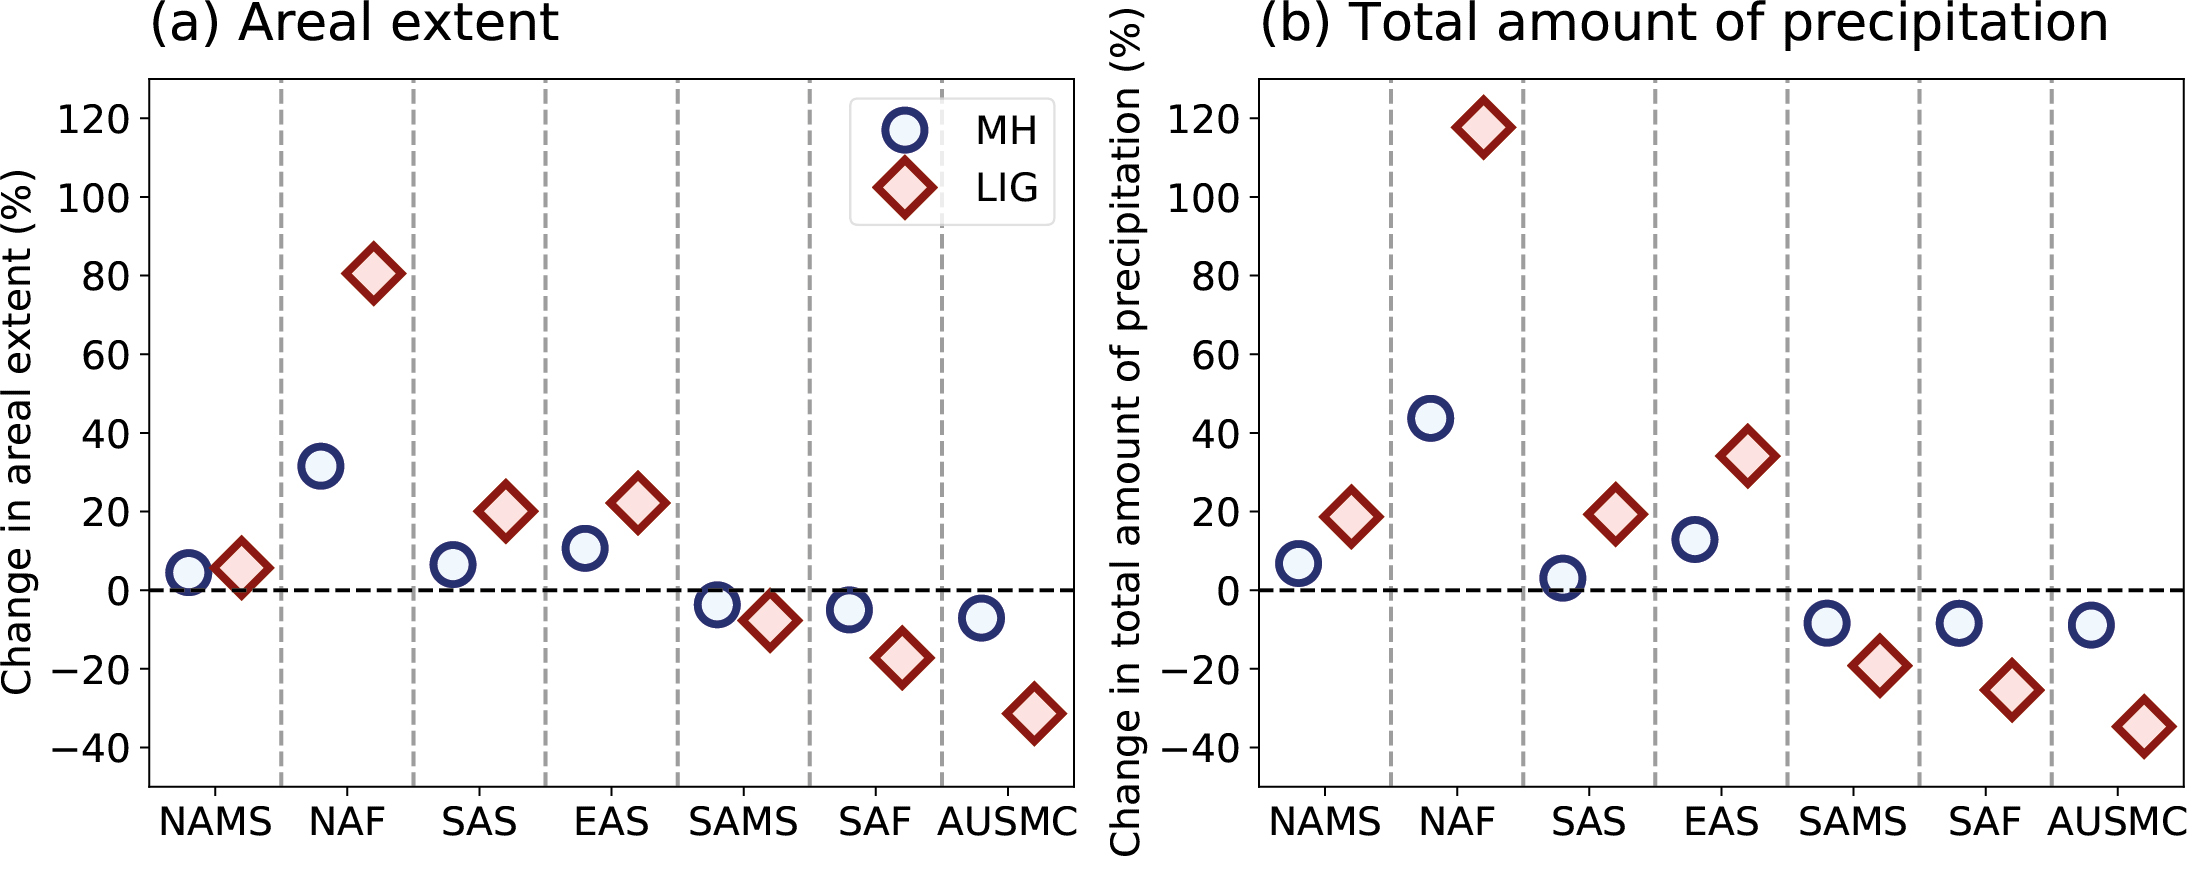
The impacts of orbital forcing on paleomonsoon variability are examined through two groups of equilibrium simulations covering two interglacial epochs with greenhouse gas (GHG) levels similar to the pre-industrial (PI) period and the continental configurations almost identical to modern period, i.e. the mid-Holocene (MH), approximately 6 kyr BP, and the last interglacial (LIG; Otto-Bliesner et al. 2017), approximately 127 kyr BP. In general, the multi-model ensemble mean results show an enhanced Northern Hemisphere monsoon and reduced Southern Hemisphere monsoon, especially for the enhanced North African and Asian monsoons, and a weaker Australian monsoon both during the MH and LIG (Fig. 2; Brierley et al. 2020; Otto-Bliesner et al. 2021). Meanwhile, because of the larger insolation anomalies during the LIG compared to MH simulations, the changes of individual monsoon systems (e.g. areal extents and total amount of precipitation) during the LIG have a greater magnitude than those in the MH (Fig. 2).
 |
|
Figure 2: Multi-model ensemble mean of (A) relative changes of areal extents and (B) relative changes in total amount of precipitation in individual monsoons from PMIP4 MH and LIG simulations. The abbreviations used to identify each regional monsoon are as follows: North America monsoon system (NAMS), North Africa (NAF), South Asia (SAS), and East Asia summer (EAS) monsoon in the Northern Hemisphere and South American Monsoon System (SAMS), southern Africa (SAF), and Australian-maritime continent (AUSMC) monsoon in the Southern Hemisphere (adapted by Anni Zhao from Fig. 7 from Brierley et al. 2020 and Fig. 16 from Otto-Bliesner et al. 2021). |
In addition to the aforementioned equilibrium simulations, several groups of transient simulations covering the entire Holocene have been carried out (e.g. Braconnot et al. 2019; Bader et al. 2020). These provide opportunities to investigate the characteristics and mechanisms behind multi-scale monsoon variability during the Holocene. These studies have suggested that the interannual- to millennial-scale monsoon variability could be influenced by internal variability, e.g. El Niño-like SST modes, Indian Ocean Dipole (IOD)-like SST modes, the AMOC, and external forcings, e.g. orbital parameters and GHGs (Braconnot et al. 2019; Crétat et al. 2020; Bader et al. 2020). For example, Braconnot et al. (2019) and Crétat et al. (2020) found that changes in orbital parameters cause long-term drying trends in the Indian and West African monsoons, but the Indian monsoon is more sensitive to anthropogenic GHGs, while ENSO and the IOD modulate the interannual-to-decadal Indian monsoon variability. Moreover, some extreme droughts that have been strongly associated with monsoon weakening, e.g. the 4.2 kyr BP event, may have been caused by both long-term drying trends (due to orbital forcing) and low-frequency fluctuations (due to internal variability).
Last glacial maximum
The last glacial maximum (LGM), approximately 21 kyr BP, provides an opportunity to investigate the impacts of changes in ice-sheet and continent extent on paleomonsoon variability (Kageyama et al. 2018). During the LGM, the reduction of summer monsoon precipitation in the Northern Hemisphere was twice as large as in the Southern Hemisphere. This asymmetric response is mainly caused by the moisture convergence feedback induced by the continental ice-sheet forcing rather than the reduction of moisture content (Cao et al. 2019). The multi-model ensemble mean results suggest that the lowered sea level may lead to expanded land area and thus an enhanced land–sea thermal contrast; this can further lead to a strengthened Australian summer monsoon in contrary to the weakened global monsoon during the LGM (Yan et al. 2018).
Mid-Pliocene
Generally, a robust enhancement of the West African, Indian, and East Asian summer monsoons was found during the mid-Pliocene (MP), approximately 3.2 million years ago, relative to the PI, consistent with geological reconstructions (Haywood et al. 2021). When the 11 model simulations are compared with geological records, a northwestward shift in the EASM's northern edge is captured, which is influenced by the intensification and westward extension of western Pacific subtropical high (Huang et al. 2019). Berntell et al. (2021) found that the multi-model ensemble mean in PlioMIP2 simulations shows a significant strengthening of the West African monsoon during the MP, with increased precipitation over the Sahel and Southern Sahara associated with the deepening of the Sahara Heat Low induced by GHG forcing.
Remaining controversial issues and potential directions
The progress made during PMIP4 discussed above has largely improved our understanding of paleomonsoon variability and the relevant physical mechanisms on various timescales. However, many specific issues remain poorly understood and could benefit from developments of the paleomonsoon modeling and model–data comparisons and syntheses, such as the relative influences of the polar ice-sheet development and the oceanic warm pool on global monsoon variability, further reduction of uncertainty for proxies already in use, and the development of new types of proxies that could identify certain features of the monsoon more accurately (Wang et al. 2017).
Such questions have motivated climatologists around the world and have given rise to strong collaborations between the paleoclimate reconstruction and modeling communities on future studies, on aspects of comparisons, synthesis, and fusion between proxy reconstructions and modeling simulations, through applications of isotope-enabled paleoclimate modeling and paleoclimate data assimilation, as well as other topics. Meanwhile, the paleomonsoon modeling community could also progress further with the help from the developments of the new generation of Earth system models, such as higher-resolution models and improved physical parameterizations, as well as incorporation of new findings from the paleomonsoon reconstruction communities, such as improved reconstructions of external forcings.
Affiliation
School of Geography, Nanjing Normal University, China
contact
Jian Liu: jliunjnu.edu.cn
references
Bader J et al. (2020) Nat Commun 11: 4726
Berntell E et al. (2021) Clim Past 17: 1777-1794
Braconnot P et al. (2019) Geophys Res Lett 46: 14,021-14,029
Brierley C et al. (2020) Clim Past 16: 1847-1872
Cao J et al. (2019) J Clim 32: 6589-6605
Crétat J et al. (2020) Clim Dyn 55: 2761-2784
Haywood AM et al. (2021) Clim Past 16: 2095-2123
Huang X et al. (2019) J Geophys Res Atmos 124: 1392-1404
Jungclaus JH et al. (2017) Geosci Model Dev 10: 4005-4033
Kageyama M et al. (2018) Geosci Model Dev 11: 1033-1057
Otto-Bliesner BL et al. (2017) Geosci Model Dev 10: 3979-4003
Otto-Bliesner BL et al. (2021) Clim Past 17: 63-94
Qin Y et al. (2020) Int J Climatol 40: 5188-5207
Daniel J. Lunt![]() 1, M. Huber2, B.L. Otto-Bliesner
1, M. Huber2, B.L. Otto-Bliesner![]() 3, W.-L. Chan4, D.K. Hutchinson5, J.-B. Ladant6, P. Morozova7, I. Niezgodzki8,9, S. Steinig1, Z. Zhang10,11 and J. Zhu3
3, W.-L. Chan4, D.K. Hutchinson5, J.-B. Ladant6, P. Morozova7, I. Niezgodzki8,9, S. Steinig1, Z. Zhang10,11 and J. Zhu3
DeepMIP has brought together the modeling and proxy communities, with an initial focus on the early Eocene climatic optimum, ∼50 million years ago. In addition to evaluating global-scale metrics such as GMST and polar amplification, mechanisms of warmth are also being interrogated.
CO2 reconstructions indicate that the closest analogs to potential 22nd-century CO2 concentrations under mid-to-low-mitigation scenarios existed tens of millions of years ago, in "deep-time". The Deep-Time Model Intercomparison Project (DeepMIP; deepmip.org) is dedicated to conceiving, designing, carrying out, analyzing, and disseminating the results of an international effort to improve our understanding of these deep-time climates. Here, deep-time climates are defined as time periods prior to the Pliocene, ∼5 million years ago. At its heart, DeepMIP aims to foster closer links between the paleoclimate modeling and data communities, grow communities of practice, develop and disseminate best practices, and to use this model–data synergy to:
- design, carry out, and analyze appropriate model simulations;
- create, collate, and synthesize proxy datasets; and
- evaluate model simulations, with a dual aim of learning about the past and informing the future.
History of DeepMIP
Prior to becoming part of PMIP, initial work was kick-started by the publication of several studies which independently modeled the early Eocene (∼50 million years ago), a time period characterized by CO2 concentrations ∼1200–2500 ppmv, global mean temperatures ∼23–30ºC, and the complete absence of ice sheets. The temperature response to the high CO2 concentrations and modified boundary conditions in the models were compared within the framework of an ad-hoc "ensemble of opportunity" (Lunt et al. 2012). Following on from this, several studies explored other aspects of these simulations, including the hydrology (Carmichael et al. 2016), implications for glaciation (Gasson et al. 2014), or the modification of model parameters (Lunt et al. 2013). However, there was a growing realization that for further progress to be made, a more formal, consistent experimental design and model intercomparison was necessary.
In 2015, in a meeting at NCAR, funded by NERC in the framework of an "International Opportunities Fund" project, the community came together to discuss such a formalization. DeepMIP was founded, and became part of PMIP. DeepMIP now has a membership of 200 scientists, with representation from the modeling as well as the marine and terrestrial proxy communities (deepmip.org/people); there have been a total of six meetings, with the most recent being online (deepmip.org/meetings).
DeepMIP activities and results so far
The first DeepMIP activity was to formally define a model experimental design for the time periods of interest. These were chosen to be the early Eocene climatic optimum (EECO), the Paleocene-Eocene Thermal Maximum (PETM), and the latest Paleocene. This experimental design was published as part of the PMIP4/CMIP6 Special Issue in GMD (Lunt et al. 2017). Following this, the time periods were more formally defined, guidelines and principles for the synthesis of proxy data and the strengths and weaknesses of various proxies were laid out, and the first version of the DeepMIP proxy database was also published (Hollis et al. 2019).
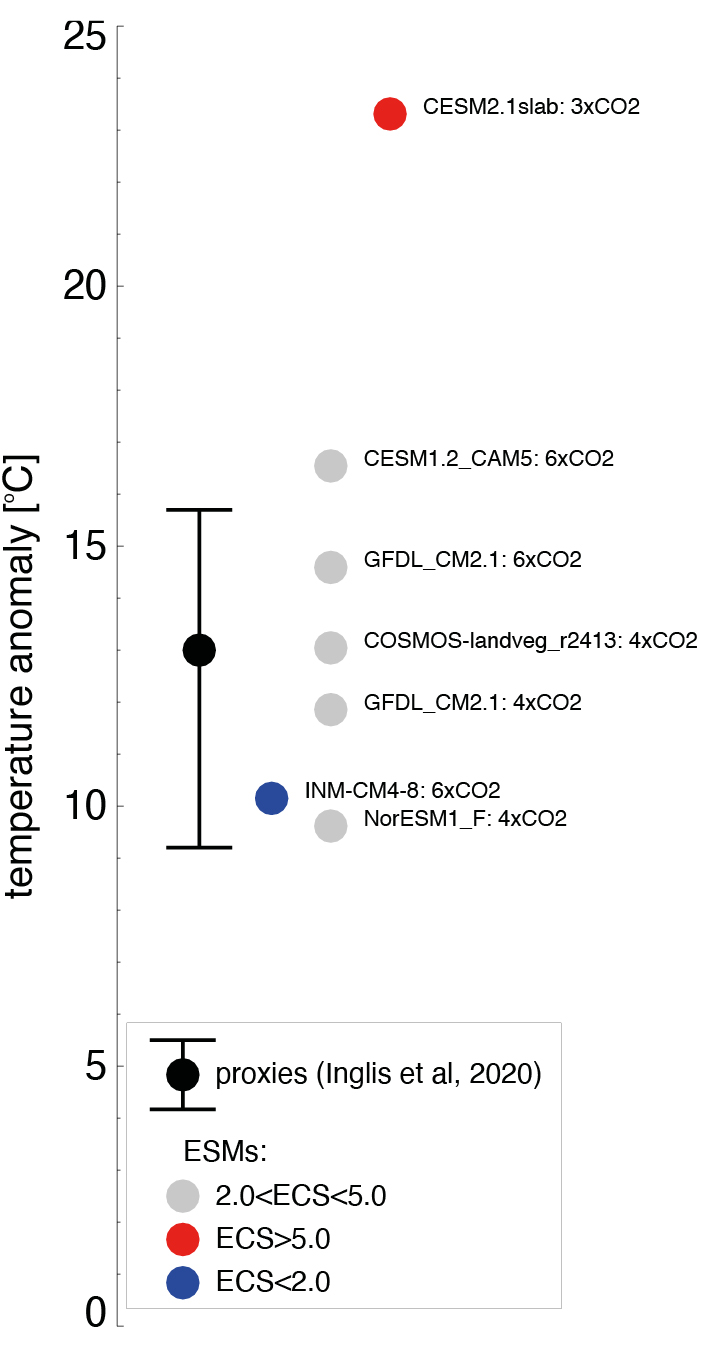
This proxy database was used to characterize the best estimates of global mean temperature in the three time periods of interest, and their uncertainties (Inglis et al. 2020). A variety of methods was applied to convert the relatively sparse proxy data into global means, ranging from a simple latitudinal-banded average, to Gaussian process regression. These different methods were compared and combined, resulting in estimates for the latest Paleocene, PETM, and EECO, of 21–29ºC, 26–36ºC, and 22–31ºC, respectively (90% confidence interval). This study also used the temperature estimates and the best existing CO2 estimates to provide a quantification of equilibrium climate sensitivity (ECS) based on Eocene data. This resulted in ECS estimates of 1.6–8.0ºC, 1.9–5.2ºC, and 1.3–5.0ºC for the same three time periods.
 |
|
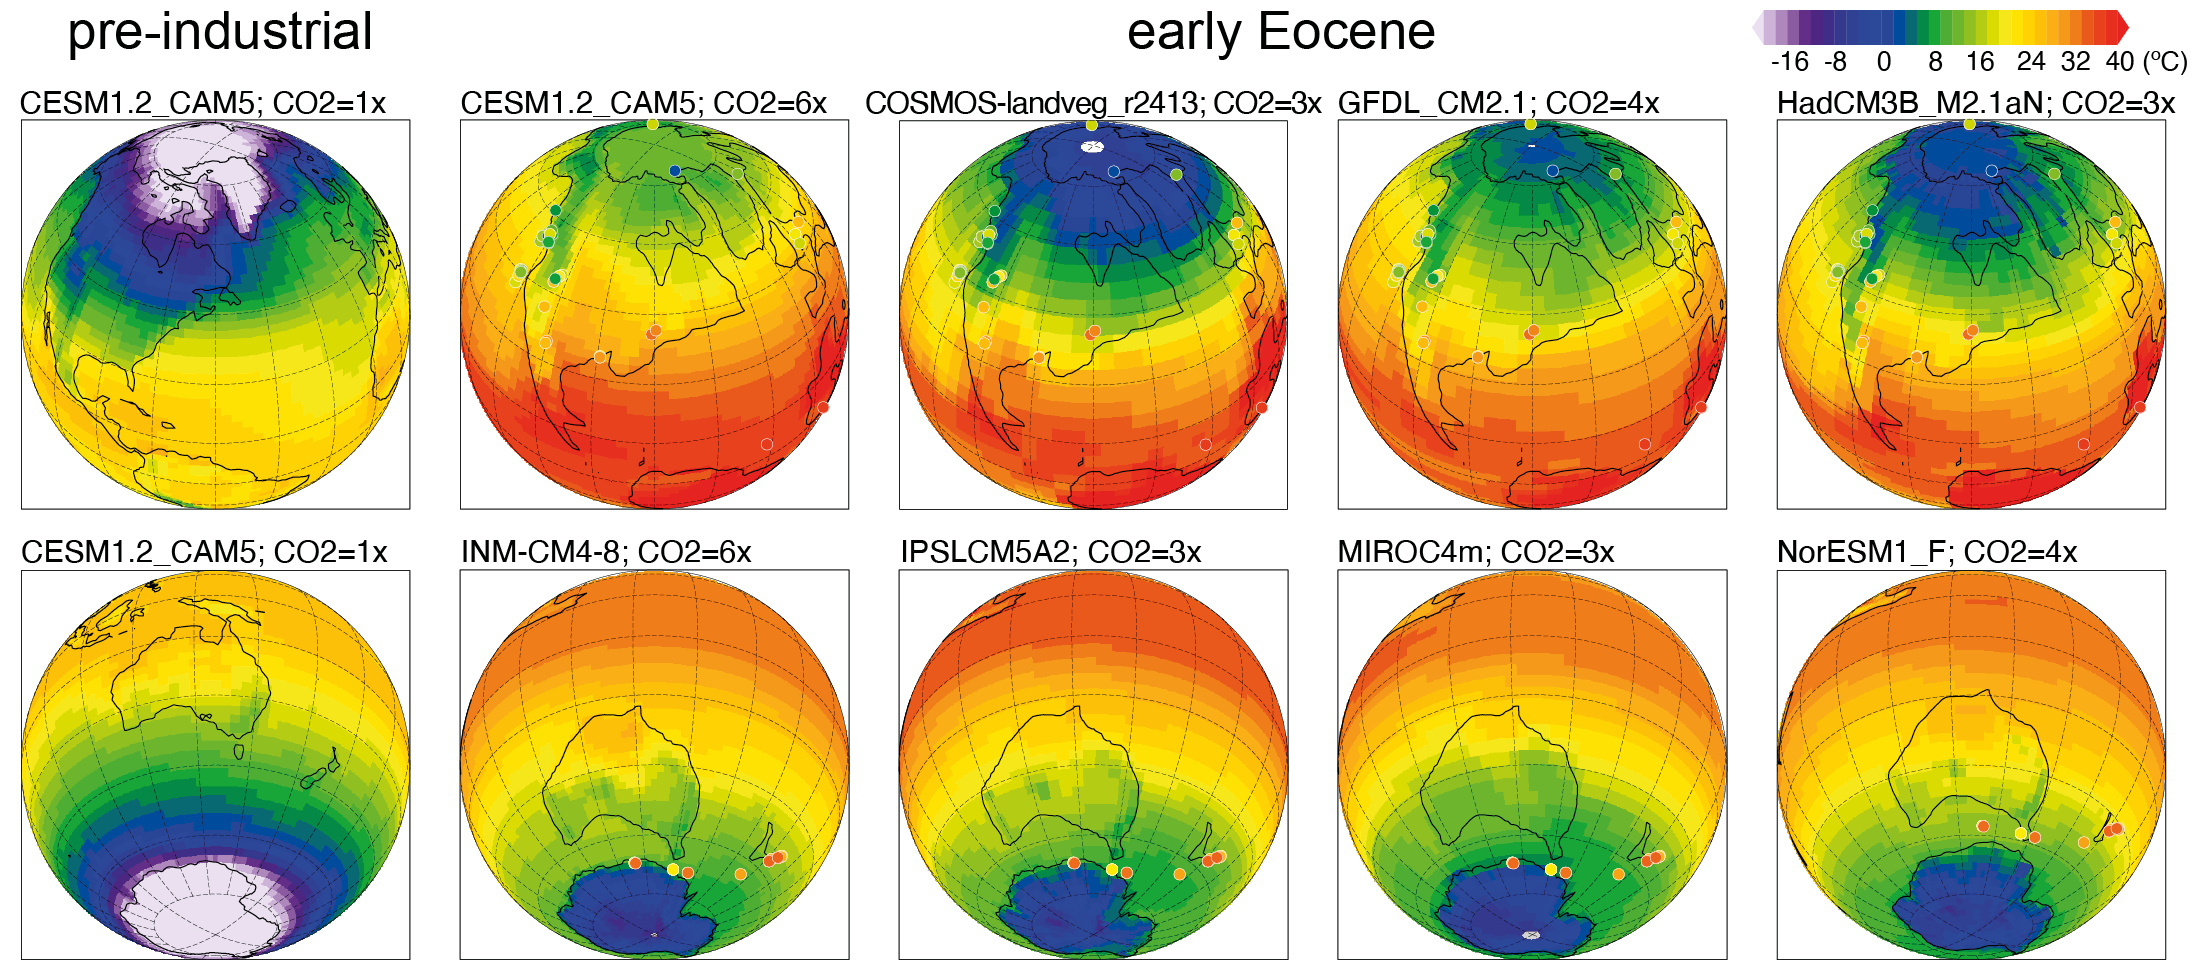
Figure 1: Modeled near-surface annual mean air temperature (ºC) from eight models in the DeepMIP-Eocene (early Eocene) model ensemble, and proxy reconstructions from Hollis et al. (2019). The simulations shown here were carried out at a range of CO2 concentrations from 840 (3x pre-industrial) to 1680 (6x pre-industrial) ppmv. Also shown is pre-industrial temperature from the CESM1.2_CAM5 model. The full model results are described in Lunt et al. (2021). The model data can be obtained from the DeepMIP model output database; see here for more info: deepmip.org/data-eocene |
The proxy database was also used to evaluate the DeepMIP model simulations, which were presented, and their large-scale features discussed, in Lunt et al. (2021; see Fig. 1). The work showed that compared with results from previous studies of the Eocene, the DeepMIP simulations show a smaller ensemble spread in the global mean surface temperature response for a given atmospheric CO2 concentration—this may result from the standardised experimental design and topographic/bathymetric boundary conditions.
These simulations also revealed a relatively high Eocene climate sensitivity (ECS) on average (average of 4.5ºC per CO2 doubling), compared to previous work (average of 3.3ºC per CO2 doubling). An energy balance analysis of the model ensemble indicated that global mean warming in the Eocene compared with the preindustrial period mostly arises from decreases in emissivity due to the elevated CO2 concentration (and associated water vapor and long-wave cloud feedbacks), whereas the reduction in the Eocene in terms of the meridional temperature gradient is primarily due to emissivity and albedo changes owing to the non-CO2 boundary conditions (i.e. the removal of the Antarctic ice sheet and changes in vegetation).
In contrast with previous work, three of the eight models examined showed results that are consistent with the proxies in terms of the global mean temperature, meridional SST gradient, and CO2. However, at a more regional scale, the models lack skill. In particular, the modeled anomalies are substantially lower than those indicated by the proxies in the southwest Pacific (Fig. 1, lower panels); here, modeled continental surface air temperature anomalies are more consistent with surface air temperature proxies, implying a possible inconsistency between marine and terrestrial temperatures in either the proxies or models in this region.
 |
|
Figure 2: Modeled global-mean near-surface annual mean air temperature (ºC) from those model simulations in the DeepMIP-Eocene (early Eocene) model ensemble that carried out simulations at 4x or 6x pre-industrial (consistent with proxy CO2 estimates of Anagnostou et al. 2020), plus the 3x pre-industrial simulation using CESM2.1 (Zhu et al. 2020). Also shown is the proxy-based estimate of global mean temperature from Inglis et al. (2020). |
The results from Lunt et al. (2021) and Inglis et al. (2020) have contributed to the recently published 6th assessment report of the Intergovernmental Panel on Climate Change (IPCC AR6). Individual models that have used the DeepMIP boundary conditions have also contributed exciting results, including the finding that one of the high-ECS CMIP6 models, CESM2.1, produces a climate that is substantially warmer than indicated by the paleoproxies (Zhu et al. 2020; Fig. 2). This result is partly due to the response to the non-CO2 forcings, which suggests that more attention is due on that subject. In addition, one of the low-ECS CMIP6 models, INMCM4-8, produces results at the low end of the proxy temperature estimates (Fig. 2). This indicates that the early Eocene may be a potentially useful tuning target for Earth system model (ESM) development, in particular if tighter constraints can be placed on the CO2 concentration.
Ongoing and future DeepMIP activities
It is currently a very busy time for DeepMIP scientists, as several papers exploring the model ensemble and proxy data are currently in various stages of preparation. This includes studies focusing on ocean circulation (Zhang et al. submitted), Arctic sea ice (Niezgodzki et al. submitted), and the African monsoon (Williams et al. in prep), and other papers listed here: deepmip.org/publications-eocene; of these, several studies are proposing to explore the role of paleogeography and ocean gateways on regional climate. It is anticipated that many of these papers will be published in a Special Issue of Paleoceanography and Paleoclimatology, "DeepMIP in the Hothouse Earth: late Paleocene – early Eocene Climates and their lessons for the future", which is being organized by Margot Cramwinckel, Michael Henehan, and Jean-Baptiste Ladant. This work will be aided greatly by the existence of the DeepMIP model outputs database, which contains the model outputs from all eight Eocene models; see here for access: deepmip.org/data-eocene
It may be that DeepMIP will explore more time periods over the next few years. Based on experience, we expect that new time periods are best explored initially with ad-hoc ensembles of opportunity. In this regard, there has already been progress on the Eocene-Oligocene Transition (EOT; Hutchinson et al. 2021) and the Miocene (Burls et al. 2021). As such, we have already created three sub-groups within DeepMIP; DeepMIP-Eocene, DeepMIP-EOT, and DeepMIP-Miocene.
In any case, whatever happens, we will always expect DeepMIP to have a focus on integration of models and proxies, and work to bringing the modeling and data communities ever closer.
Affiliations
1School of Geographical Sciences, University of Bristol, UK
2Department of Earth, Atmospheric, and Planetary Sciences, Purdue University, West Lafayette, IN, USA
3Climate and Global Dynamics Laboratory, National Center for Atmospheric Research, Boulder, CO, USA
4Atmosphere and Ocean Research Institute, The University of Tokyo, Japan
5Climate Change Research Centre, UNSW, Sydney, Australia
6Laboratoire des Sciences du Climat et de l'Environnement, LSCE/IPSL, UMR CEA-CNRS-UVSQ, Université Paris-Saclay, Gif sur Yvette, France
7Institute of Geography, Russian Academy of Sciences, Moscow, Russia
8Alfred Wegener Institute, Helmholtz Centre for Polar and Marine Research, Bremerhaven, Germany
9ING PAN – Institute of Geological Sciences, Polish Academy of Sciences, Research Center in Kraków, Biogeosystem Modelling Group, Poland
10NORCE Norwegian Research Centre, Bjerknes Centre for Climate Research, Bergen, Norway
11Department of Atmospheric Science, School of Environmental Studies, China University of Geosciences, Wuhan, China
contact
Daniel Lunt: D.J.Luntbristol.ac.uk
references
Anagnostou E et al. (2020) Nat Commun 11: 4436
Burls NJ et al. (2021) Paleoceanogr Paleoclimatol 36: e2020PA004054
Carmichael MJ et al. (2016) Clim Past 12: 455-481
Gasson E et al. (2014) Clim Past 10: 451-466
Hollis CJ et al. (2019) Geosci Model Dev 12: 3149-3206
Hutchinson DK et al. (2021) Clim Past 17: 269-315
Inglis GN et al. (2020) Clim Past 16: 1953-1968
Lunt DJ et al. (2012) Clim Past 8: 1717-1736
Lunt DJ et al. (2013) Phil Trans R Soc A 371: 20130146
Lunt DJ et al. (2017) Geosci Model Dev 10: 889-901
Lunt DJ et al. (2021) Clim Past 17: 203-227
Niezgodzki I et al. Simulation of Arctic sea ice within the DeepMIP Eocene ensemble: thresholds, seasonality and factors controlling sea ice development, submitted to Global and Planetary Change.
Williams C et al. The Eocene African monsoon – insight from DeepMIP models and proxy data, in prep.
Zhang Z et al. Early Eocene ocean meridional overturning circulation: the roles of atmospheric forcing and strait geometry, submitted to Paleoceanography and Paleoclimatology.
Alan M. Haywood1, H.J. Dowsett2, J.C. Tindall1, PlioMIP1 and PlioMIP2 participants
PlioMIP is a network of paleoclimate modelers and geoscientists who, through the study of the mid-Pliocene Warm Period (mPWP ∼3.3–3.0 million years ago), seek to understand the sensitivity of the climate system to forcings and examine how well models reproduce past climate change.
Origins of PlioMIP
Building upon 20 years of geological data collection/synthesis by the US Geological Surveys' PRISM Project (Pliocene Research Interpretation and Synoptic Mapping), as well as early Pliocene climate-model studies, paleoclimate modelers and proxy-data experts gathered at the Goddard Institute for Space Studies in New York, USA, in 2007 to discuss the feasibility of a coordinated multi-model and proxy-data effort. A proposal for a PlioMIP working group within PMIP was endorsed at the 2008 PMIP meeting in Estes Park Colorado, USA (pastglobalchanges.org/calendar/128659). Through two discrete phases of work (PlioMIP1 and PlioMIP2), the project has produced, contributed, or inspired more than 100 articles in peer-reviewed literature. It has transformed our view of the Pliocene world, and underlined what the Pliocene tells us about climate and broader Earth system responses to atmospheric carbon dioxide levels akin to those of the present day.
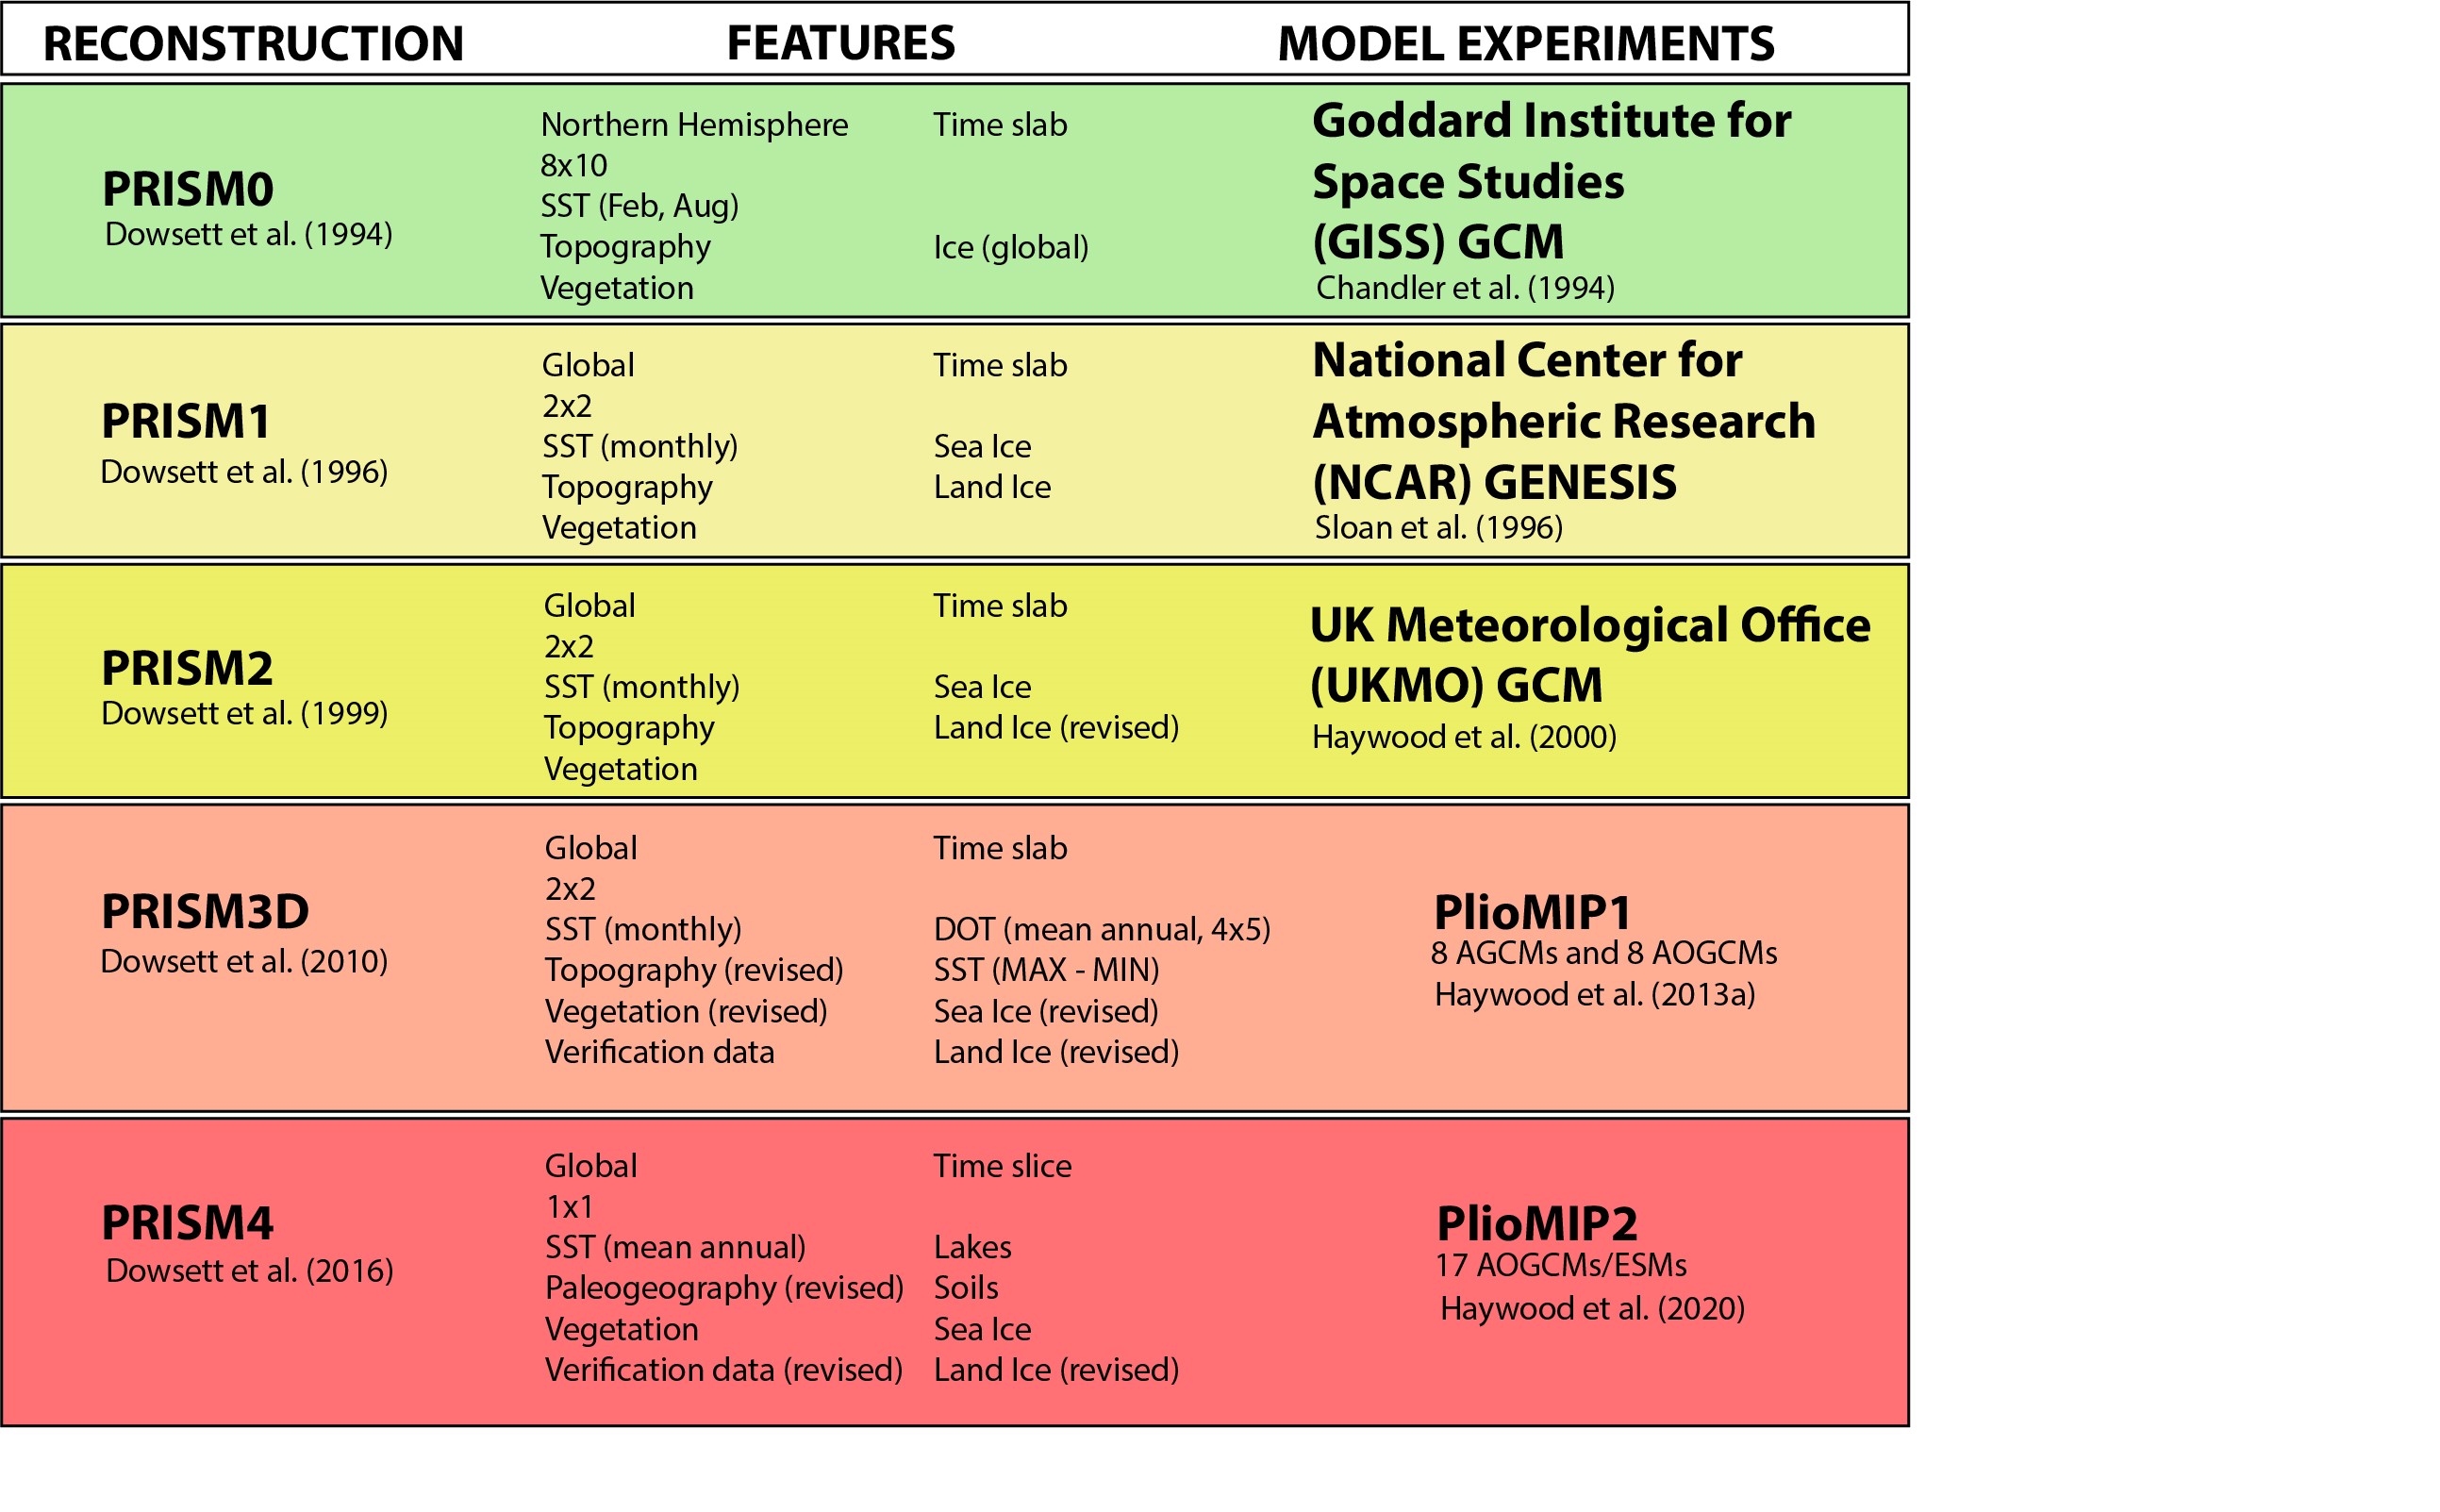
The experimental designs for PlioMIP1 and 2 (Haywood et al. 2010; 2016) were underpinned by two generations of PRISM boundary conditions (geology.er.usgs.gov/egpsc/prism/index.html; Dowsett et al. 2010; 2016; Table 1). The 2010 PRISM3 reconstruction, used in PlioMIP1, was published at a global scale of 2° latitude x 2° longitude, and consisted of data on sea level, sea surface temperature, sea ice, deep ocean temperature, topography, vegetation, and land ice (Dowsett et al. 2010). The 2016 PRISM4 reconstruction, used in PlioMIP2, improved the global spatial resolution to 1° latitude x 1° longitude, adding soils and large lakes, and incorporated new methodologies/approaches in paleogeographic reconstruction (Dowsett et al. 2016).
PlioMIP1 outcomes (mPWP compared to the pre-industrial era)
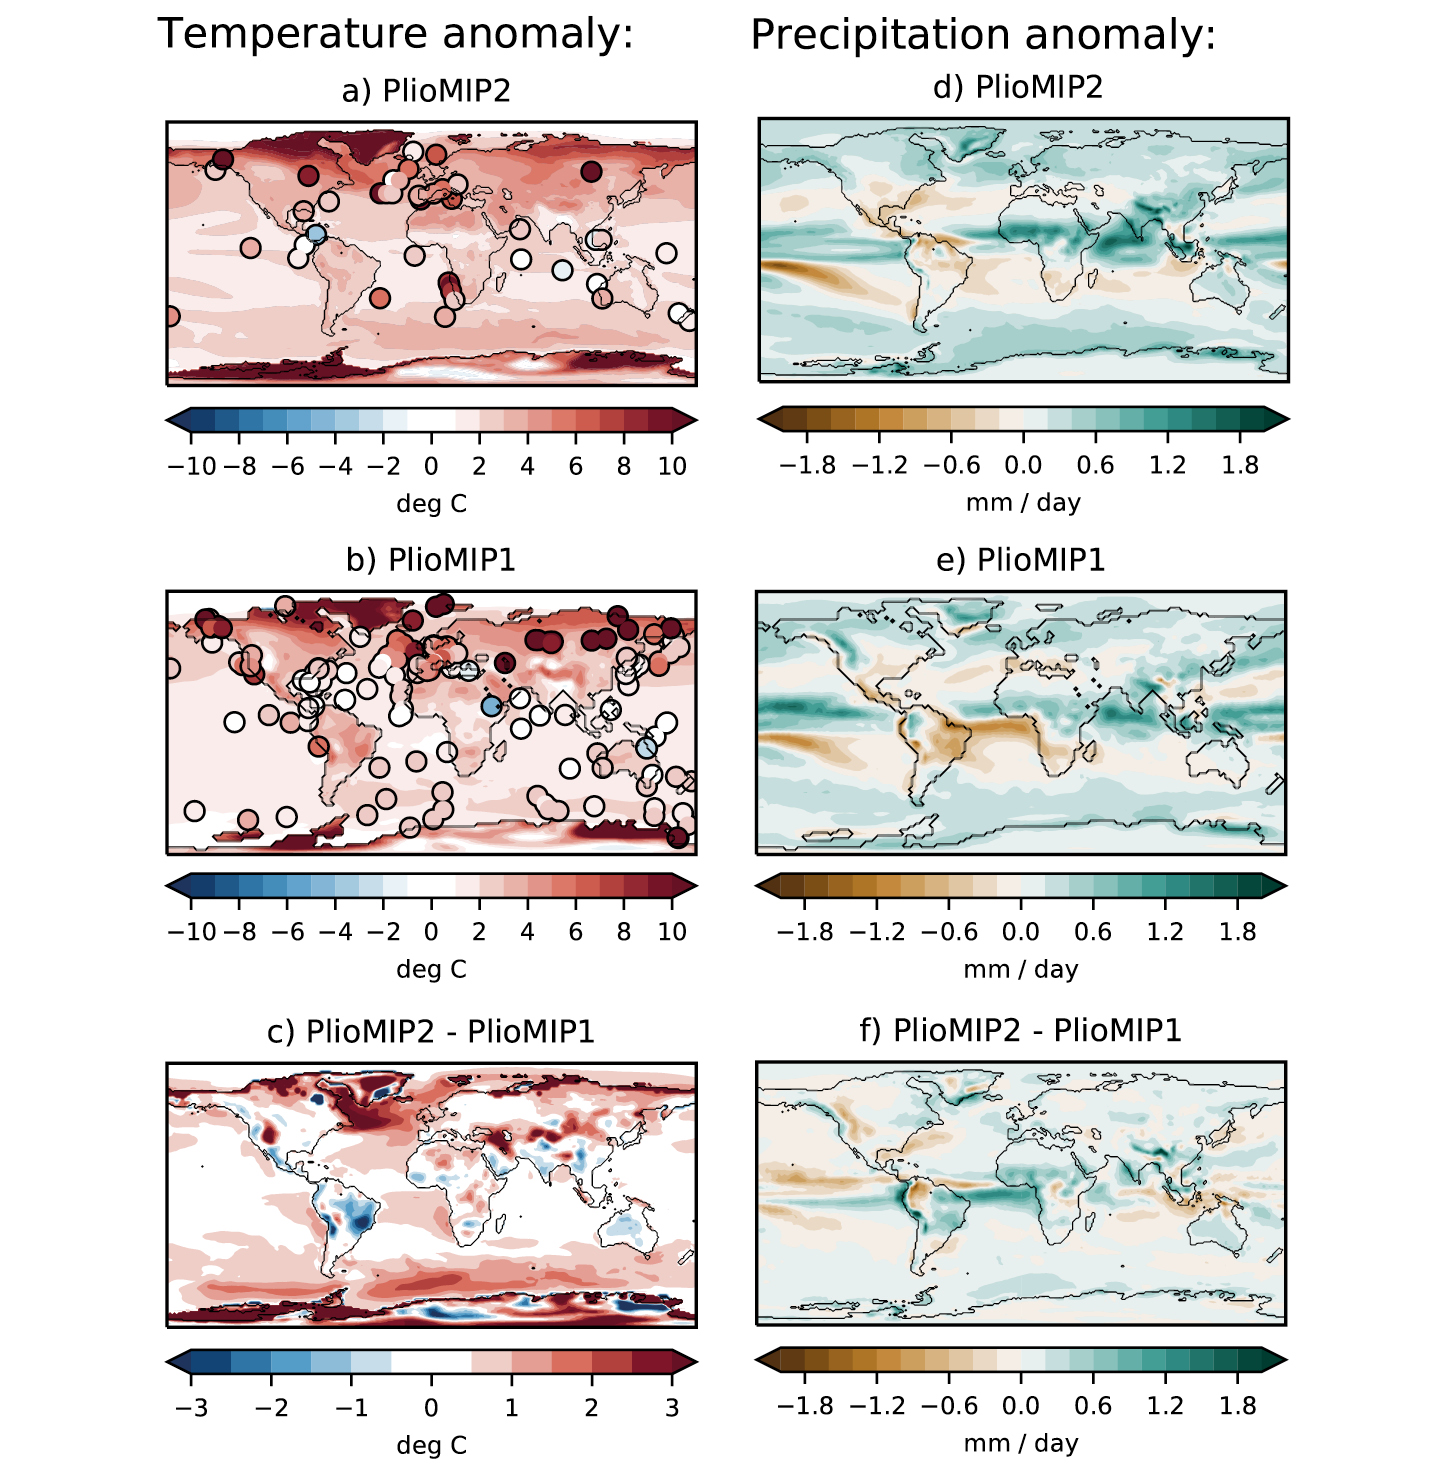
An ensemble of eight climate models indicated that the mPWP global annual mean surface air temperature was 1.8 and 3.6°C higher than the pre-industrial baseline. Warming was predicted at all latitudes yet amplified at the poles, reducing the meridional temperature gradient (Haywood et al. 2013a; Fig. 1). A decline in Arctic sea-ice extent, with some models displaying a seasonally sea-ice-free Arctic, was predicted (Howell et al. 2016). Increased temperatures were predominantly a response to direct CO2 forcing in the tropics and changes in albedo at high latitudes (Hill et al. 2014).
 |
|
Figure 1: (A) PlioMIP2 and (B) PlioMIP1 multi-model annual mean surface air temperature (SAT) differences (over land) and sea surface temperature (SST) differences (over oceans) in °C, compared to the pre-industrial era. (C) Difference between PlioMIP2 and PlioMIP1 multi-modal means (°C). (D) PlioMIP2 and (E) PlioMIP1 multi-model annual mean total precipitation rate (mm/day) differences (compared to the pre-industrial era). (F) Difference between PlioMIP2 and PlioMIP1 multi-modal means (mm/day). Circles represent proxy-derived SST and SAT anomalies in (A) from McClymont et al. (2020) and Salzmann et al. (2013) respectively. Proxy-derived SST and SAT anomalies in (B) from Dowsett et al. (2010) and Salzmann et al. (2013) respectively. |
The change in meridional temperature gradient weakened tropical atmospheric circulation, specifically the Hadley circulation, a response akin to model predictions for the future (Corvec and Fletcher 2017). Mid-latitude westerly winds shifted poleward (Li et al. 2015), tropical cyclone intensity and duration increased (Yan et al. 2016) and the East Asian and West African summer monsoons strengthened (R Zhang et al. 2013; 2016). The global land monsoon system expanded poleward with increased monsoon precipitation over land (Li et al. 2018). The Atlantic Meridional Overturning Circulation (AMOC) showed no clear change (Z Zhang et al. 2013). Equilibrium Climate Sensitivity (ECS) ranged from 1.9 to 3.7°C (Hargreaves and Annan 2016). Earth System Sensitivity (ESS) was 1.47°C higher than the ECS (ensemble mean ECS = 3.4°C; ensemble mean ESS = 5.0°C; Haywood et al. 2013a). While models were able to reproduce many of the regional patterns of ocean and land surface temperature change demonstrated by proxy data, they underestimated the magnitude of warming at higher latitudes (e.g. Salzmann et al. 2013; Dowsett et al. 2013).
Creating PlioMIP2
PlioMIP1 highlighted two issues with model boundary conditions and proxy data used to verify climate models. Firstly, the PRISM3 paleogeographic reconstruction was a semi-quantitative interpretation of the available geological data. Changes in the distribution of land versus sea, as well as topography/bathymetry, result in significant regional changes to model-generated climates. A more objective and reproducible assessment, including the modeling of dynamic topography and incorporation of glacial isostatic adjustment (GIA) effects on the local expression of Pliocene sea level, was necessary (Dowsett et al. 2016). Secondly, PRISM reconstructions of sea surface temperatures (SSTs) were based on a time-slab concept that averaged warm phase SSTs over a ∼260–300 kyr window. This practice was not optimal for verification of model-predicted SSTs, as models provide estimates of Pliocene SSTs in equilibrium with a set of time-specific boundary conditions/forcings (Haywood et al. 2016).
 |
|
Table 1: Evolution of PRISM boundary conditions and their integration into climate models and PlioMIP. |
Moving beyond PlioMIP1 required an improved chronology for proxy data, and something approaching a true time-slice SST synthesis. Marine isotope stage KM5c (3.205 Myr BP) on the LR04 timescale was chosen as it represented an "interglacial event" within the mPWP, characterized by an almost identical orbital forcing to today, thus enhancing the relevance of its study in the context of future climate change (Haywood et al. 2013b). Proximity to a magnetic reversal and major benthic oxygen isotope excursions enhanced the ability to recognize the time-slice in high-resolution proxy records (Dowsett et al. 2016).
PlioMIP2 outcomes to date
Based on 16 of 17 available climate models that contributed simulations to the PlioMIP2 project, Haywood et al. (2020) determined that the range of global mean surface air temperatures increase was 1.7 to 5.2°C relative to the pre-industrial (multi-model mean 3.2°C), with warming polewards of 60°N and 60°S exceeding the global mean warming by a factor of 2.3 (Fig. 1). Sea-ice coverage was reduced by an average of 53%, with 11 of 16 models simulating ice-free summer conditions (de Nooijer et al. 2020). Later generation models tend to have an increased climate response compared to earlier generation models (Feng et al. 2020; Haywood et al. 2020), potentially related to new aerosol–climate and cloud microphysics schemes included in later models. The UK CMIP6 generation model HadGEM3 was determined to be too warm compared to available proxy data (Williams et al. 2021), with the previous generation UK model (HadGEM2) providing a better overall fit to geological data (Williams et al. 2021). Like in PlioMIP1, the PlioMIP2 ensemble indicates that the global monsoon domain expands, particularly in North Africa, Asia, and Australia (Berntell et al. 2021).
When using new time-slice SST reconstructions, there was broad agreement between data and models at the global scale, with regional differences reflecting ocean circulation and/or proxy signals (McClymont et al. 2020; Haywood et al. 2020). In the Atlantic and Pacific oceans, meridional temperature gradients reduced, while tropical zonal gradients remain largely unchanged. In the Atlantic this leads to a simulated reduction of interannual-to-decadal SST variability (Pontes et al. 2020). For the AMOC, in contrast to PlioMIP1, all models simulated an intensified mid-Pliocene AMOC, but no consistent response in the simulated Atlantic Ocean heat transport (Zhang et al. 2021). This consistent change in AMOC is potentially related to the closing of the Bering Strait/Canadian Archipelago in the PRISM4 reconstruction (Zhang et al. 2021). ENSO amplitude was reduced in the ensemble mean (–24%), with 15 of 17 individual models showing a reduction (Oldeman et al. 2021). The ensemble mean ESS is 67% greater than the ECS; which is larger than the increase of 47% obtained in PlioMIP1. An ECS range of 2.6–4.8°C accords with values presented in previous IPCC assessments (Haywood et al. 2020).
Going forward
PlioMIP2 will complete its planned analyses/publications within the next year and is beginning to address the necessary experiment planning in order to underpin a third phase of the project. This will include consideration of new CO2 and CH4 estimates (de la Vega et al. 2020; Hopcroft et al. 2020), uncertainties in paleogeographic reconstruction, as well as strategies to improve the availability of proxy data relevant to the PlioMIP time-slice. The project will continue to place a balanced emphasis on studies designed to improve our understanding of Pliocene climate, as well as studies which translate our knowledge of the past to better understand future climate change.
Affiliations
1School of Earth and Environment, University of Leeds, UK
2Florence Bascom Geoscience Center, US Geological Survey, Reston, VA, USA
contact
Alan Haywood: A.M.Haywoodleeds.ac.uk
references
Berntell E et al. (2021) Clim Past Discuss, doi:10.5194/cp-2021-16
Chandler M et al. (1994) Glob Planet Change 9: 197-219
Corvec S, Fletcher CG (2017) Clim Past 13: 135-147
de la Vega E et al. (2020) Sci Rep 10: 11002
de Nooijer W et al. (2020) Clim Past Discuss, doi:10.5194/cp-2020-64
Dowsett HJ et al. (1994) Glob Planet Change 9: 169-195
Dowsett HJ et al. (1996) Mar Micropaleontol 27: 13-25
Dowsett HJ et al. (1999) U.S. Geological Survey Open File Report 99-535
Dowsett HJ et al. (2010) Stratigraphy 7: 123-139
Dowsett HJ et al. (2013) Sci Rep 3: 2013
Dowsett HJ et al. (2016) Clim Past 12: 1519-1538
Feng R et al. (2020) J Adv Model Earth Syst 12: e2019MS002033
Hargreaves JC, Annan JD (2016) Clim Past 12: 1591-1599
Haywood AM et al. (2000) Glob Planet Change 25: 239-256
Haywood AM et al. (2010) Geosci Model Dev 3: 227-242
Haywood AM et al. (2013a) Clim Past 9: 191-209
Haywood AM et al. (2013b) Philos Trans R Soc A 371: 20120515
Haywood AM et al. (2016) Clim Past 12: 663-675
Haywood AM et al. (2020) Clim Past 16: 2095-2123
Hill DJ et al. (2014) Clim Past 10: 79-90
Hopcroft PO et al. (2020) Proc Natl Acad Sci USA 117: 23401-23407
Howell FW et al. (2016) Clim Past 12: 749-767
Li X et al. (2015) Adv Atmos Sci 32: 909-923
Li X et al. (2018) Palaeogeogr Palaeoclimatol Palaeoecol 512: 56-70
McClymont EL et al. (2020) Clim Past 16: 1599-1615
Oldeman AM et al. (2021) Clim Past Discuss, doi:10.5194/cp-2021-58
Pontes GM et al. (2020) Sci Rep 10: 13458
Salzmann U et al. (2013) Nat Clim Change 3: 969-974
Sloan LC et al. (1996) Mar Micropaleontol 27: 51-61
Williams CJR et al. (2021) Clim Past Discuss, doi:10.5194/cp-2021-40
Yan Q et al. (2016) Proc Natl Acad Sci USA 113: 12963-12967
Zhang R et al. (2013) Clim Past 9: 2085-2099
Zhang R et al. (2016) Adv Atmos Sci 33: 1061-1070
Bette L. Otto-Bliesner![]() 1, P. Scussolini
1, P. Scussolini![]() 2, E. Capron
2, E. Capron![]() 3, M. Kageyama4 and A. Zhao
3, M. Kageyama4 and A. Zhao![]() 5
5
The Last Interglacial is one of the five priorities within the CMIP6-PMIP4 initiative. Its 127 kyr BP model experiment allows for an assessment of climate model fidelity during a period of Northern Hemisphere warmth, sea-level high stand, and regional hydroclimate changes.
The main changes in forcing during the Last Interglacial (LIG) as compared to present are in the latitudinal and seasonal distribution of incoming solar radiation. Differences in the orbital configuration between the LIG and modern resulted in pronounced insolation anomalies at the Northern Hemisphere (NH) summer solstice; these anomalies are latitudinally similar but much larger than those during the Holocene (Fig. 1).
Proxy records document that these insolation anomalies altered regional hydroclimates, e.g. by enhancing the summer monsoon precipitation over North Africa and southeast Asia during the Holocene (COHMAP 1988) and during interglacials of the last 224 kyr (Wang et al. 2008). Pollen and macro-fossil evidence indicate that in the mid-Holocene, the boreal forest extended farther north than today (Prentice et al. 2000) and during the LIG (CAPE-Last interglacial project members 2006) it extended to the Arctic coast, except in Alaska and central Canada. Ice cores and proximal marine records indicate that the Greenland ice sheet survived the warmer temperatures of the LIG, though with significantly reduced extent and volume (Sime et al. 2013).
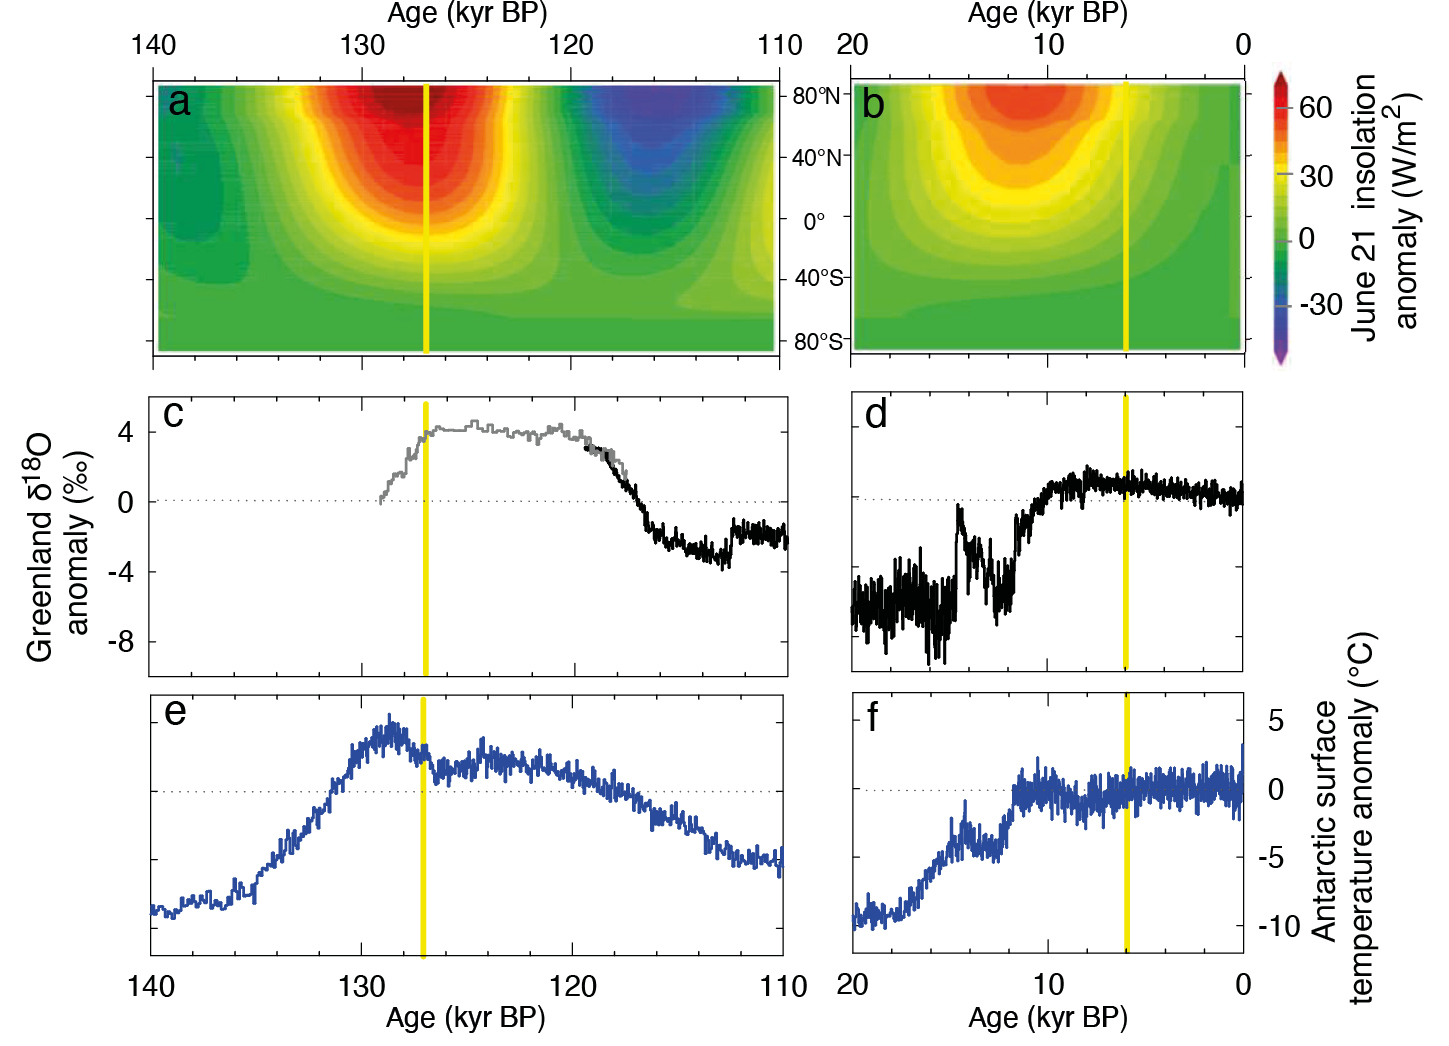 |
|
Figure 1: Insolation (Berger 1978) forcing and climate records of Antarctic surface temperature and Greenland δ18O for the Last Interglacial (left) and Holocene (right). Anomalies are relative to their average value of the last 1000 years. Yellow lines indicate the periods selected for the lig127k and midHolocene simulations with the PMIP climate models. Figure modified from Otto-Bliesner et al. (2017). |
CMIP, PMIP, and IPCC
Studying the Holocene, our current interglacial, has been a cornerstone of the Paleoclimate Modelling Intercomparison Project (PMIP) since the early 1990s (see Joussaume and Taylor, this issue; Braconnot et al. this issue), and has contributed to the evaluation of climate models starting with the Intergovernmental Panel on Climate Change (IPCC) Second Assessment Report in 1995 (see Kageyama et al. this issue, p. 68). Although the LIG had been on the radar of the IPCC since the first assessment report, it gained increasing attention in the fourth and fifth assessments (AR4 and AR5) due to its relevance for future projections of Earth system responses in a warm climate state. Indeed, the LIG was elevated to the AR4 Summary for Policymakers, which included these statements: "There is very high confidence that maximum global mean sea level during the last interglacial period (129,000 to 116,000 years ago) was, for several thousand years, at least 5 m higher than present, and high confidence that it did not exceed 10 m above present." Furthermore, "this change in sea level occurred in the context of different orbital forcing and with high-latitude surface temperature, averaged over several thousand years, at least 2ºC warmer than present (high confidence)."
The first multi-model ensemble for the LIG, as assessed in the AR5, compiled a set of 23 time-slice climate model simulations of the early LIG (130 to 125 kyr before present (BP)) by 14 models, encompassing a range of model complexities and various choices in the forcings (Lunt et al. 2013). However, the models in general underestimated the magnitude of the reconstructed temperature responses. It was, moreover, difficult to use these results to assess model reliability for simulating feedbacks for a warm climate state, as the models in this set of simulations for the LIG were mostly older and/or lower-resolution versions of the models used for the future projections in the Climate Modelling Intercomparison Project (CMIP) Phase 5 and in IPCC's AR5.
To provide more solid results, and to improve comparability with other simulations, such as of future climate, a coordinated LIG experiment was proposed as a CMIP6-PMIP4 simulation, setting a common experimental protocol for modeling groups to run with the same model and same resolution as the CMIP6 DECK (Diagnostic, Evaluation and Characterization of Klima) simulations (Eyring et al. 2016; Otto-Bliesner et al. 2017). At the "Warm extremes" workshop of the PAGES QUIGS working group in Cambridge in 2015 (pastglobalchanges.org/calendar/26910), the proxy and modeling communities identified the 127 kyr BP time slice as target for the CMIP6-PMIP4 LIG experiment. This concerted effort within both the model and data communities also led to a specific parallel effort to: (1) compile and build appropriate data time slices using ice-core and marine data and (2) provide guidance and recommendation on the use of existing data compilations to evaluate model runs (Capron et al. 2017).
Highlights of results from the CMIP6-PMIP4 lig127k experiment
Seventeen CMIP6-PMIP4 climate models completed the priority LIG experiment, called lig127k (see Otto-Bliesner et al. 2021 and Kageyama et al. 2021 for further details).
In response to the large boreal summer insolation anomalies with respect to the modern period, the NH high latitudes experience strong warming in June-July-August (JJA) relative to the pre-industrial (PI) simulations, with greater warming over the continents than the oceans (Fig. 2). This warming agrees well with reconstructions of summer temperatures except in the northwestern North Atlantic and Nordic seas, where marine reconstructions suggest significant cooling. One potential reason for this mismatch is that the highly uncertain meltwater flux from remnant ice sheets over Canada and Scandinavia is not included in the experiment protocol. Positive feedbacks with the cryosphere and ocean provide a "climate memory" effect that entails simulated high latitude summer warming to extend virtually year-round. The multi-model mean annual minimum sea ice extent in the Arctic is reduced by 50% relative to the PI simulations.
 |
|
Figure 2: Comparison of results of the CMIP6-PMIP4 lig127k simulations and proxy records. Arctic (40°–90°N) surface temperature anomaly between 127 kyr BP to the preindustrial period from models (ensemble average in colors) and proxies (filled markers), doi.org/10.5194/cp-17-63-2021-supplement): (A) June-July-August (JJA), (B) December-January-February (DJF), (C) annual. The preindustrial reference is 1850 CE for model anomalies and for the data is 1870–1899. Figure modified from Otto-Bliesner et al. (2021). |
Precipitation simulated for the LIG exceeds that for the PI over most boreal land areas, agreeing with a significant majority of the available proxies (Scussolini et al. 2019). In particular, summer monsoonal precipitation and areal extent are enhanced over northern Africa, Arabian Peninsula, India, southeast Asia, northwestern Mexico, and the southwestern US. The opposite happens for the South American, South African, and Australian monsoons. The LIG monsoon changes are mostly of the same sign but of greater magnitude than those in the CMIP6-PMIP4 mid-Holocene simulations. Simulations of the LIG hydrology indicate potentially large changes in river discharge for several NH basins, possibly with the development of a much wider river network over North Africa (Scussolini et al. 2020).
Perspectives
Looking forward, much more could be done to understand the LIG.
Additional snapshots of the LIG and transient simulations would allow analyses of the temporal complexity of the LIG. Existing LIG compilations of temperature (e.g. Capron et al. 2017; Hoffman et al. 2017) should be extended to cover data-scarce areas of the globe, i.e. the Southern Hemisphere and e.g. the Indian and Pacific Oceans. Available terrestrial records often reflect the so-called LIG temperature optimum, which was not globally synchronous, and can hardly be associated with specific time slices during the LIG. Transient simulations would enable an integrated approach for addressing the model-to-proxy mismatch potentially due to chronological inaccuracy and bias of proxy records, and allow application of data assimilation methods. Continued development of sea-ice and hydroclimate reconstructions would provide additional metrics for comparison to model simulations.
Modeling the transition into the LIG from Termination 2 is required to understand how changes in climate and ice sheets during the preceding penultimate deglaciation (see Ivanovic et al. this issue) influenced the early LIG, e.g. the overshoot in Antarctic surface temperatures and atmospheric carbon dioxide, as well as possibly the collapse of the West Antarctic ice sheet early in the LIG. Modeling the late part of the LIG will be an important test of the ability of models to simulate the glacial inception. Other opportunities include using data and fully coupled climate-ice sheet models for simulating the transition into, during, and out of the LIG, to evaluate the feedbacks among the atmosphere, ocean, sea ice, biosphere, and ice sheets. In addition, coordination of an integrated model–data project of the earlier Marine Isotope Stage 11 interglacial would allow evaluation of the sensitivity of the Greenland ice sheet to warmth, which was more muted but lasted longer than at the LIG.
The CMIP6-PMIP4 lig127k results illustrate the potential of the LIG to inform future projections. More than half of the models simulate a LIG retreat of the August-September Arctic sea-ice edge, similar to the average August-September Arctic sea-ice edge of the last two decades. Additionally, the models that show a strong reduction in the Arctic minimum sea-ice area to LIG forcing also show it in the CMIP6 1pctCO2 coordinated experiment. Further, for several regions of the NH, observed and projected changes in atmospheric circulation and rain patterns, in turn linked to the ongoing trend in Arctic amplification of warming and the response of the polar jet stream, may have had counterparts in the LIG climate. Finally, further integrated model–data investigations are required to firmly elucidate whether the West Antarctic ice sheet was a major contributor to the large LIG global sea level and inform on its potential collapse in the future.
Affiliations
1Climate and Global Dynamics Laboratory, National Center for Atmospheric Research, Boulder, CO, USA
2Institute for Environmental Studies, Vrije Universiteit Amsterdam, Netherlands
3Institut des Géosciences de l'Environnement, CNRS, Grenoble, France
4Laboratoire des Sciences du Climat et de l'Environnement/Institut Pierre-Simon Laplace, Gif-sur-Yvette, France
5Department of Geography, University College London, UK
contact
Bette Otto-Bliesner: ottobliucar.edu
references
Berger A (1978) J Atmos Sci 35: 2362-2367
CAPE-Last Interglacial project members (2006) Quat Sci Rev 25: 1383-1400
Capron E et al. (2017) Quat Sci Rev 168: 137-150
COHMAP Members (1988) Science 241: 1043-1042
Eyring V et al. (2016) Geosci Model Dev 9: 1937-1958
Hoffman JS et al. (2017) Science 355: 276-279
Kageyama M et al. (2021) Clim Past 17: 37-62
Lunt DJ et al. (2013) Clim Past 9: 699-717
Otto-Bliesner BL et al. (2017) Geosci Model Dev 10: 3979-4003
Otto-Bliesner BL et al. (2021) Clim Past 17: 63-94
Prentice IC et al. (2000) J Biogeogr 27: 507-519
Scussolini P et al. (2019) Sci Adv 5: eaax7047
Scussolini P et al. (2020) Geophys Res Lett 47: e2020GL089375