PAGES Magazine articles
Undine Ott
The Mamluk era (1250–1517 CE) was a period with phases of climate instability in the eastern Mediterranean. A trove of written sources has survived from this period but still awaits evaluation for climate history reconstruction in the Middle East.
The climate of the Middle East is more varied than the stereotypical image of barren deserts might suggest. The region encompasses Mediterranean-climate, semi-arid, and arid zones. Winter tends to bring more precipitation, while summers tend to be dry. During the medieval period, agriculture constituted by far the most important economic sector. Regardless of whether farmers practiced techniques of dry farming or relied on irrigation, agriculture depended largely on winter rains, and fluctuations in precipitation during this season could heavily affect the year's production (Frenkel 2014; Kaniewski et al. 2012).
A plethora of sources
A large number of written sources have been preserved from the Mamluk Sultanate that existed in Egypt and the Levant. The bulk of the sources is in Arabic. Arabic chronicles and annals are particularly informative about weather events and climate conditions. These works far outnumber what is extant from this period from most other parts of the world, including Europe. Mamluk-era diaries, travelogs, poems, biographies of rulers, encyclopedias, and anthologies occasionally provide useful information for historical climatology as well (Tucker 1999).
 |
|
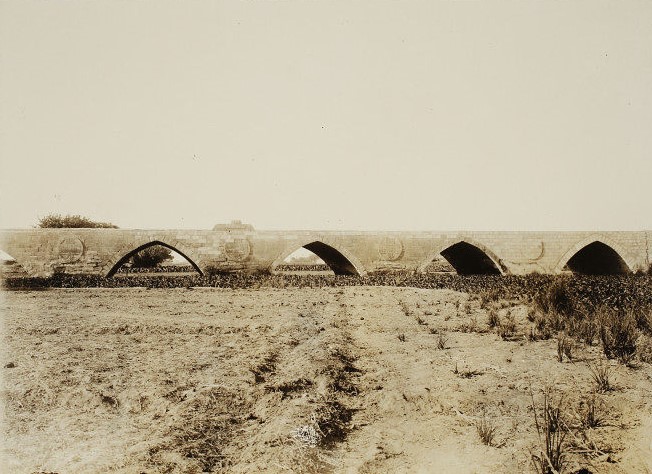
Figure 1: Bridge over the former Abū l-Munajja Canal which regulated the irrigation of the eastern Nile Delta, Cairo, 1260s. (Photo: K. A. C. Creswell, 1916–21, © Victoria and Albert Museum, London.) |
The majority of the Mamluk-era material falls into the genre of narrative sources. Documentary sources such as charters, letters, registers, or protocols, by contrast, are rare (Hirschler 2016). Furthermore, they hardly ever contain information on weather and climate. The same applies to inscriptions on buildings, tombstones, or objects. As a result, serial data on temperatures or harvest dates, for instance, cannot be compiled for medieval Egypt and the Levant.
The surviving narrative sources provide eyewitness accounts or, at least, contemporary testimony to the climate history of the Middle East. The authors were scholars or high dignitaries of the Mamluk Sultanate and focused on the urban centers and their surroundings. Rural areas are less well covered. The works generally report extreme weather events; only rarely do they remark upon normal weather conditions. The annual Nile flood is an exception: given its crucial importance for agriculture in Egypt, the flood was monitored by the sultan's court in Cairo. Cairo's canals were opened the day the river reached the level deemed sufficient to inundate the farmland of the city and its surroundings (Fig. 1). Both the elite class of the sultanate and the general population celebrated this day (in Arabic: Wafā al-Nīl), the date of which varied from year to year. As an event, it is regularly mentioned in the aforementioned written sources even for years with average Nile floods (Hassan 2007).
The Mamluk-era chronicles and annals provide information related to precipitation, temperature, and volcanic activity. They report on hail and sandstorms as well as floods and landslides, periods of severe cold, snowfall, low river levels, droughts, and eruptions of volcanic fields. Other disastrous events like earthquakes, tsunamis, city fires, epidemics, famines, or locust infestations are mentioned as well. The main extensive body of evidence concerns precipitation; water was a crucial resource in the Middle East, and too little rainfall could have severe consequences. The same was true for too much precipitation: torrential rains could overstrain canals and wash away streets. The economic and social infrastructure of rural, urban, and nomadic communities was highly vulnerable to precipitation anomalies.
Current state of research
The historical climatology of the medieval Middle East is still in its infancy. Ronnie Ellenblum (2012) attempted to reconstruct the climate history of the pre-Mamluk Middle East from written sources, and detected a series of climate disasters in the 10th and 11th centuries — the era that has been termed, with regard to Europe, the "Medieval Climate Optimum". Kate Raphael (2013) studied droughts, famines, earthquakes, and infestations of locusts, mice, and rats which affected the Middle East between the 12th and 14th centuries. Kristine Chalyan-Daffner (2013) analyzed reports from Mamluk-era sources of disastrous floods, droughts, and earthquakes in Egypt.
Recently, a group of geographers from the University of Freiburg created a dataset based on weather reports in written sources that the Middle East historian Heinz Grotzfeld had collected in the 1980s and 1990s. They published the list of entries accompanied by metadata (Vogt et al. 2016) and also entered the reports into the Tambora online database (www.tambora.org). This constituted the first attempt to systematically collect information on the climate history of the Middle East. Unfortunately, it often cites scholarly editions of sources incorrectly, and the paraphrases given of reports in Arabic sources do not, in all cases, seem reliable (see for example Glaser et al. 2016, p. 7, which provides an imprecise and incomplete translation of a passage from an Arabic source). Furthermore, a number of the editions of sources Grotzfeld had used have been surpassed by newer, improved editions. Besides, the dataset created fails to take into account a large number of extant Arabic sources.
 |
|
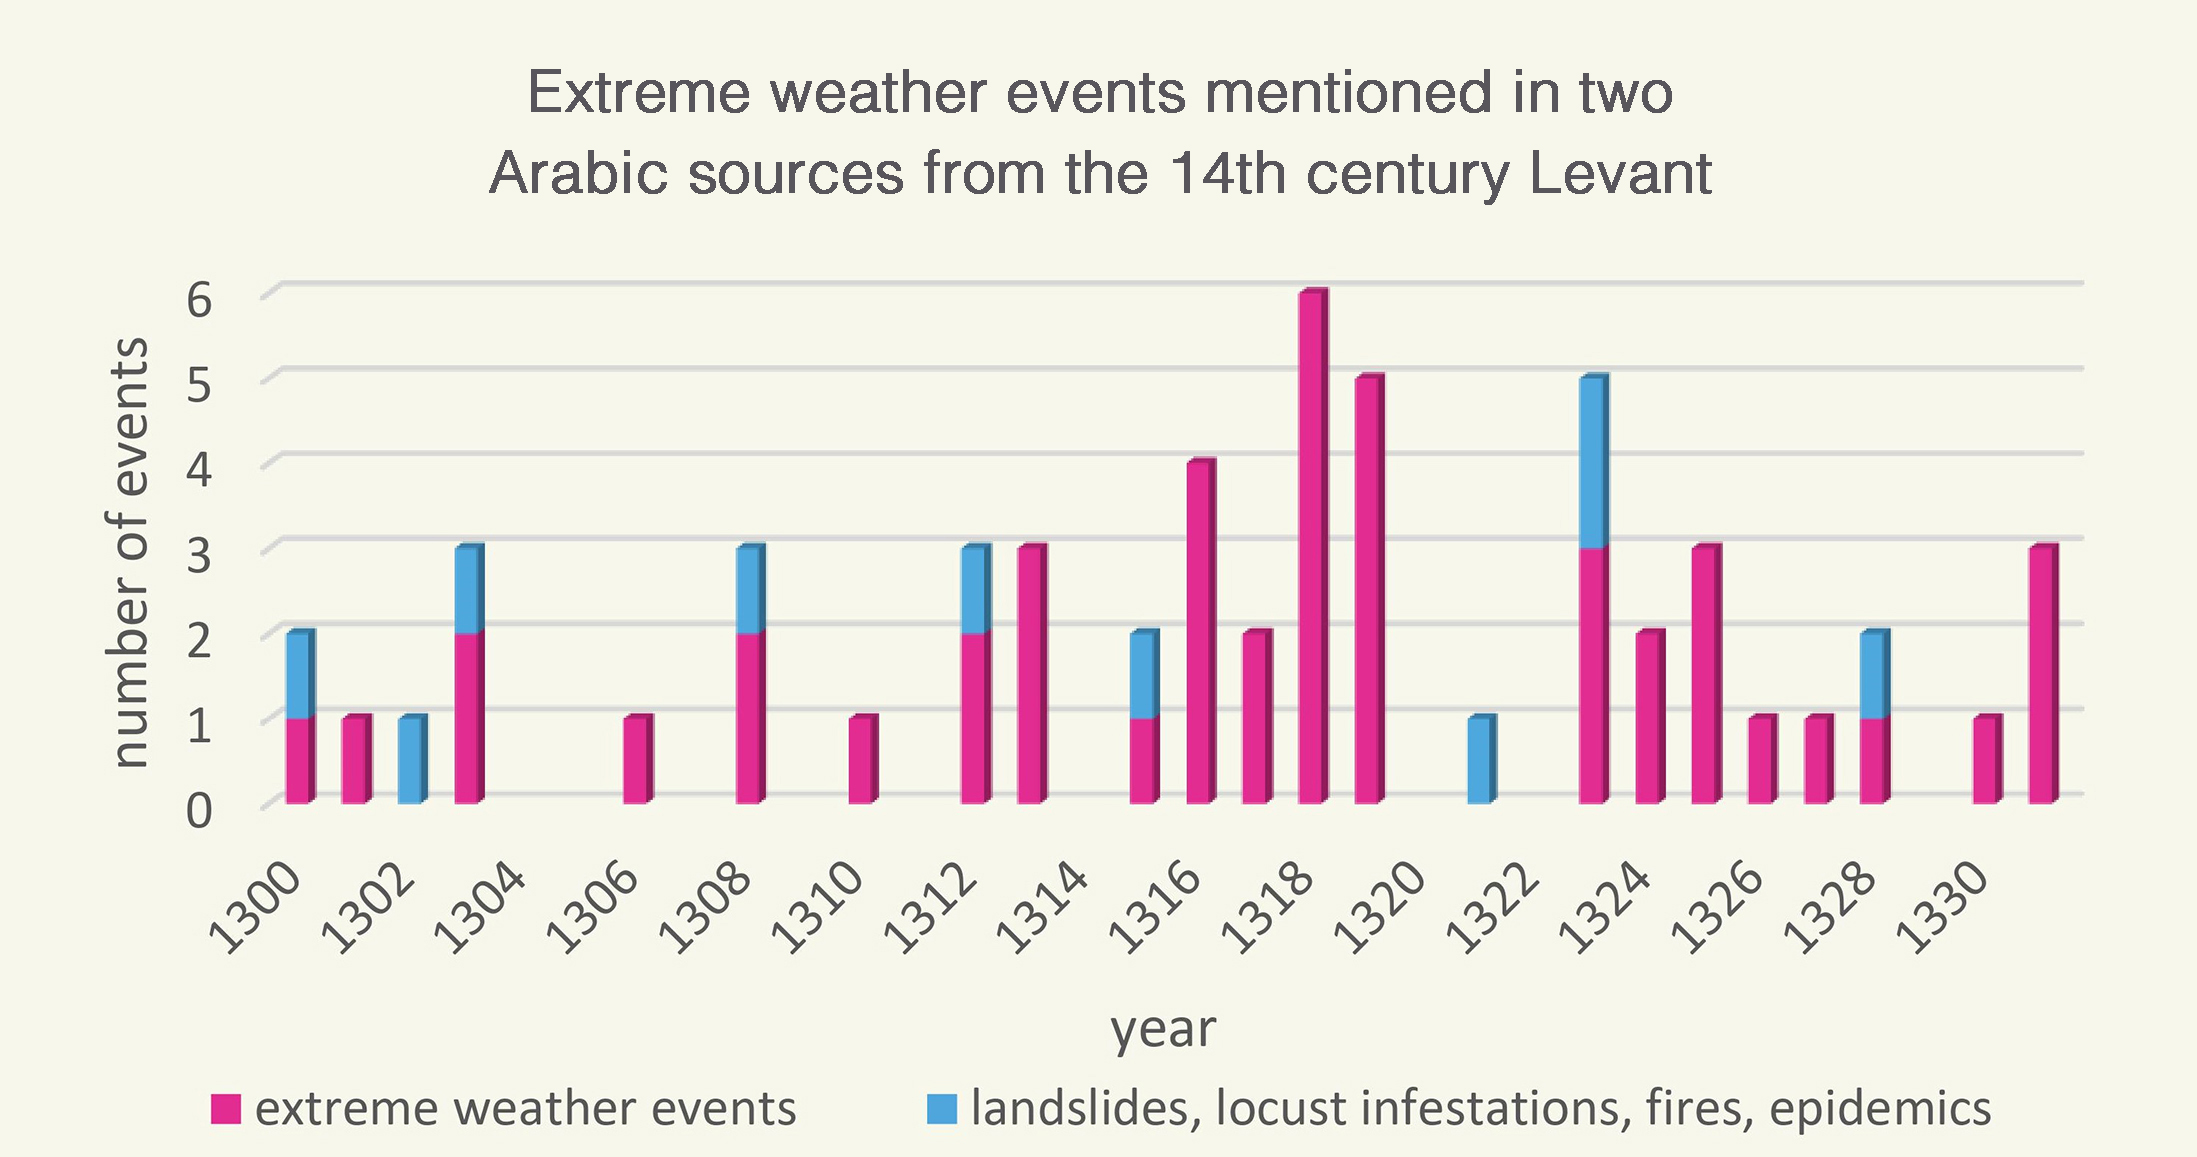
Figure 2: Extreme weather events and disasters mentioned in Abū l-Fidāʾ's al-Mukhtaṣar (completed ca. 1330) and Ibn Kathīr's al-Bidāya wa-l-nihāya (ca. 1370) for the period 1300–1331 CE. |
Potential pathways of future research
Apart from the Grotzfeld dataset, there is, to date, no systematic collection of Middle Eastern historical material for any period between 500 and 1500 CE despite the unique abundance of sources. Instead, studies like Raphael (2013) have, in part, relied on single anecdotes found in the extant sources, or have utilized works written centuries after weather events had supposedly occurred. More source-critical studies are needed to assess the potentials as well as the pitfalls of working with the extant Arabic material.
A systematic collection of information on medieval weather events would help to illuminate medium to long-term developments in the climate history of the Middle East. A searchable online database would enable comparative studies and greatly facilitate interdisciplinary cooperation. The use of digital tools might generate new questions and propose new answers. In order to present climate-related information from written sources in a meaningful way, ordinal-scale indices for precipitation or temperature have proved useful with regard to other regions of the globe (Nash et al. in review). Indices help to quantify information from narrative sources, but no index tables have been thus far compiled for past Middle Eastern climate conditions.
Besides medium and long-term developments, single cases of extreme weather events and natural disasters might be studied (Schenk 2017). Our understanding of Mamluk politics, society and economy has significantly improved in recent years. The growing scholarship provides an ideal base for case studies on the human response to climate instability: how were disasters and climate change perceived in Mamluk-era Egypt and the Levant, how were they managed, and what impact did they have on society?
The pioneering book by Ellenblum (2012) on the climate history of the Middle East does not incorporate much data from natural archives (Preiser-Kappeler 2015), though recent studies of speleothem archives, tree-ring data, pollen records, corals, and lake sediments have provided new insights into medieval climate conditions in the eastern Mediterranean. Historical climatology needs to incorporate these findings (Telelis 2008). The Mamluk era covers the phase of transition from the Medieval Climate Anomaly to the Little Ice Age. The written record at times provides more detailed and more precisely dated information than paleoclimatic data. A first preliminary survey of weather-related reports in Arabic annalistic works suggests, for instance, that the 1310s witnessed an extraordinary series of extreme weather events (Fig. 2). This period has, with regard to Europe, been termed the "Dantean Anomaly" (Brown 2001, pp. 251-254). The Freigeist Dantean Anomaly Project (dantean.hypotheses.org), hosted by the Leibniz Institute for the History and Culture of Eastern Europe in Leipzig, aims to compare medieval climate conditions in the Middle East and several regions of Europe. Comparative projects like this might contribute to answering the question whether phases of climate instability during the Middle Ages were limited to certain regions or constituted rather global phenomena (Bauch et al. 2020; Roberts et al. 2012).
affiliation
Leibniz Institute for the History and Culture of Eastern Europe, Leipzig, Germany
contact
Undine Ott: undine.ott leibniz-gwzo.de
references
Bauch M et al. (2020) Clim Past Discuss, doi:10.5194/cp-2020-34
Brown N (2001) History and Climate Change: A Eurocentric perspective. Routledge, 391 pp
Frenkel Y (2014) Hist Compass 12: 866-878
Hassan FA (2007) Quat Int 173-174: 101-112
Hirschler K (2016) J Am Orient Soc 136: 1-28
Kaniewski D et al. (2012) Proc Natl Acad Sci USA 109: 3862-3867
Nash DJ et al. (2020) Clim Past Discuss, doi:10.5194/cp-2020-126
Preiser-Kappeler J (2015) Jahrbuch der Österreich Byzantinistik 65: 195-242
Roberts N et al. (2012) Global Planet Change 84-85: 23-34
Telelis IG (2008) Jahrbuch der Österreich Byzantinistik 58: 167-207
Yassin Meklach
Arab historiographical studies can provide detailed climatic data and information on natural disasters through the exploitation of academically revised and re-edited ancient manuscripts. Maghrebian scholars have written valuable chronicles and annals that can form the basis of relevant paleoclimatic series.
Documentary data from all over the world can contribute to our understanding of the climate of the past. Such data are found in the archives of societies, and it is the aim of historical climatologists to give these documents voice and credibility. Progress in codicology and paleography has made it possible to examine old manuscripts more efficiently (Mathisen 2008). In particular, critical source editions and transcription projects have made these handwritten texts accessible to researchers from disciplines outside of the historical sciences. Apart from this indisputable progress, however, uncountable manuscripts still remain unexplored in archives and libraries around the world (Zaydān 1997). The first attempts to make such manuscripts accessible to a broader audience were made by Benedictine Monks in the 17th century. Frenchman Bernard de Montfaucon (1655–1741), author of Bibliotheca bibliothecarum, is considered one of the founders of this field.
Arabic historiography
The manuscripts discussed here are examples of a long and noble tradition of historiographical writing by the Arab people that mostly characterizes urban life (e.g. Ibn Khaldun 1378). They are also a mirror of the golden era of literature in the Arabic world that spanned nearly a century, starting from 753 CE (al-Jābirī 2009). The study of such manuscripts is only one of the approaches for analyzing the cultural transformations of past Arab societies, but alone, this is not sufficient; it is also crucial to place Arab historiography in its physical, historical, and geographical context, as was done by al-Munajjid (1960), Pedersen (1984), Sayyid (1997), Sāmarrāʼī (2001), Binebine (2004), Gacek (2009), and others. The editing process of Arabic manuscripts entails the collection of as many available copies of a specific manuscript as possible in order to compare and re-edit them in an orderly manner using legible and clear writing. Moreover, indexations and further contextualization of works within the fields of codicology and paleography are a part of the editing process. The final product can be read by non-specialists in Arabic literature, such as paleoclimatologists who aim to identify the relevant climatic information. Despite the various efforts made, however, the field of Arab manuscript research is still in a rather embryonic state with hundreds of thousands, if not several millions, of manuscripts to explore.
 |
|
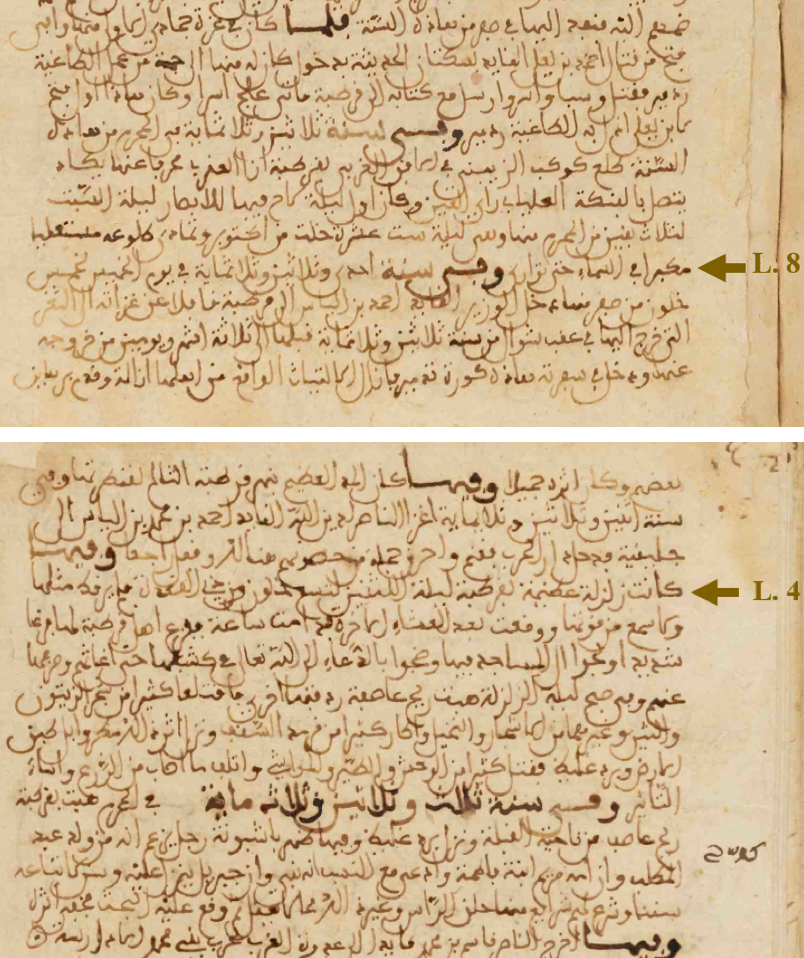
Figure 1: A facsimile of two pages of the manuscript of al-Bayān. In the section between line eight on the first page and line four on the second, different events dating from the years 331 AH (942 CE) and 333 AH (944 CE) are described that occurred in Cordoba, highlighting the temporal and spatial accuracy of the narrated events. See translation provided in the main text (Ibn Idhāri 1295). |
Weather descriptions in Arabic historiography
Arabic historiography, which is primarily a narration of human actions, might be subject to personal, political, religious, and/or otherwise biased interpretations, but this usually does not interfere with the descriptions of weather and natural conditions. Regarding weather conditions, accurate recording of heavy rains, extreme cold, or solar eclipses are available in Arabic historiographic texts. These are examples of the types of observations that are most likely to be of use in reconstructing paleoclimatic timeseries. Moreover, extreme natural events and sudden disasters, famines, and epidemics are also mentioned in the manuscripts, due to their severe impact on human societies.
Examples of weather descriptions
One of the pioneers of general concepts of geography in the Maghreb region was al-Idrīsī (d. 1165), born in Ceuta, which was then subordinate to the Almoravid State in Morocco. He was a scientist, writer, geographer, and cartographer who lived in Palermo, Sicily, in the kingdom of Roger II. Apart from his geographical and cartological work, al-Idrīsī is best known for his Nuzhat al-mushtāq fī ikhtirāq al-āfāq (نزهة المشتاق في اختراق الآفاق), or in Latin Tabula Rogeriana, which translates into "the map of Roger" — a book that is organized into seven climate zones of the Earth. He analyzed the succession of seasons and meteorological conditions according to the latitude and longitude. In the introduction of his work, al-Idrīsī writes: "The Earth is divided into two parts, between them the equator which is the longest line in the sphere. The circularity of the Earth at the equator position is three hundred and sixty degrees, and the degree is twenty-five parasangs… However, sixty-four degrees from the equator there are no building in the Earth due to the severity of the cold, the majority of living creatures are in the northern quarter of the Earth, and the southern quarter, which is above the equator is uninhabited due to its heat…". Ibn Khaldun (d. 1406), a social scientist and historian born in Tunis, included a passage about the regional variation of the climate and its impact on the human character in his book al-Muqaddimah (المقدمة) (1378). In his view, the inhabitants of temperate zones are temperate in their physical appearance and character and in their ways of life. They have all the natural conditions necessary for a "civilized" life, such as a means of making a living, dwellings, crafts, political leadership, and royal authority. They thus have religious groups, dynasties, sciences, countries, cities, buildings, horticulture, splendid crafts, and everything else that was considered "temperate".
Moreover, other Maghrebian historians developed a detailed style for ordering historical events, including descriptions of weather events at the time, which can be found in many precious manuscripts, such as Kitāb al-Istiqsā li-akhbār duwal al-Maghrib al-Aqsā (كتاب الاستقصا لأخبار دول المغرب الأقصى) authored by al-Nāṣirī (d. 1897). Al-Nāṣirī is considered to be the main historian of the 19th century in Morocco, as he compiled the entire history of Morocco in several volumes, as well as that of the Islamic West starting with the Islamic conquest by Oqba Ibn Nāfi at the beginning of the 8th century until the end of the 19th century. These volumes include numerous records of climatic information, which indicate, for instance, the wind speed: "In 919 CE, the strong winds uprooted trees and demolished houses in Fez (Morocco) and people stayed in the mosques." The same work mentions — apart from weather conditions and natural disasters — weather-related agricultural and economic events and processes, even with some details of the weight of fallen hailstones: "In 1324 CE, there was famine in Morocco and prices rose in all parts of the country. Wheat and other vegetables became very expensive in Fez, and this lasted until the middle of the following year... on Tuesday, 30 September of the same year, the sky outside the city of Fez was covered with a dark and thick cloud, stormy winds arose and heavy hail fell, a ball weighed at least a quarter of a pound and it rained heavily. The torrents came with silt, and carried people and animals, and destroyed in the mountain of Zalegh all the vineyards, the olives and the rest of the trees."
 |
|
Figure 2: Collection of manuscripts in a private library belonging to the heirs of Abdelkader Meklach in Tétouan, Morocco. |
Another significant work from this region is the book Kitāb al-bayān al-mughrib fī akhbār mulūk al-Andalus wa'l-Maghrib written by Ibn Idhāri al-Marrākushī (d. 1296). This book is one of the most important and comprehensive examples of medieval Arabic history of the Maghreb and Iberia, generally known by its shorter title al-Bayān al-Mughrib (البيان المغرب), or simply as al-Bayān, reviewed and reedited by Colin and Lévi-Provençal (1984). It is valued by modern researchers as a unique resource, and for its preservation of excerpts from lost works. Furthermore, Ibn Idhāri followed a specific method in writing the book that drew on his broad knowledge of the contemporary literature and his access to many oriental and Moroccan writings, in addition to a long list of references that he included in the introduction to his book. Therefore, he was familiar with historical schools and writing styles that existed before his time, especially historical writing in the form of annals (historiographical literature). This method arranges historical events and lists them according to the succession of years and months and is very useful in pinpointing the timing of climatic events, especially when the writer narrates the time of their occurrence with high accuracy.
In his al-Bayān manuscript (Fig. 1), Ibn Idhāri mentions several important events that occurred in Cordoba, Spain, during the year of 331 AH (Year of the Hijra, roughly equivalent to 942 CE), such as: "In 942 CE, … the great flood of the Cordoba river…". In 333 AH (944 CE), he mentions events with extraordinary temporal and spatial precision, sometimes specifying the exact timing: "This year, a major earthquake occurred in Cordoba on the night of Monday, 3 Dhū al-Qaʿdah (3 July), after the night prayer [on 3 July, the night prayer took place at 22:12], nothing like which had ever been seen or heard before, and it lasted an hour. The next day, the strong winds uprooted olive and fig trees as well as palms and took off roof tiles of the houses, then, torrential rains occurred with precipitation of massive hail and the killing of a lot of animals, birds, cattle and damaging crops."
Further potential
Historical climatology research demonstrates the great potential of the archives of societies of the Maghreb region for the reconstruction of past climate of the Mediterranean and beyond. This documentary data is characterized by high precision and a general accuracy of the descriptions of events. To date, texts from Arab historiography are hardly exploited in historical climatology. Furthermore, it must be emphasized that private and public libraries around the world still contain important collections of unused manuscripts (Fig. 2), which may provide relevant data for the reconstruction of past climates in the western Mediterranean.
affiliation
Department of Biology, University Abdelmalek Essaâdi, Tétouan, Morocco
contact
Yassin Meklach: yassin.mclachgmail.com
references
Binebine AC (2004) Dirāsāt fī ʻilm al-makhṭūṭāt wa-al-baḥth al-bibliyūghrāfī. Al-Watania, 306 pp
Gacek A (2009) Arabic Manuscripts. A Vademecum for Readers. Brill, 350 pp
Mathisen R (2008) In: Ashbrook Harvey S, Hunter DG (Eds) The Oxford Handbook of Early Christian Studies. Oxford University Press, 140-168
al-Munajjid Ṣ (1960) al-Kitāb al-‘Arabī al-makhṭūṭ. Maʻhad al-Makhṭūṭāt al-‘Arabīyah, 414 p
Pedersen J (1984) The Arabic Book. Princeton University Press, 175 pp
Sayyid AF (1997) al-Kitāb al-‘Arabī al-makhṭūṭ. al-Dār al-Miṣrīyah al-Lubnānīyah, 614 pp
Zaydān Y (1997) al-Turāth al-majhūl: iṭlālah ʻalá ʻālam al-makhṭūṭāt. Dār al-Amīn, 405 pp
Marie-Michèle Ouellet-Bernier1 and Anne de Vernal2
Historical sources provide unique information on sea ice in a coastal Labrador Sea region. Data extracted from missionary journals permit differentiation of the winter and summer signals. Decadal variations marked winter conditions during the 19th century.
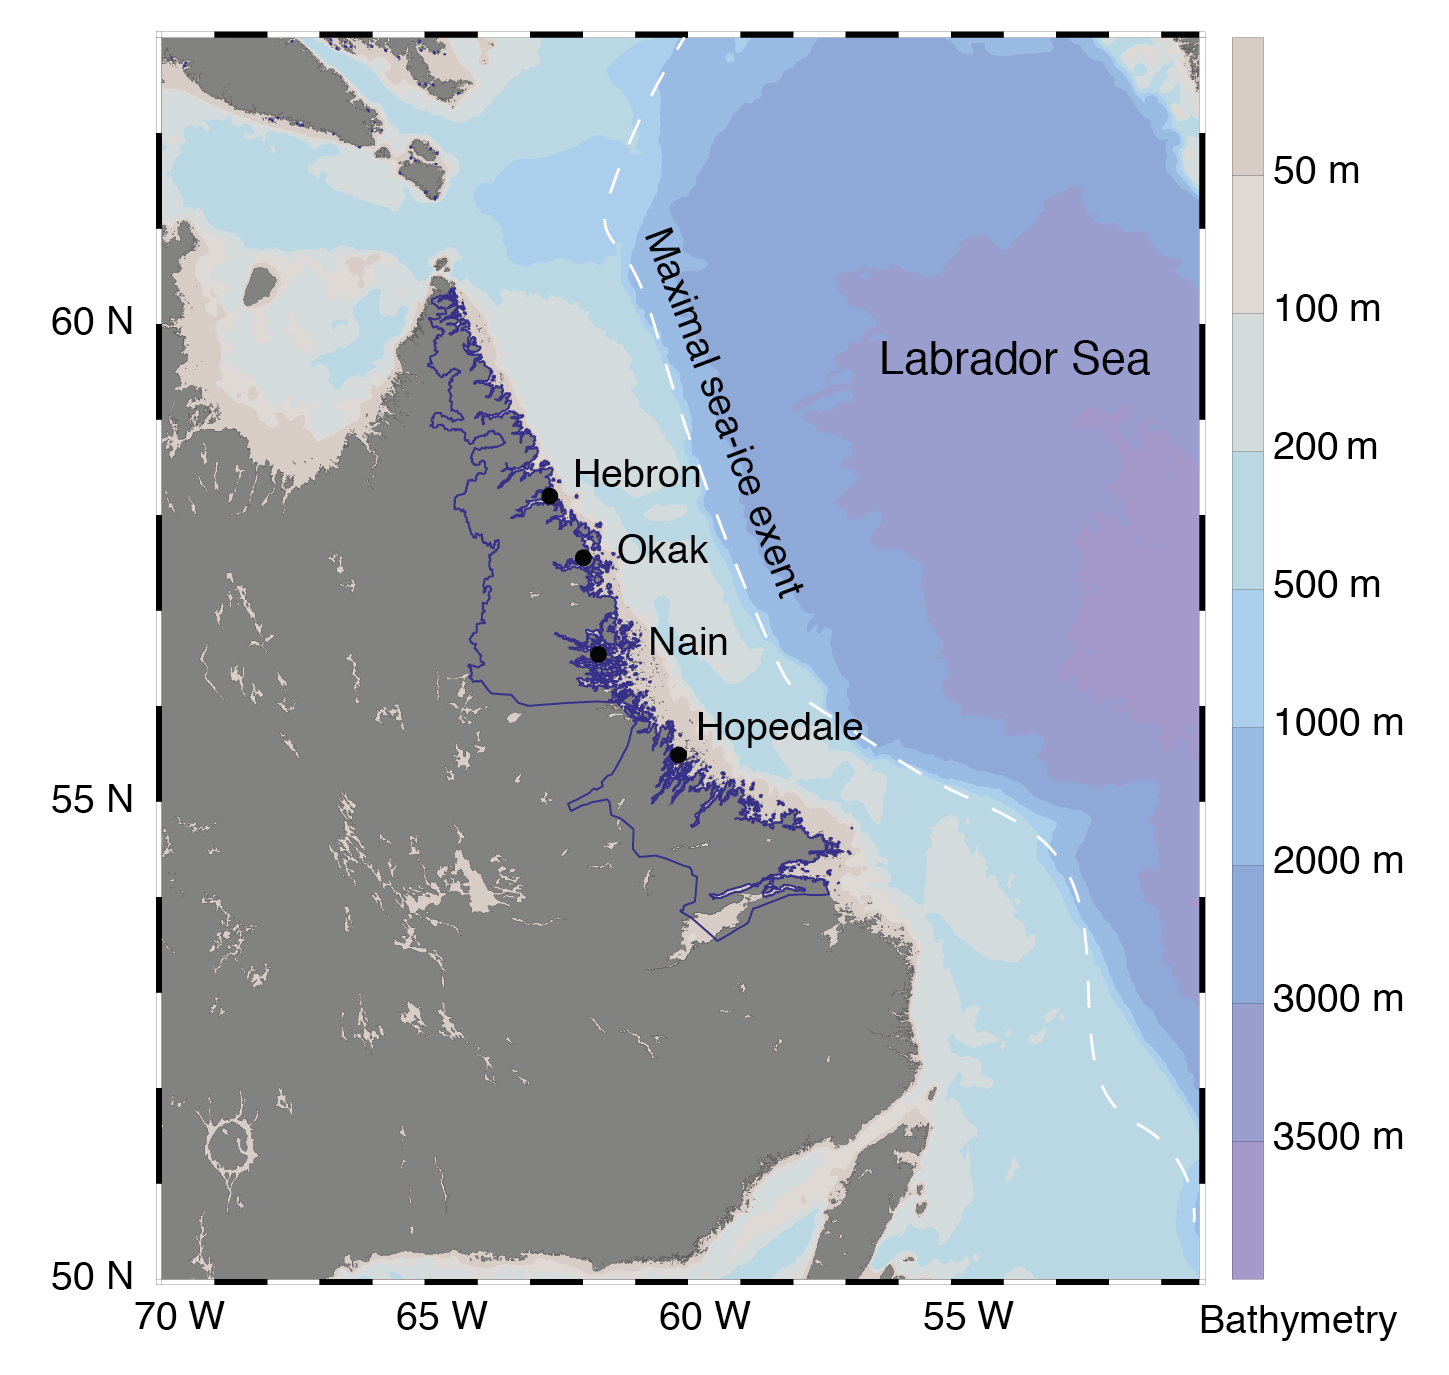
Snow and ice are fundamental in the description of subarctic and Arctic environments. In Nunatsiavut, the autonomous territory of the Labrador Inuit, the land-fast ice forms seasonally along the coast. It is considered as an extension of the land. Land-fast ice is thus very important for cultural activities, communications, mobility, and livelihood (Cuerrier et al. 2015). Usually, land-fast ice forms in mid-December and ice breaks up in mid-June, while drift ice can remain along the coast until late July (Canadian Ice Service 2013; Fig. 1). The historical sources provide punctual information that may help to document the natural variability of sea-ice freeze-up and break-up during the 19th century and before. Attention is specifically directed towards written sources.
 |
|
Figure 1: Map showing the location of sites mentioned in the text and the maximum extent of sea ice as recorded from satellite imagery in March 2019 (National Snow and Ice Data Center, nsidc.org). Nunatsiavut territory is delimited in blue. |
Human occupation
Dorset people arrived from the Central Arctic and settled along the Labrador coast about 650 BCE. They depended on marine resources, and their presence in a region is often associated with extended sea ice (D’Andrea et al. 2011). Migrating from Alaska, the Thule colonization of Labrador began much later, around 1200 CE. It is likely that both Dorset and Thule cultures occupied the Labrador coast from about 1200 to 1500 CE. The Dorset group occupation ended at about 1500 CE; the reason for their disappearance is still unclear. It could be linked to warmer climate and more variable sea-ice conditions, or to competition with the Thule (McGhee 1997). During the 17th century, a transition occurred from Thule to Inuit culture (Kaplan and Woollett 2000). Moravian missionaries established their first mission station in Nunatsiavut in 1770 and started to document their environment and keep written archives (Demarée and Ogilvie 2008). On 18 September 1771, they noted: "In December all is frozen far out to sea and the ice remains until June, or even until July, for they all go wes[t]" (Nain Diary 1771).
Sea-ice freeze-up and break-up
The first record of freeze-up and break-up dates was extracted from Nain Diaries encompassing the period 1771–1808. A transcript is held at the Them Days archive center in Happy Valley-Goose Bay, Labrador. In addition to direct mention of winter freeze-up, the first hunt on ice is considered to be an indicator of ice presence. A correction to the estimate of freeze-up dates was made by taking into account the fact that based on the historical data, the first hunt took place on average five days after the ice formed. The first kayak arrival was taken as an indicator of ice break-up in summer. Here, too, a correction was applied, as the first kayak arrived on average seven days later.
The second set of data was extracted from the Moravian Periodical accounts spanning 1816–1910, which were presented as yearly reports to the Moravian Church headquarters in London (Fig. 2). Freeze-up and break-up dates were noted in Hopedale, Nain, Okak, and Hebron (located at latitudes of 55° to 58°N; Fig. 1). Additional comments regarding exceptional situations were also made. Freeze-up and break-up dates have been standardized for each village in order to remove local climate effects (Fig.2). The duration of sea-ice cover was calculated from freeze-up and break-up dates when both were available. From 1771 to 1910, the mean freeze-up date was 5 December, ranging from 27 October to 10 January; the mean break-up date was 19 June, ranging from 30 May to 20 July. The mean length of sea-ice season represents a total of 196 days (28 weeks; Fig. 2).
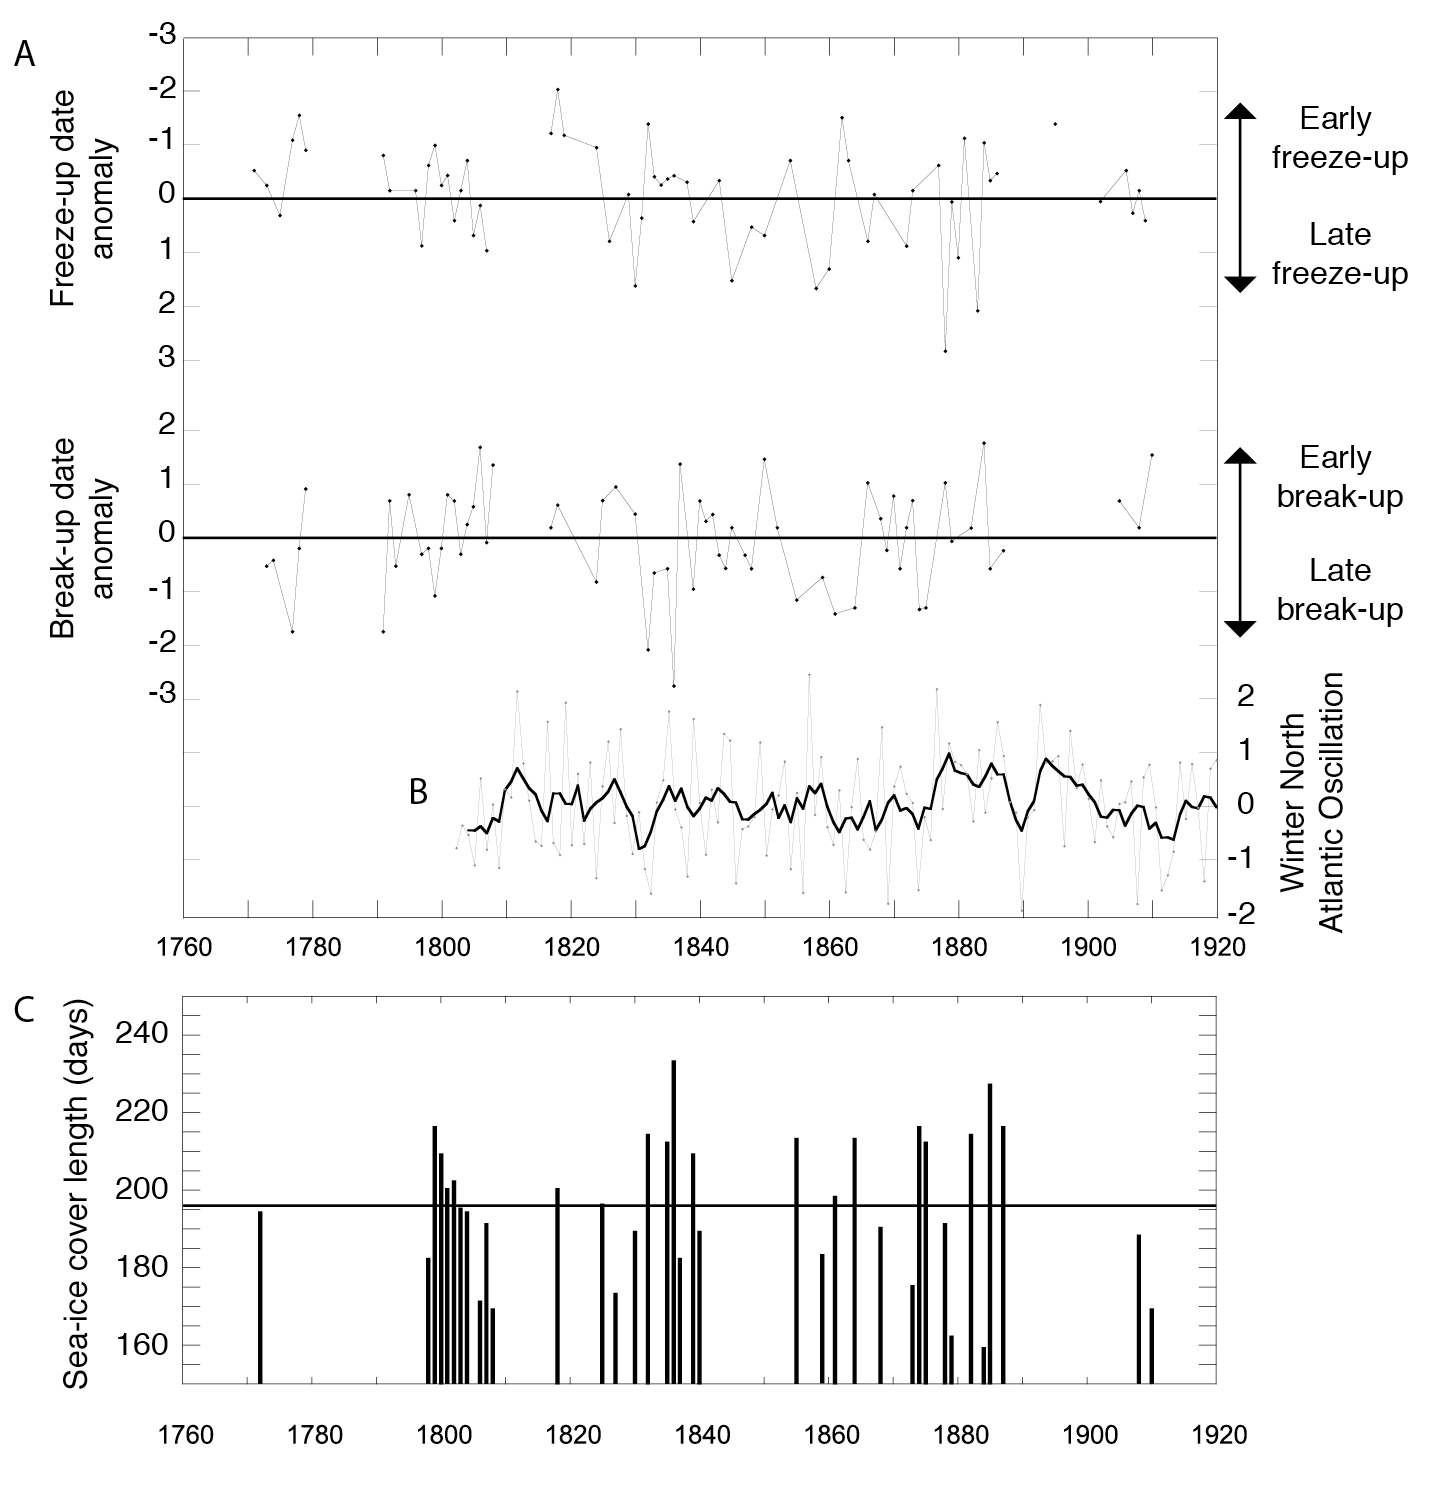
Early freeze-up and late break-up dates were recorded from 1770 to 1810, which corresponds to the end of the "Little Ice Age" (D'Arrigo et al. 2003). Then, a warming trend was observed from the beginning of the 19th century. From 1800 to 1810, break-up anomalies showed a positive trend, representing early break-up dates. Early sea-ice formation was recorded from 1817 to 1824, whereas thaw occurred in early summer. An asynchronous pattern was observed again between 1839–1848 and 1855–1864 with late freeze-up and late break-up. From tree-ring density records, D'Arrigo et al. (2003) suggested that the increase in climatic variability during the first half of the 19th century was accompanied by the occurrence of extreme conditions. From 1865 to 1885, variations between late freeze-up/early break-up and early freeze-up/late break-up resulted in shorter sea-ice cover duration in some years and longer in others (Fig. 2). Afterwards, and until the 20th century, there was almost no mention of ice freeze-up and thaw. The Nunatsiavut population was severely affected by epidemic and food scarcity; therefore, Moravians reported on the humanitarian situation instead of climatic parameters (e.g. Periodical accounts 1895, vol. 3, no. 25).
 |
|
Figure 2: (A) Break-up and freeze-up date normalized anomalies in Nunatsiavut. A positive (negative) freeze-up anomaly represents a late (early) freeze-up, and a positive (negative) break-up anomaly represents an early (late) break-up. (B) Winter North Atlantic Oscillation normalized index (Jones et al. 1997). Black curve shows a five-year running mean. (C) The duration of the sea-ice season (calculated as the number of days between freeze-up and break-up). Horizontal black line shows the mean value over the period. |
A unique window into past winters
The first standardized instrumental winter temperature measurements were made in 1880 (First International Polar Year initiative; Demarée and Ogilvie 2008). The use of historical sources is thus very valuable as it provides an overview on winter conditions before 1880. It is rarely possible to reconstruct winter climate conditions from proxy sources such as tree-ring data, which mostly represent spring and summer (e.g. D'Arrigo et al. 2003). Along the Labrador coast, the sea-ice freeze-up relates to atmospheric and oceanic conditions. Early freeze-up is usually associated with cool temperatures and fresh surface waters in the summer and early autumn (Close et al. 2018). The freeze-up date varied independently from the summer break-up date. The retreat of sea ice usually relates to advection of warm air masses from the south with strong southerly winds (Crane 1978). Summer break-up dates must be used carefully as remaining drift ice along the coast can induce a bias in observation. Strong dominant northwesterly winds can block the Labrador coast with ice for a longer period (Banfield and Jacobs 1998). From long-term observational data, Walsh et al. (2017) demonstrated that Arctic sea-ice variations are driven by air temperature, wind forcing, radiative forcing, and ocean heat fluxes.
Intra- to multi-annually resolved information
Historical sea-ice information offers the possibility to develop records with intra-annual temporal resolution and to provide both summer and winter perspectives on climate states. However, multiple years are missing in the historical records, as missionaries do not always refer to climate in the periodical accounts.
A relationship between winter temperature and sea-ice cover in the Labrador Sea/Baffin Bay area and the North Atlantic Oscillation (NAO), which is calculated from the surface sea-level pressure difference between the Azores and Iceland, was supported by Hurrell and Deser (2010). In our study, winter freeze-up shows large amplitude variations, which might be linked to the NAO. Winter NAO was in a positive mode during the 1830s, which corresponds to enhanced sea-ice duration and extent, and a low sea-surface temperature. Our calculations indicate that sea ice was present more than 200 days per year in 1831, 1834, 1835, and 1838.
Outlook
From 1770 to 1810, freeze-up and break-up dates show long sea-ice seasons characterized by both early freeze-up and late break-up. From 1816 to 1880, the length of the sea-ice season varied considerably, with the freeze-up and break-up dates showing no relationship. From 1875 until the early 20th century, a trend to later freeze-up in winter and earlier break-up in summer is observed, which probably results from regional climatic warming. As winter temperature data are typically not available from natural proxies such as tree-rings, historical data from written sources offer a unique perspective on winter and summer onset in Nunatsiavut dating back to 1770.
affiliations
1Institute of Environmental Sciences, University of Quebec in Montreal, Canada
2Department of Earth and Atmospheric Sciences, University of Quebec in Montreal, Canada
contact
Marie-Michèle Ouellet-Bernier: ouellet-bernier.marie-michelecourrier.uqam.ca
references
Banfield CE, Jacobs JD (1998) Can Geogr 42: 354-364
Close S et al. (2018) Clim Dyn 51: 2485-2508
Crane RG (1978) Arctic 31: 434-447
Cuerrier A et al. (2015) Hum Ecol Interdiscip J 43: 379-394
D'Andrea WJ et al. (2011) Proc Natl Acad Sci USA 108: 9765-9769
D'Arrigo R et al. (2003) Clim Dyn 20:219-228
Demarée GR, Ogilvie AEJ (2008) Clim Change 91: 423-450
Hurrell JW, Deser C (2010) J Mar Syst 79: 231-244
Jones PD et al. (1997) Int J Climatol 17: 1433-1450
Kaplan SA, Woollett JM (2000) Arct Antarct Alp Res 32: 351-359
McGhee R (1997) In: Gilberg R, Gullov HC (Eds) Fifty years of Arctic research: Anthropological studies from Greenland to Siberia. Cambridge Univerity Press, 209-213
Nain Diaries (1771-1808). Brethren's Society for the Furtherance of the Gospel, English Translation. Housed at Them Days, Happy Valley-Goose Bay, Labrador, Canada. Original manuscript in German can be found at the Unity Archives of Herrnhut.
Walsh JE et al. (2017) Geogr Rev 107: 89-107
additional resource
Canadian Ice Service (2013). Environment Canada:
Heli Huhtamaa1, S. Helama2, L. Leijonhufvud3 and F. Charpentier Ljungqvist4
Combining information from proxy materials stored in natural and man-made archives helps to gain a more comprehensive understanding of past climate–society relationships. This is demonstrated here with an example from tree-ring and tithe data from the 16th- to 17th-century Swedish Realm.
The impacts of future climate change on agriculture form a crucial issue for food security. Valuable insights into this topic can be gained by studying the impacts of past climate on crop cultivation – not only in recent history, but also over past centuries. Use of only the most recent data increases the risk of addressing symptoms rather than deep-rooted causes (Adamson et al. 2018). Yet, such deeper historical dimensions are not extensively examined in the literature. This is likely because direct statistical data on climate and agricultural production become available mainly from the 19th century onwards. Nevertheless, for periods further back in time, we can use indirect, i.e. proxy, data to study the relationships between climatic and agricultural fluctuations. These proxy data can be found in either the "archives of nature", such as ice layers and tree rings, or in the "archives of society", composed of written documents. This article discusses some of the main issues in combining proxy data from both types of archives by presenting a case study on temperature and grain harvest fluctuations from the 16th- to 17th-century Swedish Realm (comprising roughly the area of modern-day Sweden, Finland, and Estonia).
Proxies of temperature and grain yields
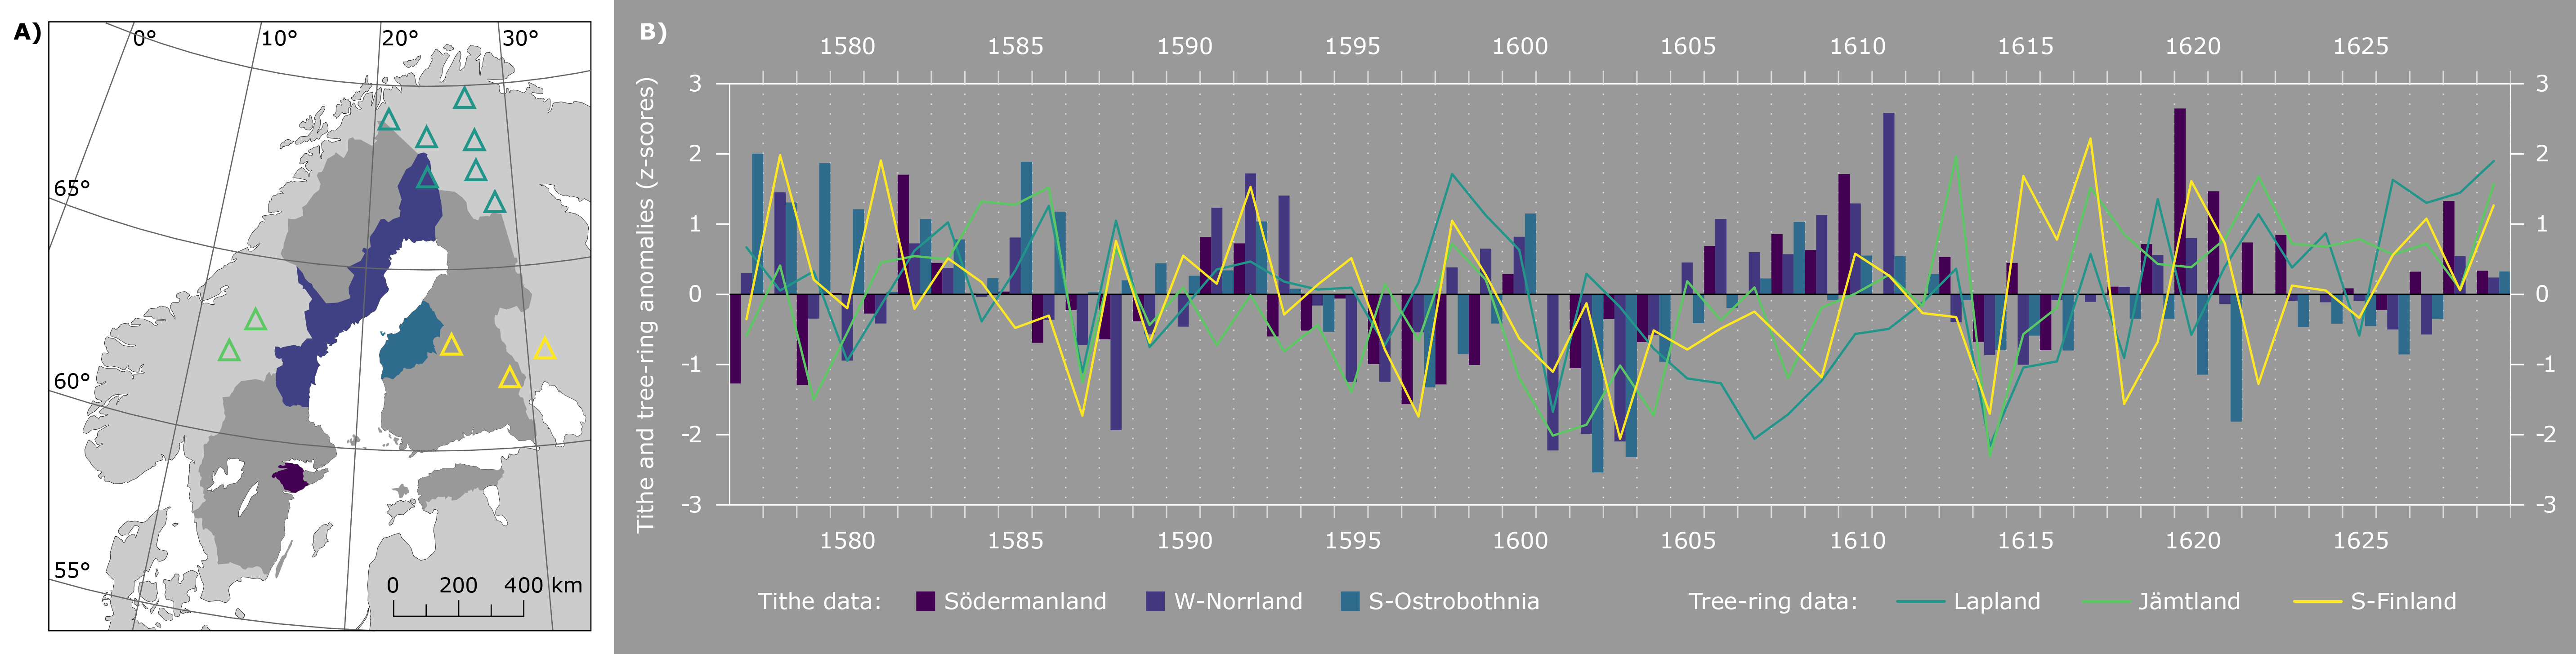
Meteorological data and countrywide agricultural statistics are both available from 19th-century Sweden and Finland. Analysis of these series has previously revealed that temperatures and yields of principal grains generally show positive and statistically significant correlations, with warmer conditions bringing higher yields (Holopainen et al. 2012; Huhtamaa et al. 2015). Prior to this "statistical era", the availability of crop-yield and instrumental temperature data decreases dramatically. For annual harvest data, some sporadic yield-ratio series are available from the 16th and 17th centuries. Yet these commonly indicate the yield ratios of manorial estates, i.e. the productivity of fields owned by the nobility. The great majority (>80%) of the population in Sweden and Finland were, however, peasants. Nevertheless, grain tithes can provide an alternative source to detect annual yield fluctuations. The tithe was a tax that every land-holding peasant was obliged to pay in the 16th- to 17th-century Swedish Realm. Although collection practices varied slightly across the kingdom, each peasant household, in general, was supposed to pay approximately 10% of their annual grain harvest as tithes. The tithes commonly consisted of roughly equal shares of barley and rye, but in the northernmost areas, the tithes were paid almost entirely in barley. Here we use tithe data from three old administrative areas: the province of Södermanland and the land of western Norrland in Sweden (Leijonhufvud 2001), and the province of southern Ostrobothnia in Finland (Huhtamaa and Helama 2017a).
 |
|
Figure 1: (A) Three historical districts for the tithe data (coloring) and the average sampling sites of the tree-ring data (triangles). The darker grey area illustrates the extent of the Swedish Realm in 1600. (B) Annual tithe variations and tree-ring reconstructed temperature variability (standardized over the period 1577–1629). |
In addition to using documentary evidence, crop yields and temperatures could be reconstructed using tree-ring data available from both countries (Fig. 1). Here we use maximum latewood density (MXD) chronologies of Scots pine (Pinus sylvestris L.) tree rings from Lapland (Matskovsky and Helama 2014), southern Finland (Helama et al. 2014), and Jämtland (Sweden) (Gunnarson et al. 2011). All of these reconstructions explain around 60% or more of the total variance in the measured annual warm season temperatures. Furthermore, the Finnish MXD chronologies reliably indicate relative variations in grain yields in central and northern Finland (Huhtamaa and Helama 2017b).
Tree rings and tithes
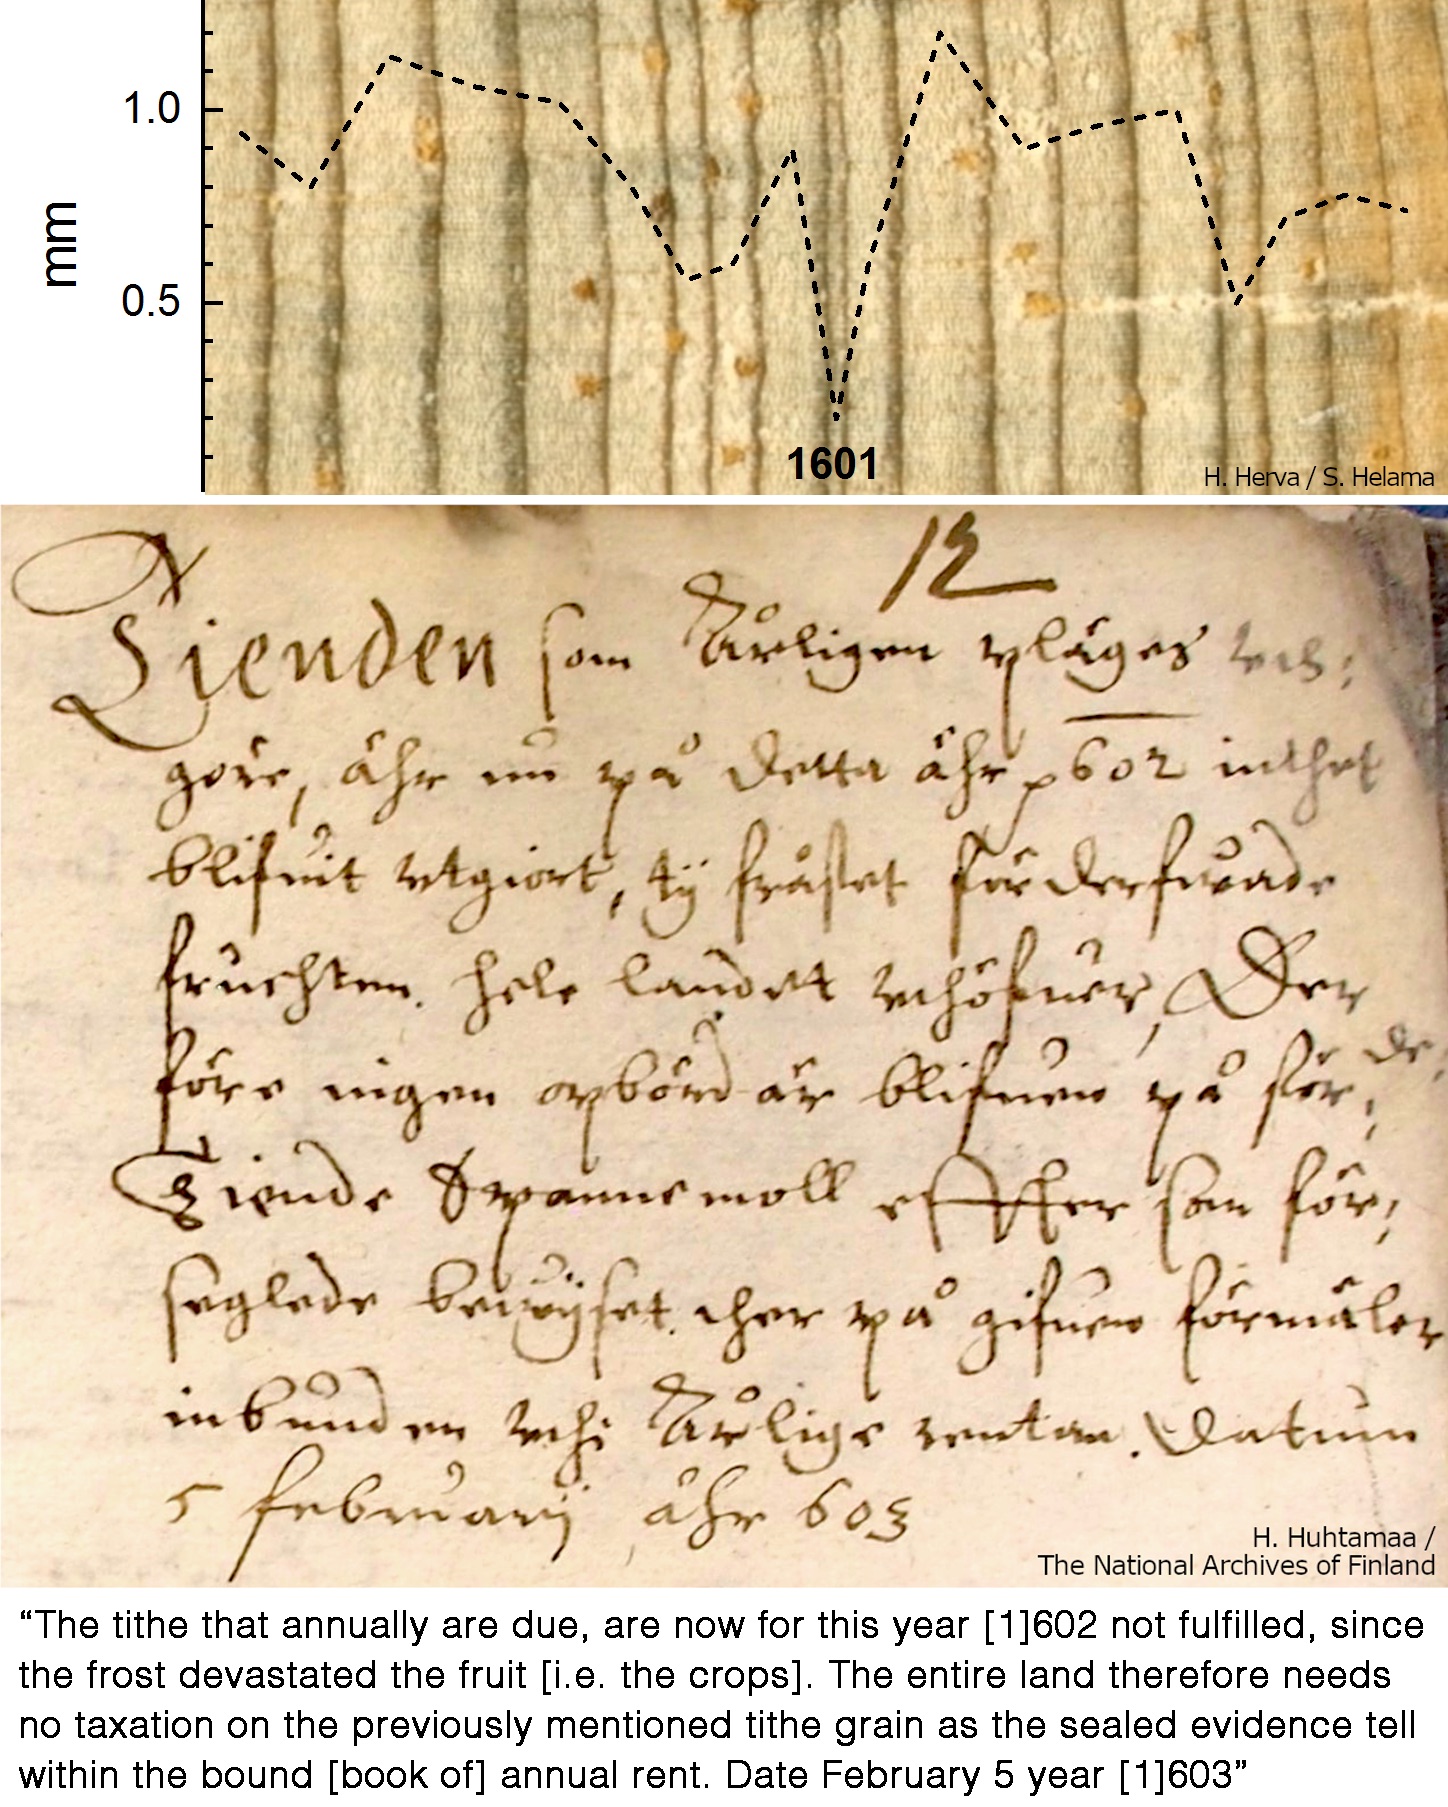
The years with strong drops in MXD-based growing season temperatures were found to match the years when all the tithe series indicated poor harvests. These years include 1587, 1601, and 1614 (Fig. 1). This suggests that although the harvest was influenced by local environmental conditions and man-made factors, at least during the years representing relatively average climatic conditions, severe kingdom-wide harvest failures were likely driven by climate extremes. In this regard, the climatic "downturn" of 1601–1604 following the 1600 Huaynaputina volcanic eruption is especially visible in both types of data (Fig. 2). In fact, the 1601 harvest failure was so complete that in many provinces the authorities decided not to collect grain tithes at all (Huhtamaa and Helama 2017a).
Furthermore, the comparison of the MXD and tithe data reveals that harvests remained poor for at least one year after the year of poor harvest – even if climatic conditions would have supported higher yields (e.g. see year 1588 in Fig. 1). The early modern Swedish Kingdom expected peasants to be self sufficient regarding seed grain. Thus, the harvest year following the crop failure remained poor as well, as only part (if any) of the fields could be sown due to empty grain stores. Consequently, insufficient preparedness to cope with large-scale crop failures, as well as inadequate seed grain storage, worsened the agricultural impacts.
 |
|
Figure 2: The year 1601, evidenced in tree-ring samples from Finnish Lapland and written material from northern Finland. As the tithes were collected the following winter, the tithe year 1602 actually reflects the harvest year 1601. |
The MXD measurements do not correlate as strongly with the 16th- to 17th-century tithe data as with the 19th-century yield data. This is hardly surprising, however, as the latter provide an indication of relative productivity fluctuations, whereas tithes can be more illustrative of the total quantities of grain harvest output. The total amount of taxed harvest may, in turn, have been influenced by several factors other than climate, such as the quantity and quality of seed grain, the size of the arable fields, and even the strictness of individual tax collectors. Moreover, the tithe series from Södermanland agreed least with the MXD-based temperature reconstructions (Fig. 1). This is likely due to the long distance between the province and MXD sites. Additionally, northern grain yields, like MXD, were more sensitive to the length and thermal conditions of the growing season than yields in southern Sweden, where winter temperatures and summer precipitation markedly influenced the harvest (Edvinsson et al. 2009).
Discussion and conclusions
Data from both natural and man-made archives are needed when studying climate and grain harvest fluctuations in the era preceding official statistics. Meaningful comparisons require natural and written materials representing the same climate variables and similar spatio-temporal coverage and resolution. Thus, for example, temperature-sensitive tree-ring data from Sweden and Finland are not suitable to explore climate–harvest relationships in precipitation-sensitive agricultural areas further south. Moreover, when studying annual harvest fluctuations, the natural materials used for comparisons need to be dated to absolute calendar years to demonstrate inter-annual variability comparable to historical data. Among the different natural proxy types, only tree-ring chronologies are routinely converted to calendar years, making them directly comparable to historical data, with no need to speculate on dating issues.
The natural and man-made archives shown here (MXD and tithes, respectively) both serve as proxy materials, i.e. data indirectly indicative of past variations in climate and crop yields. In this sense, tree-ring data can be used to demonstrate climatic impacts on crop yields, whereas grain tithes indicate the quantity of the harvest. Additionally, when further information is needed, yield ratios, for example, can indicate the relative productivity variations and grain prices the fluctuations in grain availability. None of these different types of data alone provides us with a comprehensive picture of past harvest fluctuations. Combining these sources, however, provides us with a much more detailed understanding of the past.
affiliations
1Oeschger Centre for Climate Change Research and Institute of History, University of Bern, Switzerland
2Natural Resources Institute Finland, Rovaniemi, Finland
3Department of Historical Studies, University of Gothenburg, Sweden
4Department of History and Bolin Centre for Climate Research, Stockholm University, Sweden
contact
Heli Huhtamaa: heli.huhtamaahist.unibe.ch
references
Adamson GCD et al. (2018) Global Environ Change 48: 195-205
Edvinsson R et al. (2009) Väder, skördar och priser i Sverige. In: Liljewall et al. (Eds) Agrarhistoria på många sätt: 28 studier om människan och jorden. Kungl. Skogs- och lantbruksakademien, 115-136
Gunnarson BE et al. (2011) Clim Dyn 36: 97-108
Helama S et al. (2014) Geochronometria 41: 265–277
Holopainen J et al. (2012) Holocene 22: 939-945
Huhtamaa H, Helama S (2017a) J Hist Geogr 57: 40-51
Huhtamaa H, Helama S (2017b) Holocene 27: 3-11
Huhtamaa H et al. (2015) Boreal Env Res 20: 707-723
Leijonhufvud L (2001) Grain Tithes and Manorial Yields in Early Modern Sweden. Swedish University of Agricultural Sciences, 359 pp
Adrian Jusupović1 and Martin Bauch2
Narrative sources of the medieval period from the historic lands of the Rus’ principalities, which include parts of modern-day Russia, Ukraine, Belarus, and Eastern Poland, provide a trove of historical weather information. The long tradition of Russian climate historical research is rather unknown outside of this region.
From the 12th to the 16th centuries, the Kievan Rus' (existing from the 9th century) consisted of self-governing principalities ruled by descendants of the Rurikid dynasty and is considered the historical precursor to modern-day Russia, Ukraine, and Belarus. While academic scholarship has paid considerable attention to the ethnic origins (Norse and/or Slavic) of their elite groups, the potential of Rus'ian historiography for the reconstruction of climatic conditions of the High Middle Ages in Eastern Europe has been largely ignored outside Russia. This article focuses on climate history but aims to shed more light on this historical period and region as well.
Medieval Rus'ian narrative sources
Beginning in the mid-10th century, Rus'ian chroniclers recorded information about weather and natural extreme events, many of which they witnessed firsthand. The scriptoria functioned next to the episcopates. In the 12th century, chronicling started to become a more common practice not only in Kiev and Novgorod but also in the self-governing principalities (e.g. the city of Vladimir, today 200 km east of Moscow).
 |
|
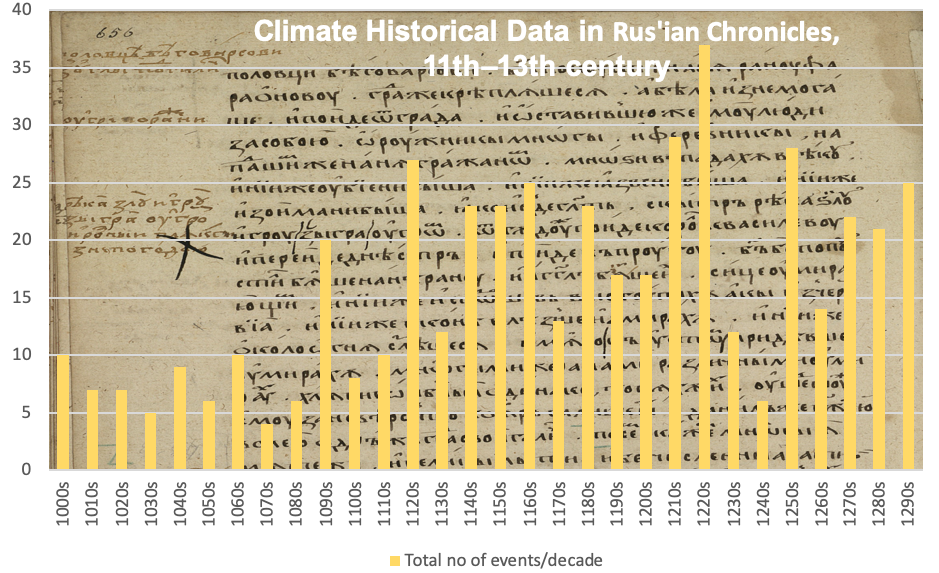
Figure 1: Number of meteorological extreme events, famines, epizootics, and epidemics mentioned in Rus’ian narrative sources between 1000 and 1300 CE in decadal values, according to Borisenkov and Paseckij (1983, pp. 79, 82, 86). |
The following excerpt about a severe winter in January 1287 from the Chronicle of Halych-Volhynia serves as an example of the kind of information on meteorological conditions included in these sources: "[The Tatars] remained in Lev's principality for two weeks, living off the fat of the land. They did not engage in open warfare, but neither did they let anyone leave the city for food. [Of those that dared] leave the city, they would kill some, capture others, and rob [still] others, [releasing] them stark naked [to die] from the cold, because there was a very severe winter [that year]" (Perfecky 1973, p. 97). The Rus' sources do not only provide information about their own territory, but also report on unusual weather events from other parts of Europe, such as the St. Lucia's Day flood along the North Sea coast on 14 December the same year: "[It was rumored] that in the land of the Germans the sea overflowed its bank and inundated the country because of God's wrath. More than sixty thousand people drowned and one hundred and eleven stone churches were inundated, not counting those made of wood" (Perfecky 1973, p. 98).
Historiography of Russian climate history
In the latter half of the 1700s, scholars at the St. Petersburg Academy of Sciences began analyzing the wealth of climatic information recorded over centuries in Russian sources. In the first decades of the 19th century, Russian researchers were preparing statistical summaries about Russian climate from 147 temperature measurement sites throughout Russia. Konstantin Veselovskij collected this data and compared it with historical information extracted from different types of sources, going back as far as the era of Herodotus up to his contemporary age (1857; Zhogova 2013). Mikhail Bogolepov continued this pioneer work in climate history around the turn of the 12th century by collecting and analyzing information from published Cyrillic and Latin sources dating from the 10th century onwards (Bogolepov 1907; 1908). This body of Russian scholarship on climate history includes studies about anomalous weather (e.g. Borisenkov and Paseckij 1983; Borisenkov 1988); reconstructions showing fluctuations in Russian climate (e.g. Liakhov 1984; Borisenkov 1988; Klimanov et al. 1995; Klimenko et al. 2001; Slepcov and Klimenko 2005; Klimenko and Solomina 2010); fluctuations in river levels (Oppokov 1933); and famine years in Russia (Bozherianov 1907). The available information dates as far back as the early 11th century (see Fig. 1), though there is a significant drop in documentation in the 1230s and 1240s, likely due to the Mongol invasion of Rus' principalities in 1237.
 |
|
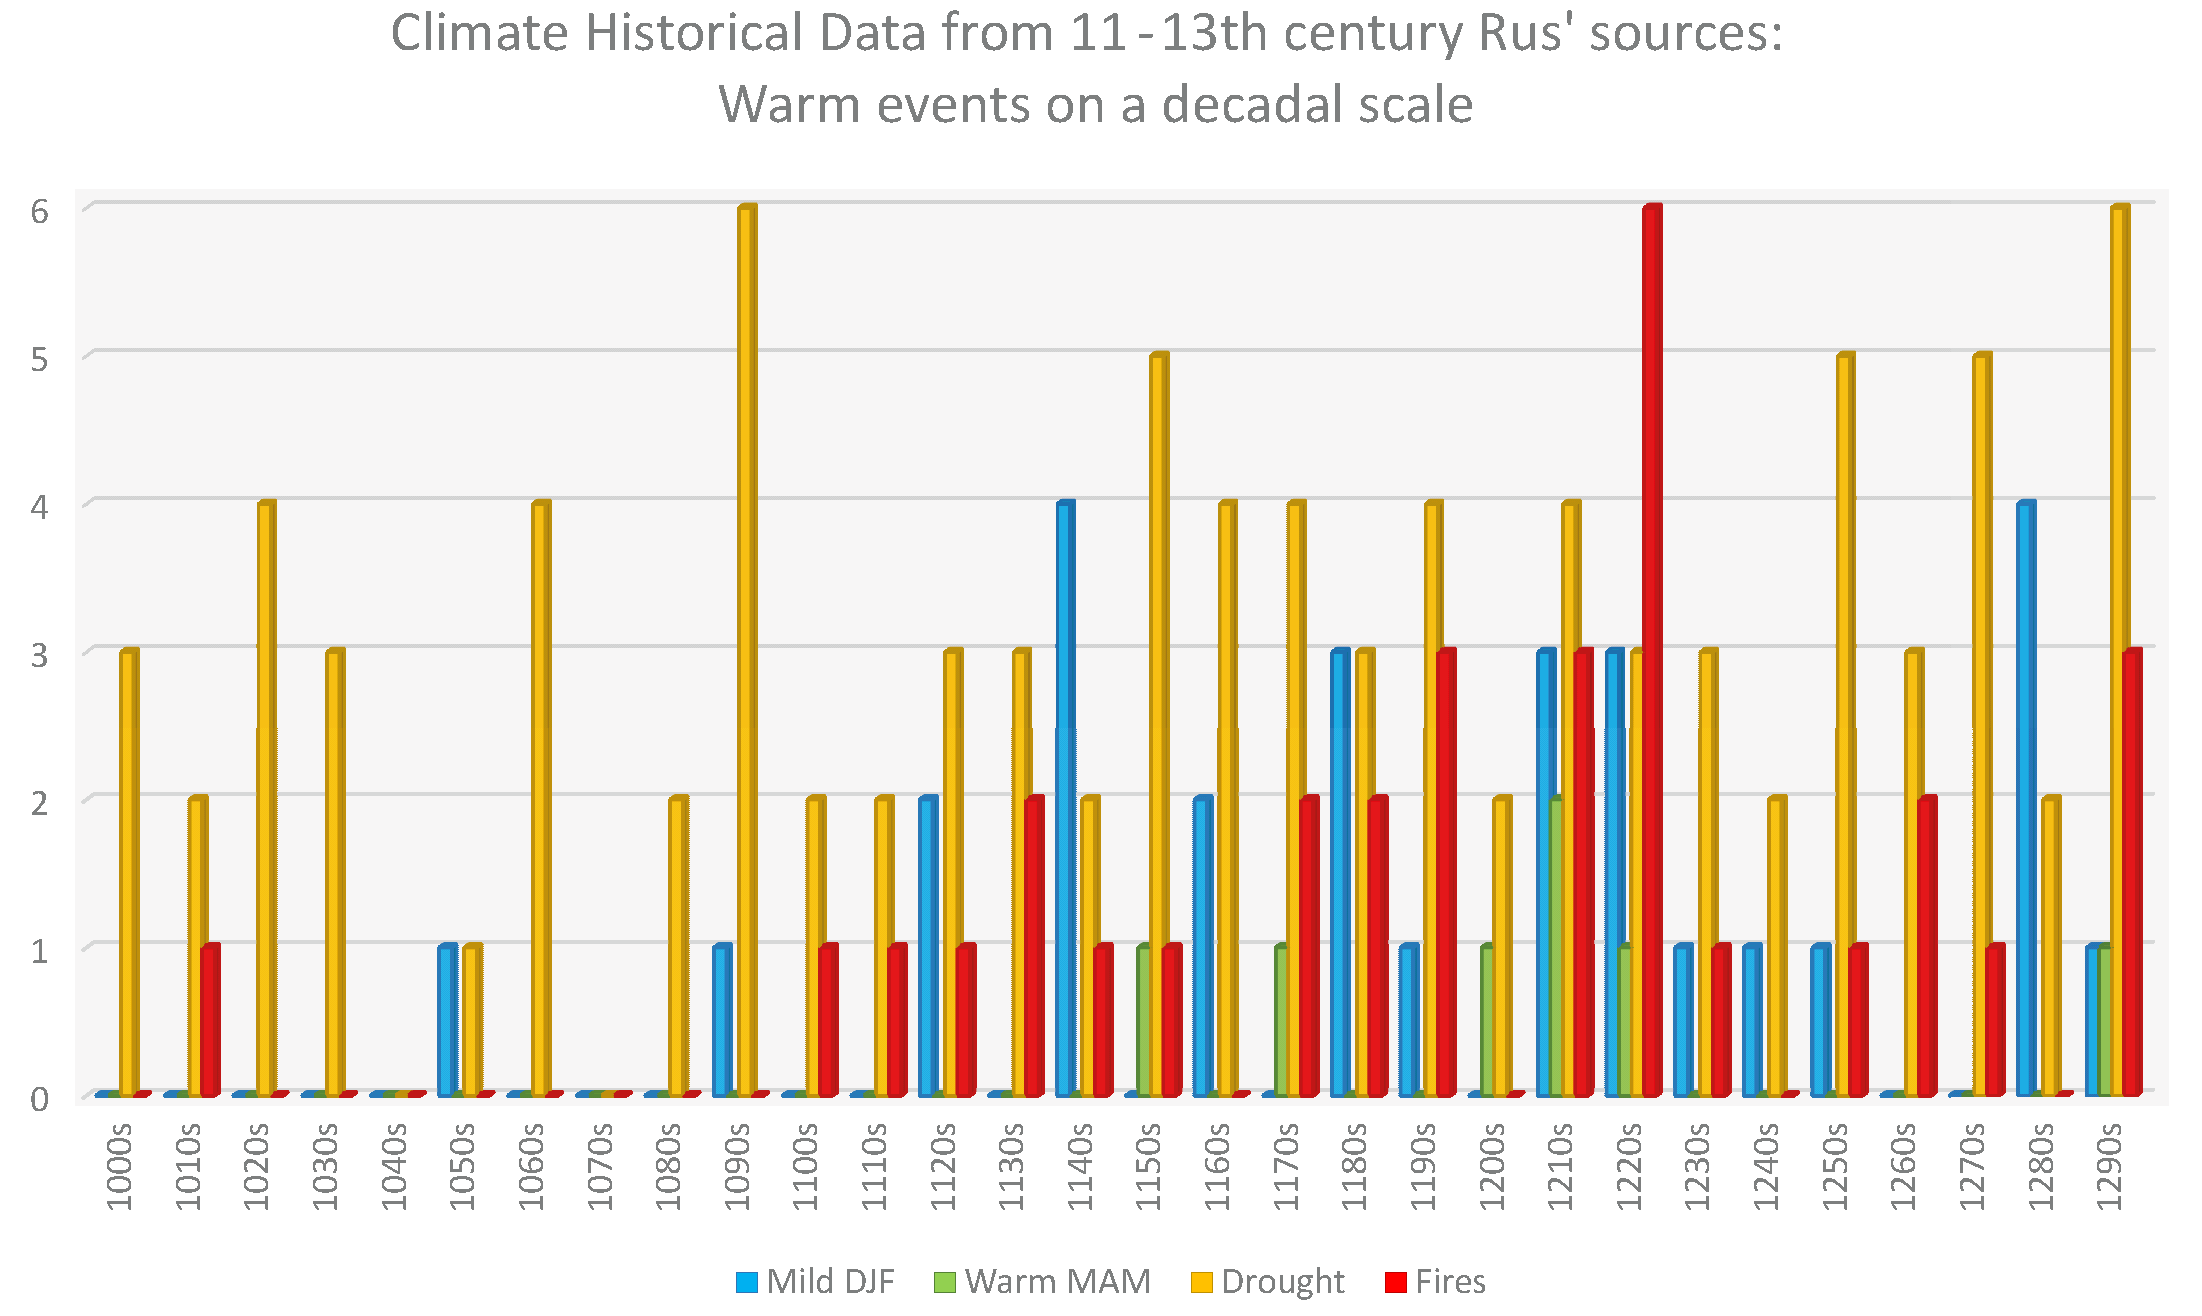
Figure 2: Number of meteorological extreme events related to warm conditions and numbers of city fires in Rus’ian narrative sources between 1000 and 1300 CE in decadal values according to Borisenkov and Paseckij (1983, pp. 79, 82, 86). |
Methodological approaches and difficulties in Russian climate history
While the source density of meteorological information from Rus' sources is considerable, most of the research does not use the original editions or appraise them critically. Instead, modern scholars have relied for the most part on Evgenij Borisenkov and Vasilij Paseckij's quantitative evaluation (1983), which incorporates only some of the available sources. The most important collection of Russian narrative sources is what is known as the ПСРЛ [Complete Collection of Rus'ian Chronicles]. Spanning 43 published volumes, these chronicles report on events such as insect infestations, droughts, unusually wet summers and autumns, early and late frosts, famines, floods, and storms. When Borisenkov and Paseckij compiled their statistics (which also includes data from Western Europe, i.e. from England, France, Germany, and the Netherlands), only 37 volumes of the ПСРЛ had been published; furthermore, Borisenkov and Paseckij frequently referred to later literary mentions rather than the original sources. It is thus not clear how they defined a drought, in which seasons it occurred, and which regions were affected (Fig. 2).
As a result, this study, as valuable as it is as the backbone of all reconstructions from documentary data in pre-modern Russia and a pioneering work, should be used with extreme caution. Borisenkov and Paseckij tried to reconstruct the Russian climate over the course of the last 1000 years, albeit with a descriptive approach rather than by applying quantitative methods such as climate indices. The existing historiography on the written sources published thus far for the territory of modern Russia must accordingly be deemed patchy and insufficiently analytical, and none of these studies incorporates the quantitative approaches established in climate history, nor do they meet the basic requirements of modern historical scholarship with regard to source criticism. In the last few years the approach to reconstructing Russian climate has changed, as researchers have looked beyond historical sources and included tree-ring reconstructions, palynological data, lake sediment records, and biostratigraphic analyses (e.g. Klimenko and Solomina 2010; Klimenko 2016).
Objectives for the near future
Closer collaboration between climate historians and specialists on early Russian narrative sources would provide a critical, up-to-date catalog of extreme events and weather-related information, not only from Rus'ian chronicles, but for the whole territory of modern-day Russia and its immediate neighbors in Eastern Europe and Central Asia. Careful English translations of original sources would allow the international community of historical climatologists to work with documentary data of Rus' and Russian origin, which could later become part of established databases such as www.tambora.org or www.euroclimhist.unibe.ch. Such an endeavor would fill the geographical gap between the dense repositories of climate-historical information for the countries of Western and Central Europe and the rich compendia organized by Chinese scholars.
affiliations
1Institute of History, Polish Academy of Sciences, Warsaw, Poland
2Leibniz Institute for the History and Culture of Eastern Europe, Leipzig, Germany
contact
Adrian Jusupović: ajusupovicihpan.edu.pl
references
Bogolepov MA (1907) Землеведение 14: 58-162
Bogolepov MA (1908) Землеведение 15: 41-58
Bozherianov IN (1907) Starving of the Russian nations from 1024 to year 1906. Gannibal, 32 pp
Klimanov VA et al. (1995) Известия Российской Академии Наук. Серия географическая 1: 89-96
Klimenko V (2016) Holocene 26(3): 365-379
Klimenko V et al. (2001) Доклады Российской Академии Наук 376: 679-683
Klimenko V, Solomina O (2010) In: Przybylak R et al. (Eds) The Polish Climate in the European Context. An Historical Overview. Springer, 71-102
Liakhov МЕ (1984) Известия Академии Наук СССР. Серия географическая 6: 68-74
Oppokov EV (1933) Research of rivers of the USSR 4
Slepcov AM, Klimenko VV (2005) История и современность 1: 118-137
Zhogova ML (2013) Естественные науки. История естествознания 1: 160-167
Antony G. Brown1,2, B. Pears2, P. Toms3, J. Carroll4, J. Wood3 and R. Jones5
Floods are a natural component of our environment, and are constantly changing due to both natural and human factors. However, they leave physical and societal evidence in sediments and place names.
An increase in late 20th- and 21st-century river floods in the UK and other parts of Europe, including France, Spain, Poland, and the Czech Republic, highlights the urgent need to better understand flood magnitudes and return frequencies across short (decadal to sub-centennial) to medium (centennial to millennial) timescales in order to prepare for future events. Key to generating robust predictive models is the ability to track, with greater precision and across greater expanses of time, the nature of past floods and to set these against the various climatic and anthropogenic factors that contributed to their occurrence. For the UK, the timeline for the formal recording of empirical observations revealing magnitude and reach of individual flood events is woefully short, rarely providing reliable data before the 17th century CE (Macdonald and Sangster 2017). Other evidence is needed to extend this record back through time. Since every flood leaves a physical signature of its passing, constructing chronostratigraphic models from alluvial sediments gives direct insight into fluvial activity potentially over millennia. Less obviously, we can draw upon the observations made by early medieval communities of river behaviors, initially communicated through, and now preserved within, the names they gave to riverside settlements.
Sedimentary histories
The use of fluvial sediments as flood archives has a long history. These are usually reconstructed in bedrock reaches where channel stability permits the cross-sectional area of floods to be calculated. This is more problematic in non-bedrock alluvial systems characteristic of lowland Britain and much of Europe. But where channels have stabilized, a flood archive is sometimes preserved in deep floodplain sediments. With advances in optically stimulated luminescence (OSL) dating, reliable to ±10% (1σ), these clastic sequences can be dated in the absence of organic material and, when analyzed using high-resolution proxies including X-ray fluorescence (XRF), provide insights into fluvial depositional conditions and flood events (Brown et al. 2013; Pears et al. 2020a; Pears et al. 2020b; Pears et al. in prep).
 |
|
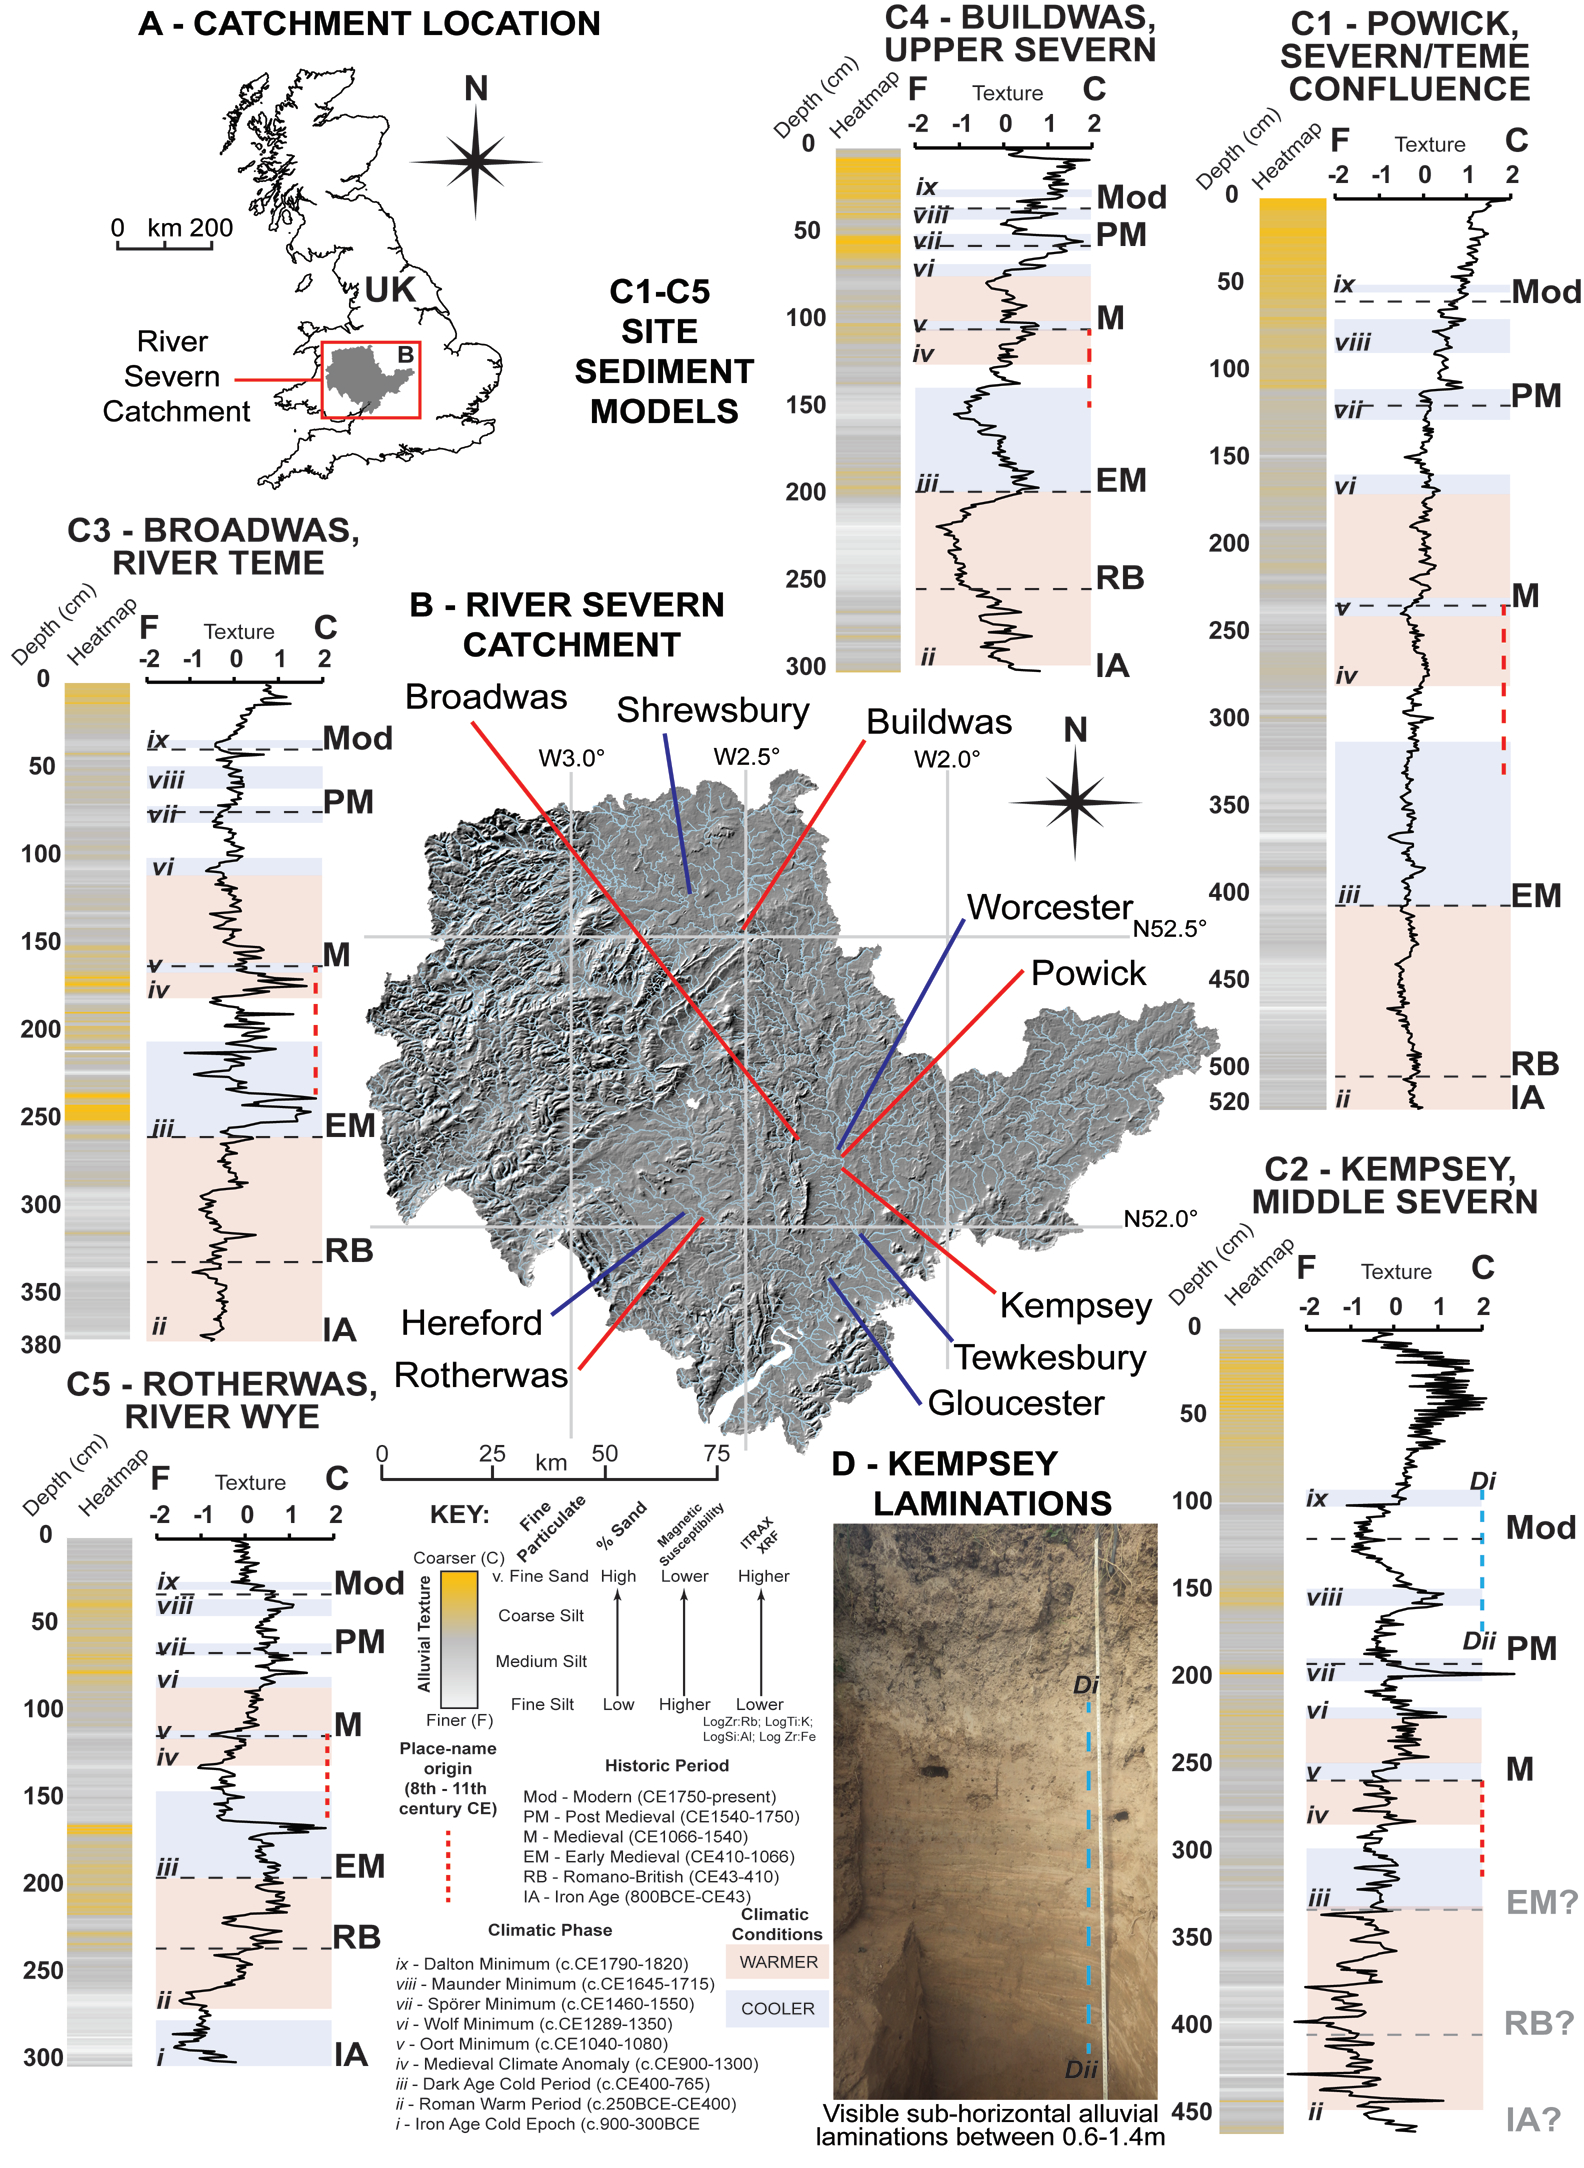
Figure 1: (A) River Severn catchment in UK; (B) Locations of sample sites (red) and urban centers (blue); (C) Reconstructed chronostratigraphic line and heatmap models of Late Holocene alluvial texture from (C1) Powick, (C2) Kempsey, (C3) Broadwas, (C4) Buildwas, (C5) Rotherwas. Models created from log-normalised data (Pears et al. 2020a; 2020b; in prep) and shown with climate phasing and place-name derivation; (D) Photographic record of Kempsey laminated sequence. |
Recent research at Powick, Worcestershire, UK, at the Severn-Teme confluence (Pears et al. 2020b) demonstrates channel stabilization from ca. 3500 years before present followed by unabated vertical floodplain accretion from the Middle Iron Age onwards (ca. 300 BCE). The results show subtle variations in depositional character from the start of the medieval period, with a dramatic increase in fluvial activity from the 16th century CE. Similar chronologies and fluvial signatures at other sites across the Severn catchment demonstrate broad correspondences in depositional character (Brown et al. 2013; Pears et al. 2020a). These can be set against the historical climate record and potential contributory anthropogenic factors, including land-use change, agriculture, and embanking (Lewin 2013; Macklin et al. 2014).
At Kempsey (Fig. 1), south of Powick, a recently analyzed sediment sequence contains exceptionally well-preserved coarse flood laminations (Pears et al. in prep). These laminae can be correlated with relative confidence to historically attested major floods between ca. 1600 and ca. 1840 CE and to other unrecorded flood events (Macdonald and Sangster 2017). Tellingly, a correlation can be demonstrated between flood-rich periods and the two significant solar minima of this period, the Maunder Minimum (ca. 1645–ca. 1715 CE) and Dalton Minimum (ca. 1790–ca. 1830 CE), indicating solar activity as a potentially significant contributory factor in the behavior of the Severn. Critically, these laminae permit us to estimate the discharges of some of the largest recorded historic events. They also indicate that the return frequency of floods might vary significantly across time. The Severn's response to Maunder and Dalton differed. This has implications for understanding future flooding, particularly since it is predicted that we are entering the next Grand Solar Minimum.
Name histories
Many British river names tell us something about their general geomorphological and hydraulic characteristics. These include names which describe channel sinuosity and rates of flow (Fig. 2b). However, more specific and localized information is more often encountered in riverside settlement names. Place names originated as meaningful descriptions which arose in everyday speech or within administrative contexts. In England, most town and village names were formed between the 8th to 11th centuries CE in early varieties of English (Old English) and Scandinavian (Old Norse). They inform on the historic landscape, including riverine behavior (Jones 2016; Jones et al. 2017). Place names record types of watercourse (e.g. Southwell: "south spring"), water behavior (Averham: "[settlement] at the floods") and wetland areas (various settlements named Ham: "wetland, water-meadow"). Place names also record wetland-loving flora (Kersal: "cress nook"), fauna (Frostenden: "frog valley"), and suggestive geology (Slapton: "slippery place"). Names of riverine settlements relate to river form and topography. For example, names containing Old English hamm: "land hemmed in by water or marsh" (Gelling and Cole 2000) typically refer to locations in lower reaches within areas of shallow gradient and dominant river meanders. These sites are still subject to prolonged flooding with much of the floodplain underwater for extended periods (Gelling 1984). In contrast, names containing terms for "river crossings", Old English ford and Old Norse vath, are found where gradients become steeper, resulting in shallower river depth, and are often associated with weirs.
Landscape terms within place names were used with a high degree of specificity. Some speak directly of flooding. Old English wæsse, "land which floods and drains quickly" (Gelling and Cole 2000), is attached to key locations in the West Midlands where there is a distinctive change in floodplain morphology. It is found in Buildwas, where the Severn enters the Ironbridge Gorge, in Broadwas, at a distinctive widening on the Teme, and in Rotherwas on the Wye, as it meets the Lugg. Such names comment on historical riverine behaviors, and, when assessed with geoarchaeological evidence, the responses of inhabitants to those behaviors.
Place names and sedimentological analysis
Those who coined place names 1000 years ago knew that wæsse-sites flooded. Flooding remains a frequent occurrence in these locations. But what was the specific character of flooding in these places that merited the use of a special term, seemingly inappropriate for floodable areas elsewhere? Sedimentological analysis has revealed the fluvial characteristics of the rivers – the Severn, the Teme, and the Wye – at these locations from the Iron Age to the present day (Fig. 1). Consequently, it is possible to set this early medieval flood term against the contemporary physical record for flooding (Pears et al. 2020a).
 |
|
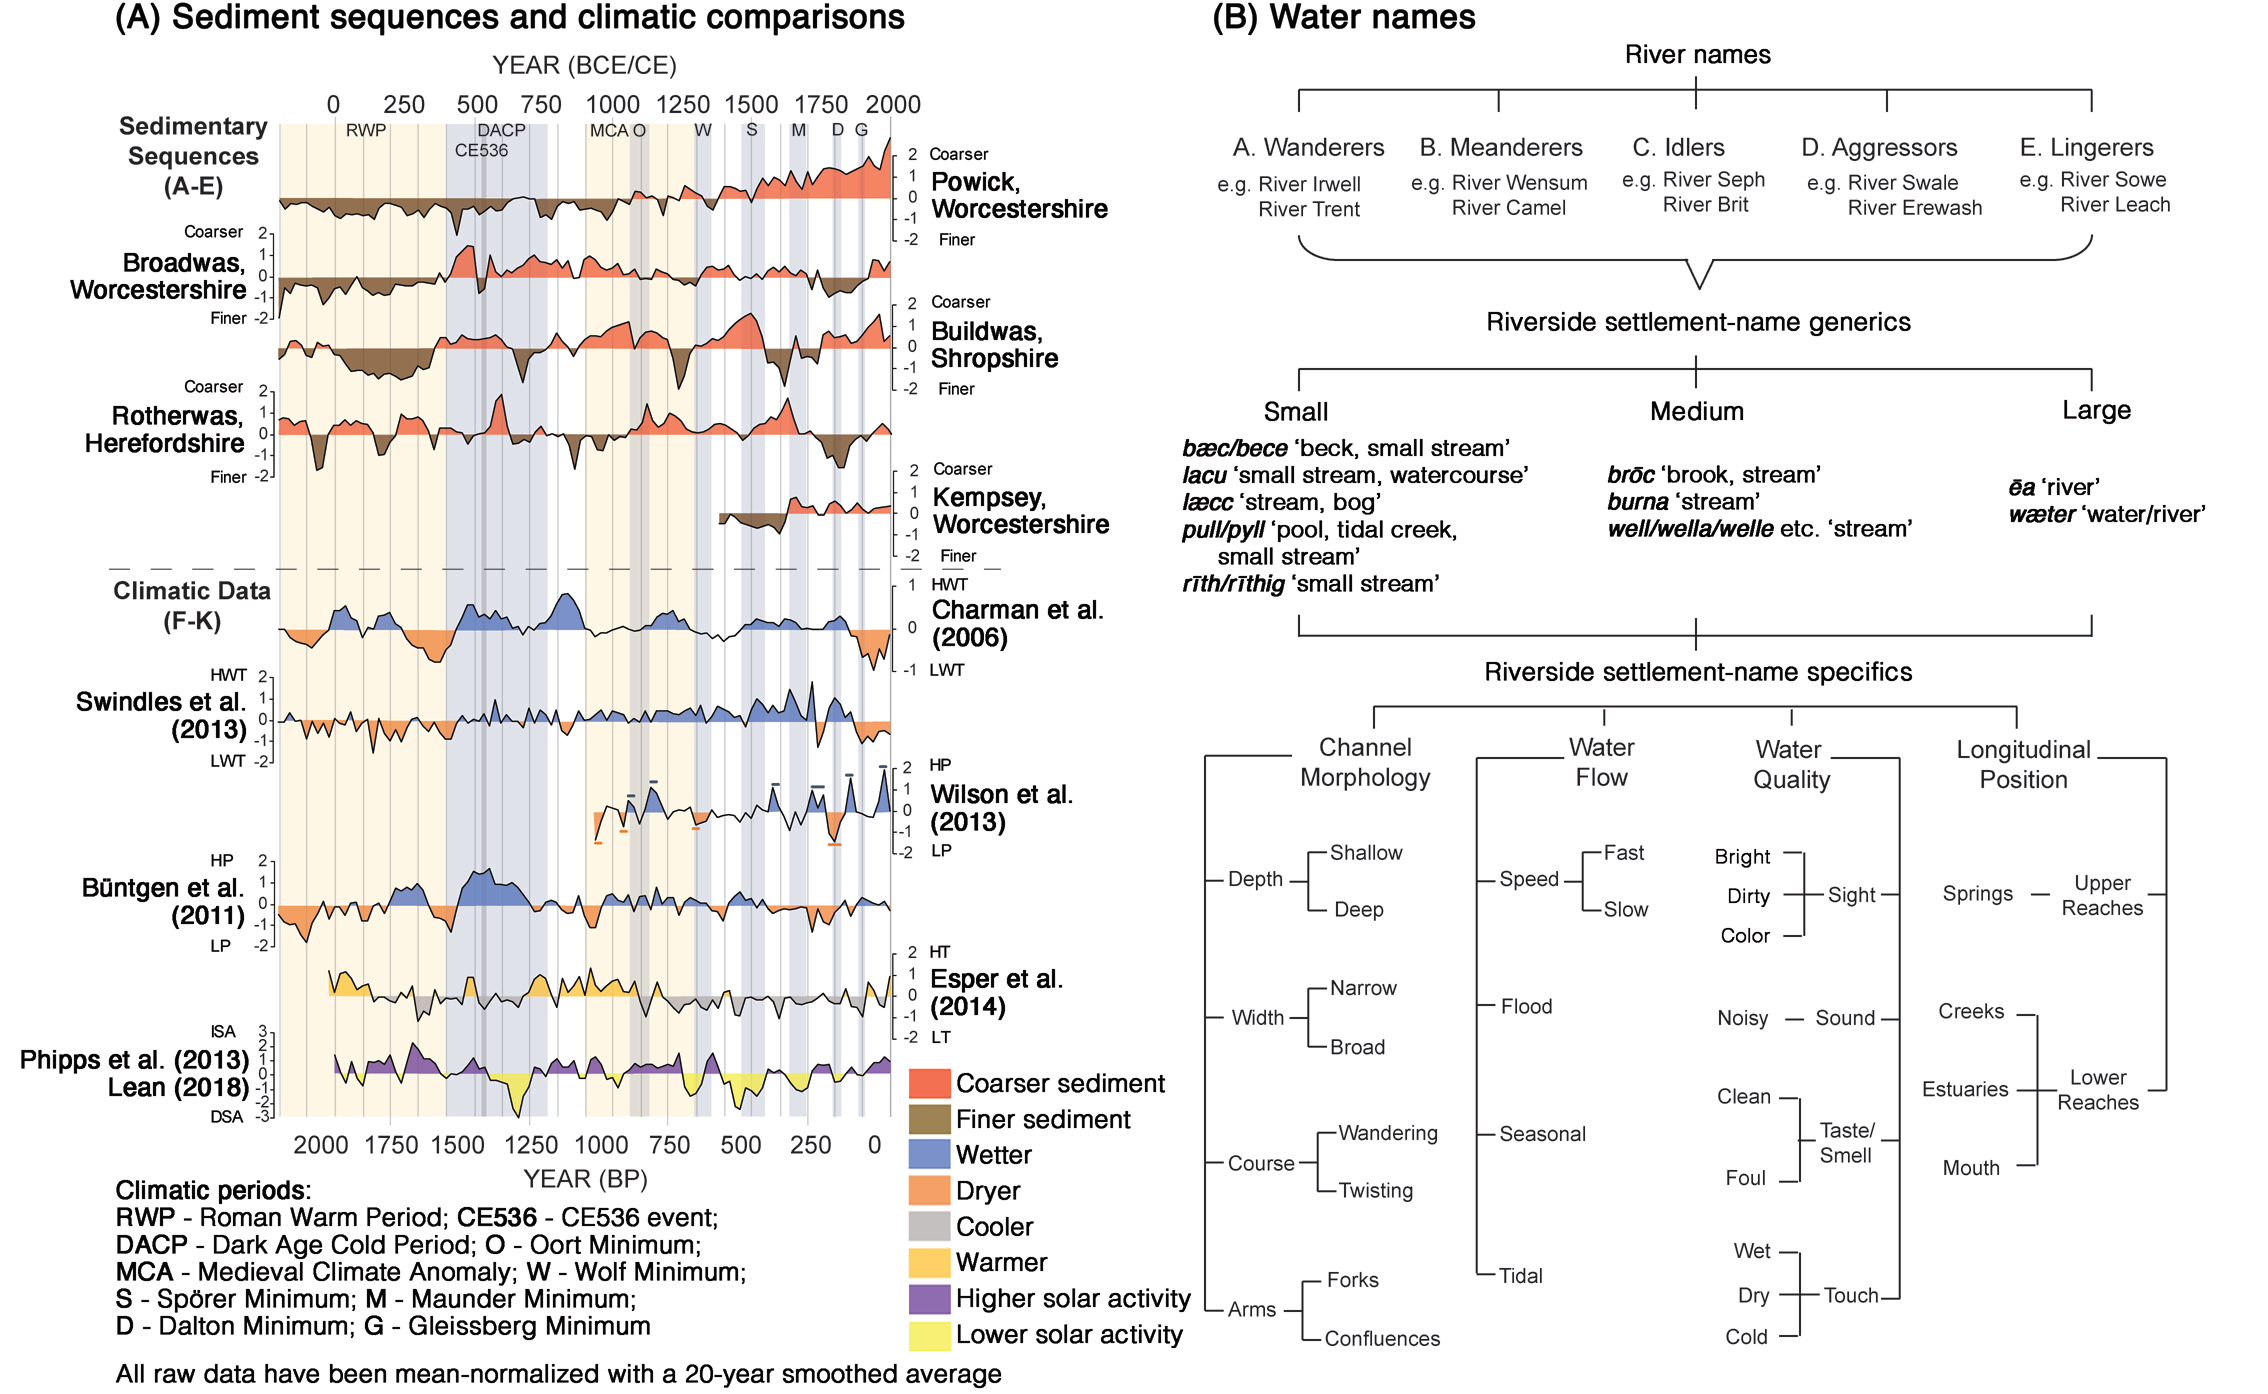
Figure 2: (A) Comparison of Severn-catchment decadal sediment deposition models modeled against upland peatland watertable depth and proxy wetter/drier conditions in the UK and Ireland; precipitation in Southern and Central England and Central Europe; Northern European temperatures and solar activity (Pears et al. 2020b). (B) Hydrological information relating to flowing water retained within river and place names (adapted from Jones 2016). |
Coarse alluvial sediments at Broadwas and Buildwas indicate that high-energy river deposition conditions characterized, albeit with some chronological variation, the period from the 5th to the 13th centuries CE. A more mixed picture emerges at Rotherwas where the Wye appears to have been particularly energetic during the 6th and 7th centuries CE and again from the 14th century (Pears et al. 2020a). Noteworthy in all three cases is that the onset and conclusion of individual flood events appears to have occurred rapidly, even if floodwaters inundated the entire floodplain. It would appear that it was the fast rising and quick draining in these locations that place-namers sought to convey in the term wæsse.
In combination, place names and sedimentological analysis therefore permit the reconstruction of a longer and more-precise chronology of floods, and help to assess their nature and magnitude. River behaviors can thus be correlated with potential climatic drivers, particularly the influence of solar irradiance (Phipps et al. 2013; Lean 2018), but also fluctuations in temperature (Büntgen et al. 2011; Esper et al. 2014), precipitation (Charman et al. 2006; Swindles et al. 2013; Wilson et al. 2013), and storminess – especially during the Dark Age Cold Period (400–750 CE), and Medieval Climate Anomaly (900–1300 CE) – as well as anthropogenic factors such as woodland clearance and arable expansion (Fig. 2a).
Future perspectives
Our work helps to determine non-stationarity in flood series and better integrate natural and societal evidence to understand depositional regime change over time. This potentially enables us to recalculate, or better define, major flood return intervals under certain climatic conditions. These may be significantly lower than previously estimated, with obvious future design and flood management implications. Despite their age, warnings of flood-prone locations and other indications of riverine activity communicated through historic place names can also be shown to be relevant today. These insights from the past can help us better prepare for the future.
affiliations
1The University Museum Tromsø, Arctic University of Norway, Norway
2School of Geography and Environmental Science, University of Southampton, UK
3Luminescence Dating Laboratory, School of Natural and Social Sciences, University of Gloucestershire, Cheltenham, UK
4Institute for Name-Studies, University of Nottingham, UK
5Centre for English Local History, University of Leicester, UK
contact
Tony Brown: antony.g.brownuit.no
references
Brown AG et al. (2013) Anthropocene 1: 3-13
Büntgen U et al. (2011) Science 331: 578-582
Charman DJ et al. (2006) Quat Sci Rev 25: 336-350
Esper J et al. (2014) J Quat Sci 29: 487-494
Gelling M (1984) Place Names in the Landscape. Dent, 326 pp
Gelling M, Cole A (2000) The Landscape of Place-Names. Shaun Tyas, 416 pp
Jones RLC (2016) J Ecol Anth 18: 1-25
Jones R et al. (2017) Eur J Post-Clas Arch 7: 33-64
Lean JL (2018) Earth Space Sci 5: 133-149
Lewin J (2013) Earth Surf Proc Land 38: 17-29
Macdonald N, Sangster H (2017) Hydrol Earth Syst Sci 21: 1631-1650
Macklin MG et al. (2014) Anthropocene 6: 26-38
Pears B et al. (2020a) Eur J Archaeol 23: 381-405
Pears B et al. (2020b) Geology 48: 819-825
Phipps SJ et al. (2013) J Clim 26: 6915-6936
Sam White1 and Qing Pei2
In this article, we identify conceptual barriers, particularly regarding causation, that divide quantitative and qualitative research relating past climate and extreme events to historical societal impacts and adaptions, and we propose solutions for better integrated research.
Discussions of societal impacts of climate and extreme events, including conflict and migration, draw on history for comparisons and insights (e.g. Adger et al. 2014). However, relevant historical research has been divided between divergent quantitative and qualitative methods and perspectives, particularly regarding causation.
Quantitative vs. qualitative perspectives
The quantitative studies in this field have come primarily from social scientists working with historical and climate datasets. Employing mainly regression methods such as Granger causality, authors have identified strong statistical associations between climate and weather phenomena and potential societal consequences over past centuries, including conflict and migration (e.g. Pei et al. 2018). Associations are typically made at multidecadal timescales over large regions, but can be at smaller scales if data coverage is adequate. These studies use five principal criteria for causation: (1) historical rationale for the statistical association; (2) strong relationship between the variables; (3) consistency in the relation between the causal variable and effect; (4) timing: the cause must precede the effect; and (5) strong predictive power of the causal variable (Zhang et al. 2011).
Qualitative studies have come primarily from historians, some in the form of monographs (e.g. White 2011), and others as multi-authored articles (e.g. Camenisch et al. 2016). The latter often involve natural scientists but less often social scientists carrying out the quantitative work described above. Most qualitative studies have focused on impacts and adaptation in individual countries and/or periods, drawing on historical and archaeological records in combination with paleoclimate and historical climatology information. Causation is primarily inferred from contemporary attribution, reasoning from actors' motives, identification of underlying causal mechanisms, and historical comparisons (i.e. methods of similarity and difference).
These contrasting approaches have produced mutual criticisms. Reviews by mainly qualitative scholars have faulted quantitative studies for uncritical use of data with uneven temporal and spatial coverage; arbitrary scales of analysis; little consideration of historical and cultural context; and deterministic causal analysis lacking adequate theory (e.g. Degroot 2018; van Bavel et al. 2019). Quantitative scholars have maintained that climate, in conjunction with subsistence pressures, operated as a root cause of impacts at a macro level, leaving room for contingency and agency and for variable triggers and outcomes in individual episodes; therefore, macro quantitative studies reveal valid underlying causal forces absent in micro or qualitative research (Lee 2020).
These criticisms appear representative of issues arising when the "two cultures" of qualitative and quantitative scholarship approach the same topic from different perspectives. Rather than providing conflicting answers to the same questions, they may answer distinct questions using different concepts. By applying up-to-date methodology and philosophy, scholars can find common ground for collaboration (Goertz and Mahoney 2012).
Key insights for integrated research
A first key insight is the pragmatic and contrastive nature of most causal explanation. Contemporary philosophical studies recognize science and humanities explanations as answers to implicit or explicit "why" questions with contrast sets (van Fraassen 1980). These contrasts are typically between units, conditions, or times. Thus, an explanation for the French Revolution of 1789 may take the form of causes for a Revolution in France (rather than another political unit) in 1789, a French Revolution (rather than peaceful condition) in 1789, or a French Revolution in 1789 (rather than another time). The context determines the salient contrast, and confusion about the causal question may render an explanation unhelpful or misleading even if factually correct (Ylikoski 2007).
In the case of historical climate attribution, quantitative studies may claim "climate caused conflict", while qualitative studies may examine the same phenomenon and conclude "climate did not cause conflict", and both may be correct within their respective contrast set. For instance, a quantitative study may explain the higher frequency of conflict during one period rather than another across many units, but it may not explain the presence of conflict in certain units rather than others at the same time. By specifying the contrast set in their explanations, both qualitative and quantitative studies can formulate more targeted and defensible claims. Statistical correlation between timing of a climate variable and migration volumes may be formulated as "temporal variations in climate caused temporal variations in migration" rather than "climate caused migration"; moreover, "climate caused conflict" in the quantitative studies should be interpreted as "worse climate caused more conflicts", which correctly matches the explanation in the statistical perspective.
Second, scholars in the field use two distinct approaches to causation: effect-of-cause analysis typical of macro quantitative studies and cause-of-effect analysis usually found in micro qualitative studies and historical monographs. Effect-of-cause analysis identifies statistical relationships between two variables in order to attribute control of one over the other. In historical climate attribution, studies may use regression or potential outcomes analysis to relate a climate or weather variable to the past frequency or magnitude of a quantifiable societal impact, and then interpret this relation in causal terms. Cause-of-effect analysis, on the other hand, identifies logical relationships of necessity and sufficiency — that is, whether some event or condition had to occur for, or was enough to bring about, a particular outcome (Goertz and Mahoney 2012). For historical climate attribution, this approach usually requires inferences derived from historical evidence, comparisons with like cases, and counterfactual reasoning about outcomes if climate had been different.
When quantitative studies identify control of a climate variable over a societal impact, the finding does not imply that climatic factors were necessary or sufficient for each instance of that impact. For example, a study may identify a large-scale statistical relationship between lower temperatures and the frequency of conflict and give this relationship a causal interpretation without implying that climatic change was the cause of any one particular conflict. The process tracing that may accompany such studies is illustrative rather than a complete or deterministic picture of causation in each instance (e.g. Zhang et al. 2011). Conversely, when qualitative studies identify a climatic factor as necessary or sufficient for a historical case of a societal impact, the finding does not imply that the climate variable regularly influenced that type of societal impact. For instance, a study may find that a particular drought was or was not the cause of a single historical migration without concluding that drought frequency or severity influenced migration volumes at larger scales. Thus, these two types of causal analysis are complementary rather than contradictory. When drawing lessons from history, effect-of-cause studies indicate typical past relationships between climate variables and impacts, whereas cause-of-effect studies may indicate causal mechanisms underlying those relationships and the necessary and sufficient conditions for those relationships to persist in the present or return in the future.
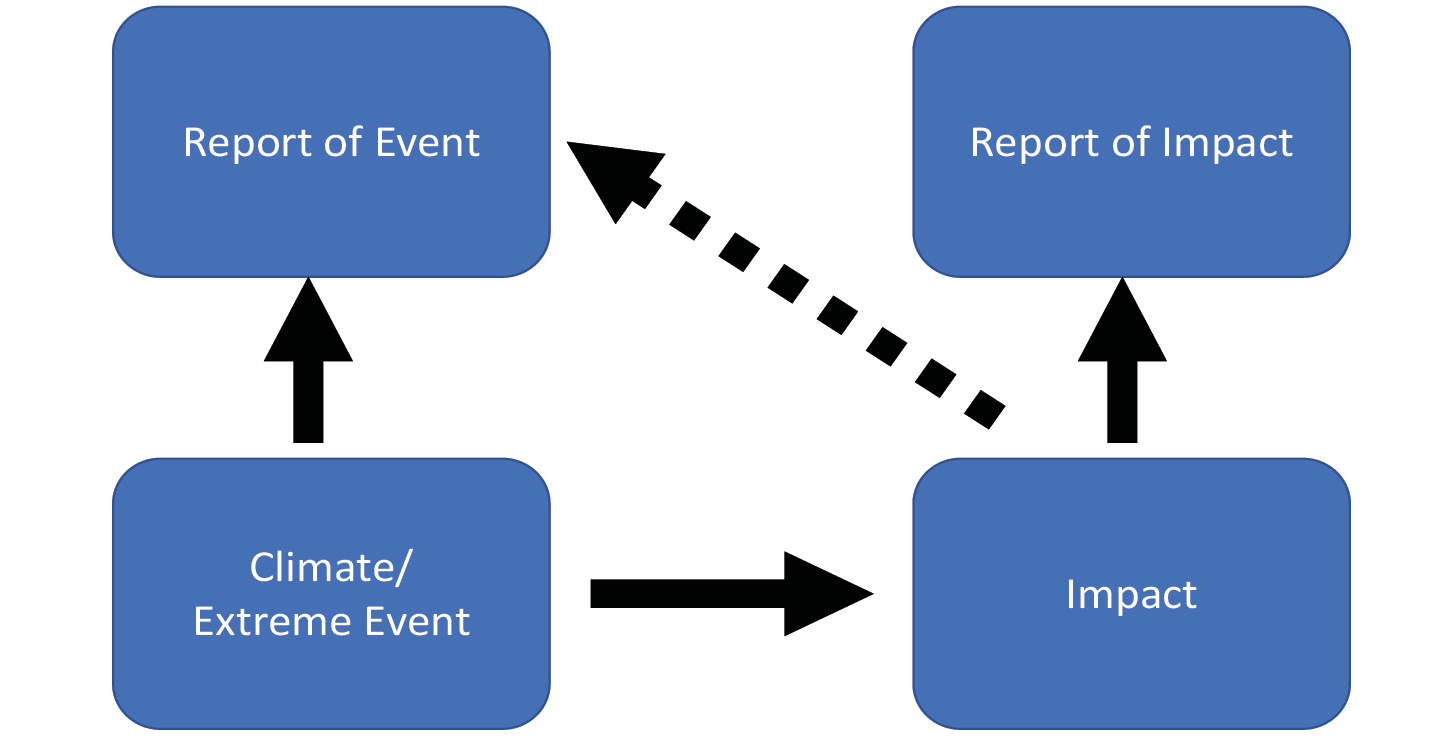
 |
|
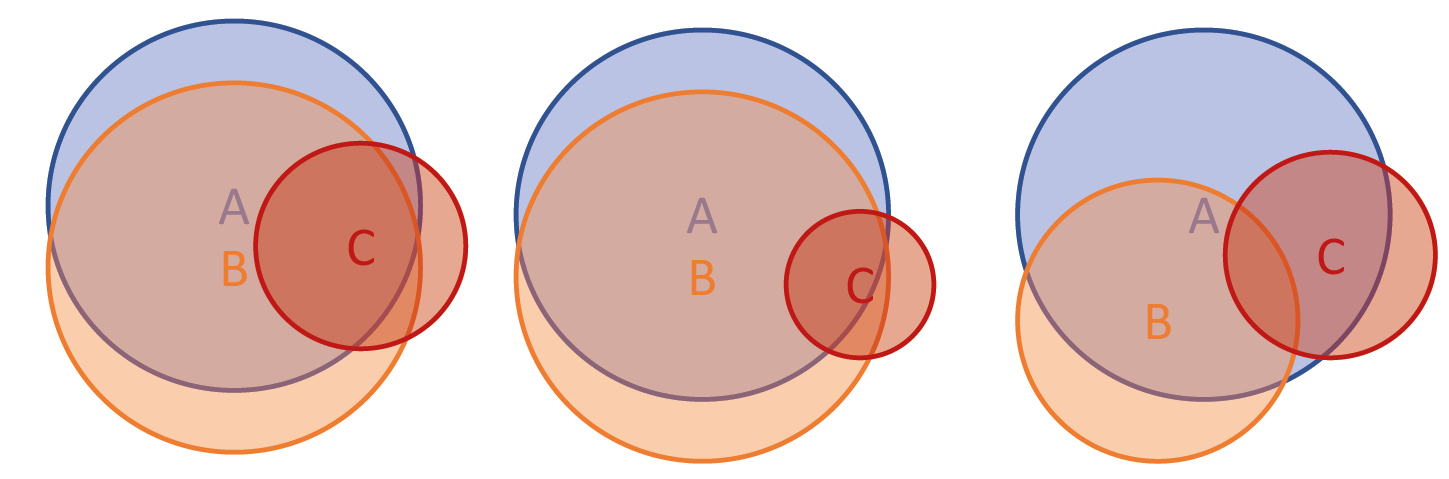
Figure 1: Schema representing frequency and co-occurrence of three INUS for historical famine, where A is vulnerable agriculture, B is inequality, and C extreme weather, and the overlap of all three indicates occurrence of famine. In typical pre-modern conditions (left), occurrence of C overlaps most with the outcome and may therefore be considered "the cause" of famines. Nevertheless, decreasing (increasing) the frequency of any INUS will decrease (increase) the frequency of the outcome (see middle and right). Thus studies concerned with climate impacts may focus on C as the causal variable, while studies concerned with economic policy may focus instead on B. |
A third key insight is that historical outcomes depend on the co-occurrence of insufficient but necessary components of unnecessary but sufficient sets of conditions, or INUS (Mackie 1965). For instance, extreme weather, vulnerable agriculture, and social inequalities did not each cause famines alone, but combined (along with other background conditions) to produce famines on particular occasions. This raises a classic philosophical dilemma: which of these factors should be analyzed as "the cause" of those famines (Hart and Honoré 1985, pp. 36-37)? An intuitive approach is to identify the INUS condition most nearly necessary and sufficient for the outcome, as indicated by greatest predictive power over the outcome or occurrence that most nearly overlaps with the outcome (Mahoney et al. 2009). In the case of historical famines described above, the INUS selected as "the cause" will often be extreme weather, because its occurrence predicted the timing of famines better than vulnerable agriculture or inequalities, which were more constant. However, causal selection has unavoidable normative implications (Garfinkel 1981), and studies may emphasize the causation of other INUS conditions due to their policy or ethical relevance (Fig. 1). Historical climate attribution studies may address criticisms of insensitivity to policy or ethical issues by explicitly justifying analysis of climate as "the cause" and specifying the role of other INUS conditions.
 |
|
Figure 2: Example of biased reporting. In certain historical circumstances, extreme events were more likely to be reported when they produced impacts (dashed arrow) than when they did not, generating a positive bias in statistical associations. |
These insights clarify when limited datasets are problematic for quantitative impact studies. Contrast set, scale, type of causation, and standard for causal selection determine whether gaps and inconsistencies invalidate causal inferences. In effect-of-cause analyses focused on temporal variations of impacts at large scales, statistically valid results may depend more on wide spatial and temporal coverage than on consistency within that coverage; or else studies may compensate for data inconsistencies by using statistical methods or by expanding the study area and duration. Nevertheless, it remains important that the scale of analysis be grounded first in theory and that the data are suitable for the chosen scale. Systematic biases in evidence can also invalidate causal inferences. In particular, studies based on statistical associations must establish that reporting of climate or weather events and their supposed impacts were truly independent of one another, a determination requiring knowledge of the underlying historical reporting and record-keeping processes (Fig. 2).
These considerations indicate possibilities to overcome conceptual barriers between quantitative and qualitative historical attribution research. Each approach has limitations, which may be partially compensated by better communication across studies and collaboration within studies. Publications could minimize confusion by specifying cause and effect contrast sets, distinct effect-of-cause and cause-of-effect inferences, justification for (not) analyzing climate or extreme events as the key causal variable, and grounds for the scale of analysis. Collaboration may capitalize on the division of labor between qualitative methods of inference from and about historical evidence and quantitative methods of modeling and statistical induction, as well as the complementary functions of effect-of-cause and cause-of-effect analysis, in order to achieve integrated evaluation of historical climate attribution suited to informing policy.
affiliations
1Department of History, Ohio State University, Columbus, USA
2Department of Social Sciences, Education University of Hong Kong, Hong Kong
contact
Sam White: white.2426osu.edu
references
Camenisch C et al. (2016) Clim Past 12: 2107-2126
Garfinkel A (1981) Forms of Explanation: Structures of Inquiry in Social Science. Yale University Press, 186 pp
Goertz G, Mahoney J (2012) A Tale of Two Cultures: Qualitative and Quantitative Research in the Social Sciences. Princeton University Press, 248 pp
Hart H, Honoré T (1985) Causation in the Law, 2nd ed. Clarendon Press, 544 pp
Lee H (2020) Asian Geographer, doi:10.1080/10225706.2020.1768571
Mackie J (1965) American Philosophical Quarterly 2: 245-264
Mahoney J et al. (2009) Comparative Political Studies 42: 114-146
Pei Q et al. (2018) Holocene 28: 208-216
van Bavel B et al. (2019) WIREs Climate Change 10: e611
van Fraassen B (1980) The Scientific Image. Oxford University Press, 248 pp
Ylikoski P (2007) In: Persson J, Ylikoski P (Eds) Rethinking Explanation. Springer, 27-42
Zhang D et al. (2011) Proc Acad Natl Sci USA 108: 17296-17301
David J. Nash![]() 1,2 and Matthew J. Hannaford3
1,2 and Matthew J. Hannaford3
Collections of written materials from the 16th century onwards have been used to explore the historical climatology of Africa. Studies include decadal- to seasonal-scale reconstructions of past rainfall and temperature, and analyses of societal responses to historical extreme events.
Rainfall reconstructions (1500–1800)
Relative to the wealth of documentary evidence available for Eurasia, there are comparatively few collections of written materials through which to explore the historical climatology of Africa. Documents containing "climate knowledge" for periods prior to the 19th century focus on the Sahel, coastal West Africa, and pockets of southern Africa. Except for small numbers of diaries and naval accounts, few sources contain systematic weather records. Instead, entries comprise references to extreme events and generic descriptions of climates and landscapes. Information about extreme events is of most use for climate reconstruction, which is limited during these centuries to the identification of seasonal or decadal wetness and climate-related events such as locust outbreaks.
Nicholson (1978) produced centennial-scale timeseries of drought and famine for the Sahel using chronicles from Timbuktu, Bornu, Walat, and Tichitt. These chronologies identify climatic "periods" and suggest that wetter conditions interspersed by droughts prevailed from the 16th through 18th centuries, before a trend towards drier conditions began in the late 18th century. Adopting a similar approach, Norrgård (2015) produced an interdecadal-scale wetness series for coastal West Africa (from Ghana to Benin) during the late 18th century. Like the Sahel chronologies, this reconstruction suggests abrupt changes in rainfall during the 1780s (wetter) and 1790s (drier). Miller (1982) used Portuguese colonial records to produce a chronology of wetness, locusts, and epidemics for modern-day Angola from 1560 to 1830. Intense droughts were found to be present during the 1580s, 1650s, and 1790s. However, caution must be applied to parts of this chronology, since references to warfare are sometimes included as indirect evidence for drought (due to the frequent coincidence of drought and conflict). Less material exists for Mozambique than Angola, but documents are available for most decades following Portuguese settlement in 1505. A chronology of extreme events shows pronounced droughts during the late 16th century, few droughts in the 17th century, and particularly severe droughts in the 1790s and 1820s (Hannaford 2018).
 |
|
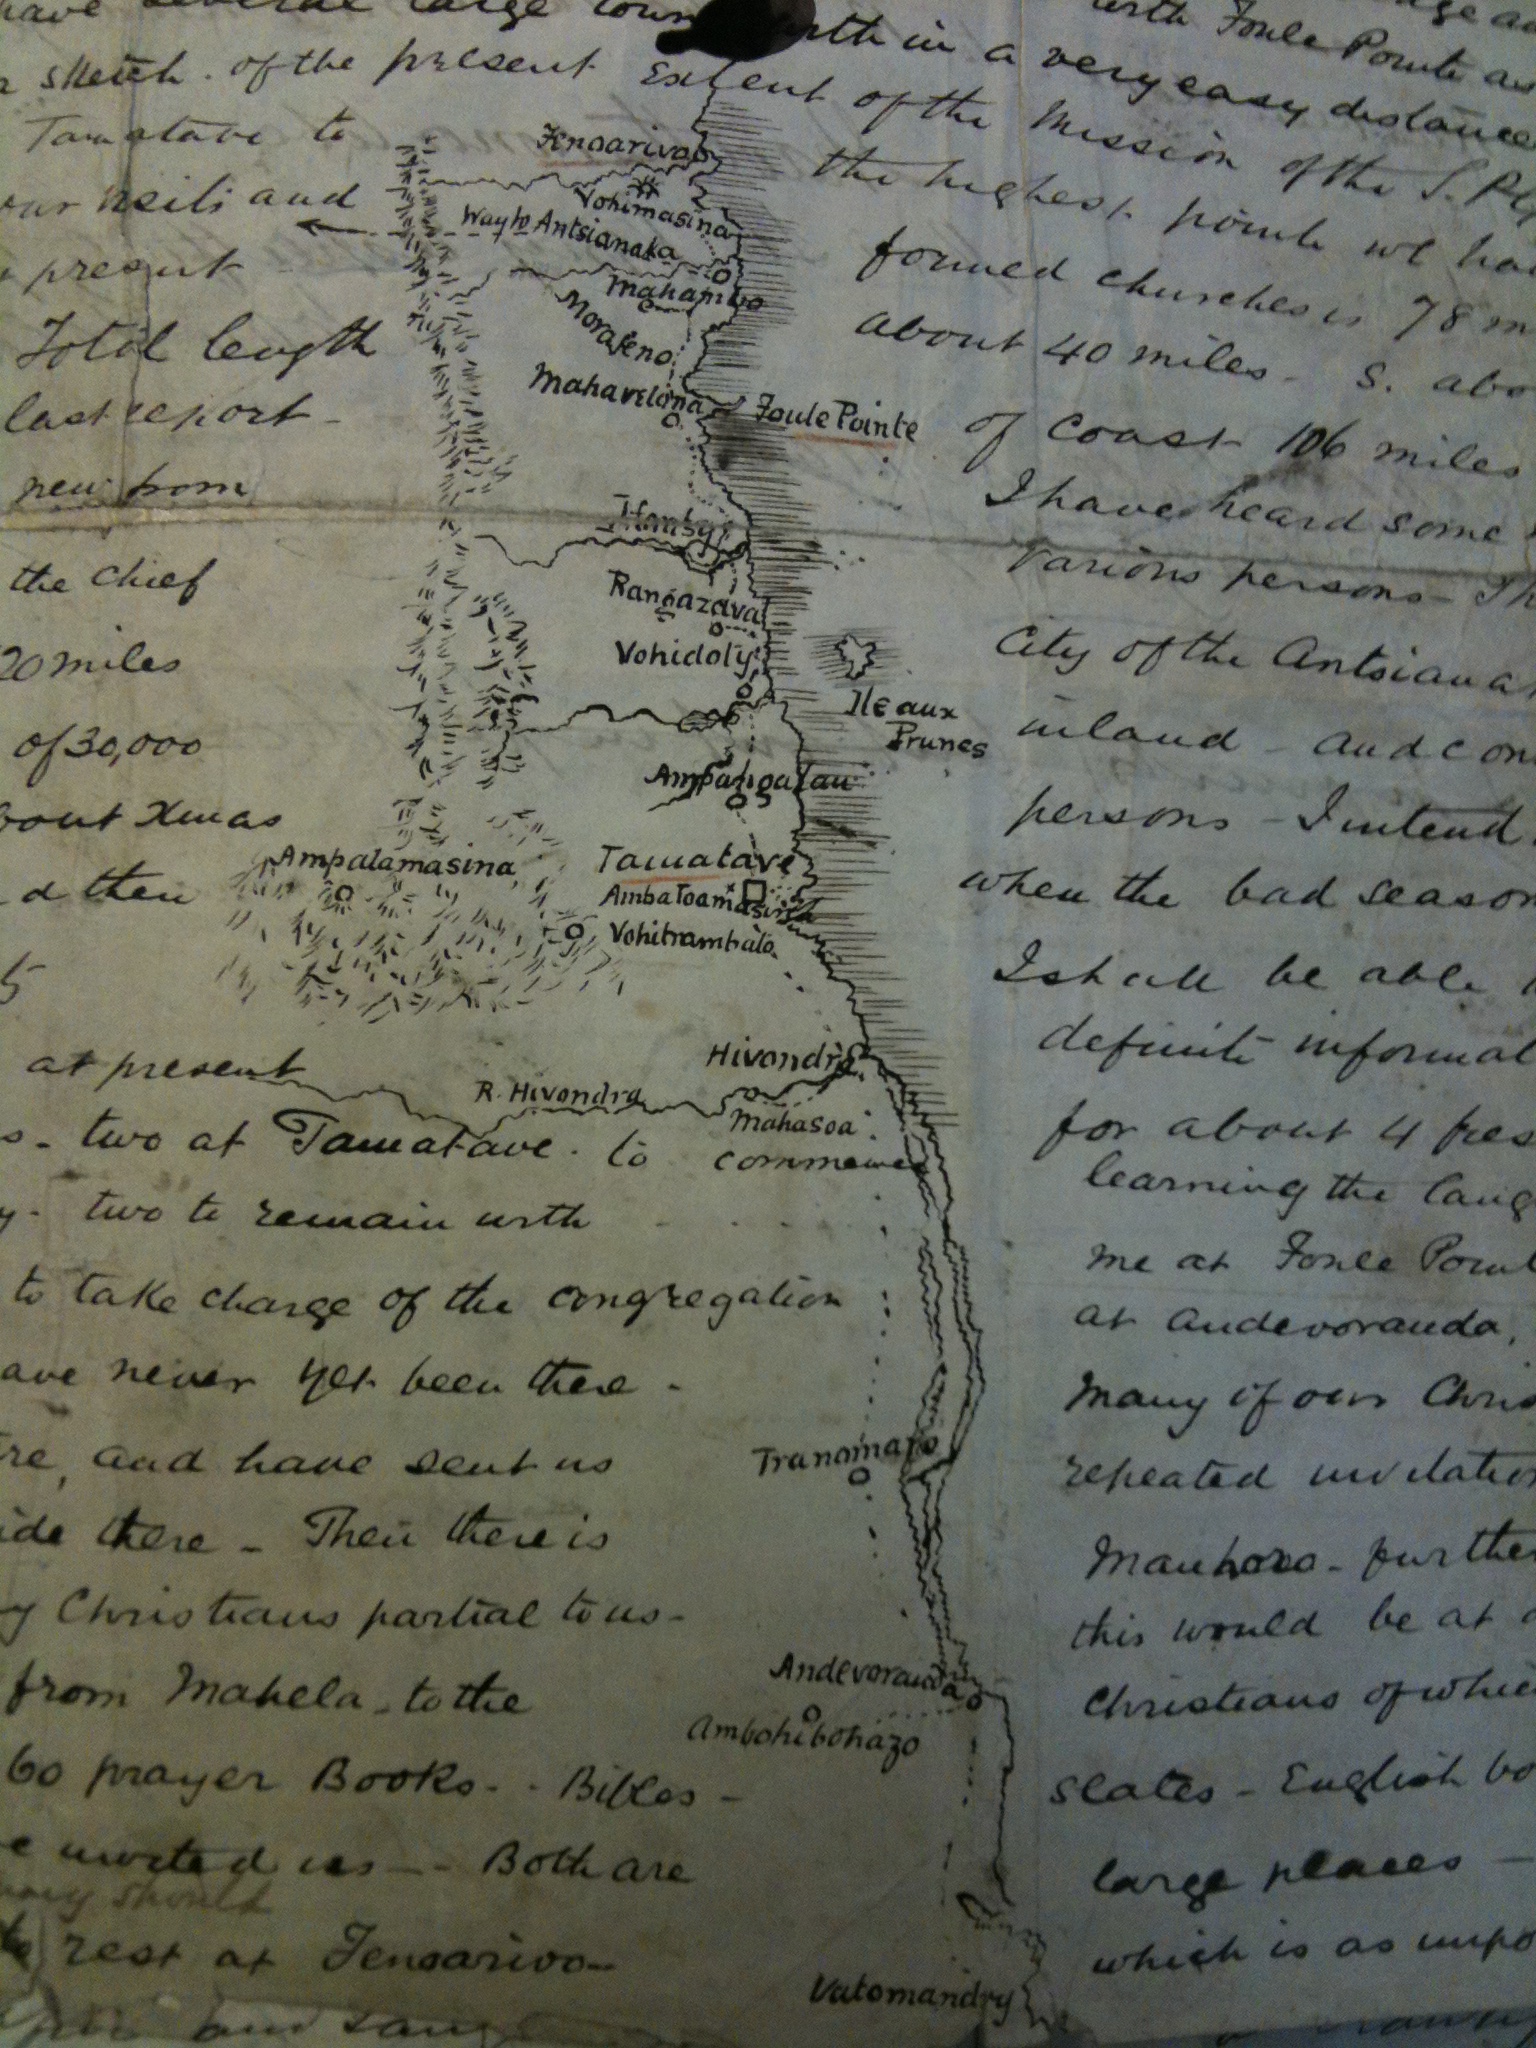
Figure 1: Excerpt of a letter dated 17 February 1868, written by the missionary Rev. A. Chiswell at present-day Toamasina, showing contemporary settlements along the east coast of Madagascar. (Source: Oxford, Bodleian Libraries, United Society for the Propagation of the Gospel Papers D38.) |
Climate reconstructions (1800–1900)
The quantity of sources available for climate reconstruction in Africa during the 19th century is much greater than for earlier periods. This is mainly attributable to the expansion of European colonial activity across the continent from the late 18th century onwards. Records include colonial and missionary papers, newspapers, travelogs, personal diaries, and letter collections. Most climate information in these sources is in the form of narrative descriptions but, beginning in the 1850s, selected newspapers also included instrumental meteorological data.
Information from these materials has been used to generate continent-wide and regional rainfall reconstructions based on classifications of "wetness". The main continental series (Nicholson et al. 2012) combines documentary evidence, rain-gauge data, and secondary literature – mostly relating to sites within 500 km of the coast – to explore spatio-temporal variations in historical rainfall. The most striking feature of the reconstruction is the tendency for increased aridity in the opening decades of the 19th century. A notable period of above-normal rainfall is identified in the Sahel in the 1880s and early 1890s, but drier conditions commenced elsewhere around 1880.
The greatest numbers of regional rainfall reconstructions are available for southern Africa. Some, such as Hannaford et al. (2015), use wind data digitized from ships' logbooks to capture regional atmospheric circulation and produce quantitative chronologies. Others rely mainly on narrative evidence within historical sources (Fig. 1). These include chronologies for the Kalahari, Lesotho, South Africa (including the Western and Eastern Cape, Namaqualand and KwaZulu-Natal; see Nash 2017 for sources), Malawi (Nash et al. 2018), and Namibia (Grab and Zumthurm 2018). Most studies reconstruct annual rainfall only, but where information density permits, seasonal reconstructions have been attempted. Recent work on the historical climatology of the Cape has produced a daily surface-pressure series from 1834 onwards from early instrumental records (Picas et al. 2019).
A compilation of annually resolved rainfall series for mainland southern Africa for the period 1850–1900 is shown in Figure 2. This includes seven series based on documentary evidence, three regional series from Nicholson et al. (2012) and, for comparison, a tree-ring-width-based rainfall reconstruction for western Zimbabwe (Therrell et al. 2006). All are for areas that receive most rainfall during the austral summer months (October–March). The compilation shows that relative rainfall levels were geographically variable across southern Africa. However, droughts that affected large areas can be identified (e.g. ~1850, early to mid-1860s, late 1870s, early to mid-1880s and mid- to late 1890s), in addition to a smaller number of coherent wetter years (e.g. 1863–1864 and 1890–1891). Multiproxy analyses indicate that the early to mid-1860s' drought was the most severe of the 19th century, and that of the mid- to late 1890s the most protracted (see Nash 2017).
To date, the only study exploring historical temperature variations is a chronology of cold season variability for Lesotho (Grab and Nash 2010). This reveals more severe and snow-rich cold seasons during the early to mid-19th century (1833–1854) compared with the latter half of the 19th century. A reduction in the duration of the frost season by over 20 days during the 19th century is also identified.
 |
|
Figure 2: Annually-resolved rainfall reconstructions for southern Africa during the period 1850-1900. (A) Therrell et al. (2006); (B-D) Nicholson et al. (2012); (E) Nash et al. (2018); (f) Grab and Zumthurm (2018); (G) Kelso and Vogel (2007); (H) Nash and Endfield (2008); (I) Nash and Grab (2010); (J) Nash et al. (2016); (K) Vogel (1989). |
Climate impacts and perceptions
The climate reconstructions described above provide important baselines from which to consider climate impacts, exploration of which has largely taken place within the disciplines of economic and social history. Perhaps the best documented impact of climate on society is on agricultural production. Historical studies of drought-related famine and its societal effects are reasonably widespread, with most research focusing on the 19th century and some longer-term studies back to the 16th century. Increasing use has been made of vulnerability frameworks, which consider a multitude of socio-environmental factors (including the characteristics of agro-ecosystems, diversity of human livelihoods, and level of societal organization) that shape the consequences of climatic impacts. Such approaches have demonstrated that while "material" factors such as crop diversity were important in reducing sensitivity to drought in the lower Zambezi area of southeast Africa, institutional rigidity or adaptability were the principal determinants of societal vulnerability in the long run (Hannaford 2018). The introduction of American crops, especially drought-intolerant maize, is also thought to have impacted upon food security, with implications for population growth, drought exposure, and famine vulnerability.
In relation to conflict, the period of state formation in eastern South Africa during the 18th and 19th centuries has been linked to drought-intensified competition over cattle and grazing land, in turn generating conflict and the organization of societies into defensive states (Hannaford and Nash 2016). Africa has largely been absent in pre-20th-century quantitative studies on climate and conflict, but quantitative approaches have argued that increases in slave exports during the 19th century were a result of increased temperatures in slave-exporting areas of Africa that reduced agricultural productivity (Fenske and Kala 2015).
The influences of climate on health and disease have been explored through the lens of European perceptions of African climates, who saw them as unhealthy and disease ridden, with most of the literature focused on the late 18th and 19th centuries. Some literature has explored linkages between climate and epidemics (e.g. Eldredge 1987), usually situating drought as a driver of malnutrition or contaminated water supplies, which in turn increased susceptibility to infectious diseases.
Future work
Despite the advances in African historical climatology reported here, there is still scope for future climate reconstruction work. Nicholson et al. (2012), for example, identified major spatial gaps for equatorial and arid regions of Africa. Finding documentary evidence to address these gaps may be challenging, although large collections of available primary materials may help for western and eastern Africa. By exploring links to cognate subdisciplines such as historical archaeology, future research may better contextualize climate impact analyses. Finally, there is considerable potential for using documentary sources in different regions to explore spatial variations in the signatures of global phenomena, such as El Niño, or for specific time periods such as the end of the Little Ice Age.
affiliations
1School of Environment and Technology, University of Brighton, UK
2School of Geography, Archaeology and Environmental Studies, University of the Witwatersrand, South Africa
3School of Geography and Lincoln Centre for Water and Planetary Health, University of Lincoln, UK
contact
David J. Nash: d.j.nashbrighton.ac.uk
references
Eldredge EA (1987) Afr Econ Hist 16: 61-93
Fenske J, Kala N (2015) J Dev Econ 112: 19-32
Grab SW, Nash DJ (2010) Clim Dyn 34: 473-499
Grab SW, Zumthurm T (2018) Int J Climatol 38 (Suppl. 1): e643-e659
Hannaford MJ (2018) Glob Planet Change 166: 94-106
Hannaford MJ, Nash DJ (2016) Wiley Interdiscip Rev Clim Change 7: 370-392
Hannaford MJ et al. (2015) Holocene 25: 379-390
Kelso C, Vogel CH (2007) Clim Change 83: 257-380
Miller JC (1982) J Afr Hist 23: 17-61
Nash DJ, Endfield GH (2008) Clim Change 86: 257-290
Nash DJ, Grab SW (2010) Clim Change 101: 617-653
Nash DJ et al. (2016) Clim Change 134: 605-619
Nash DJ et al. (2018) Int J Climatol 38 (Suppl. 1): e649-e642
Nicholson SE (1978) J Arid Environ 1: 3-24
Nicholson SE et al. (2012) Quat Res 78: 13-23
Norrgård S (2015) Clim Change 129: 131-143
Picas J et al. (2019) Int J Climatol 39: 1404-1414
Fiona Williamson1 and Qing Pei2
Major sources of social archives for paleoclimatology in East and Southeast Asia include ancient annals and chronicles, instrumental records from government, military or missionary bodies, and private records such as diaries. Records are rich but scattered and of inconsistent quality, often requiring different forms of cross-validation and homogenization from those in the Western world.
The source materials and methods that inform investigative studies of past climates can be broadly distinguished into two groups: historical climatology, which relies on the archives of societies, and paleoclimatology, which draws from the archives of nature (Brönnimann et al. 2018). While many studies often utilize evidence of both types, the archives themselves remain distinct. The archives of society are a "unit of information coded by humans which refers to weather and climate, usually from the viewpoint of individuals" (Pfister 2018). As Pfister notes, these records can be broadly categorized into three areas: instrumental weather observations, narrative accounts of weather, and human observations of climate proxies. Studies of these archives have taken several forms, such as the recovery of observational data, the correlation of extreme weather events or longer-term periods of unusual highs or lows with human activities, and reconstructive analysis based on combinations of documentary and paleoproxy data.
Sources
In East Asia, such sources of historical climate information take various forms. South Korea, for instance, has detailed narrative records of unusual or extreme weather contained in the 1st century BCE manuscripts History of the Three Kingdoms and Memorabilia of the Three Kingdoms and, later, the Annals of the Joseon Dynasty (1392–1897) (Chun et al. 2013). In China, too, a wealth of ancient chronicles and literature also survive, documenting both climatic conditions and natural disasters. The classical Twenty-Four Histories (二十四史), for example, provide a major social archive for Chinese scholars (Zhang 2004). Such archives exist because of emperors' interest in the "Mandate of Heaven" (Pei and Forêt 2018), whereby unusually bad weather or strange phenomenon could be considered the result of a ruler's failures.
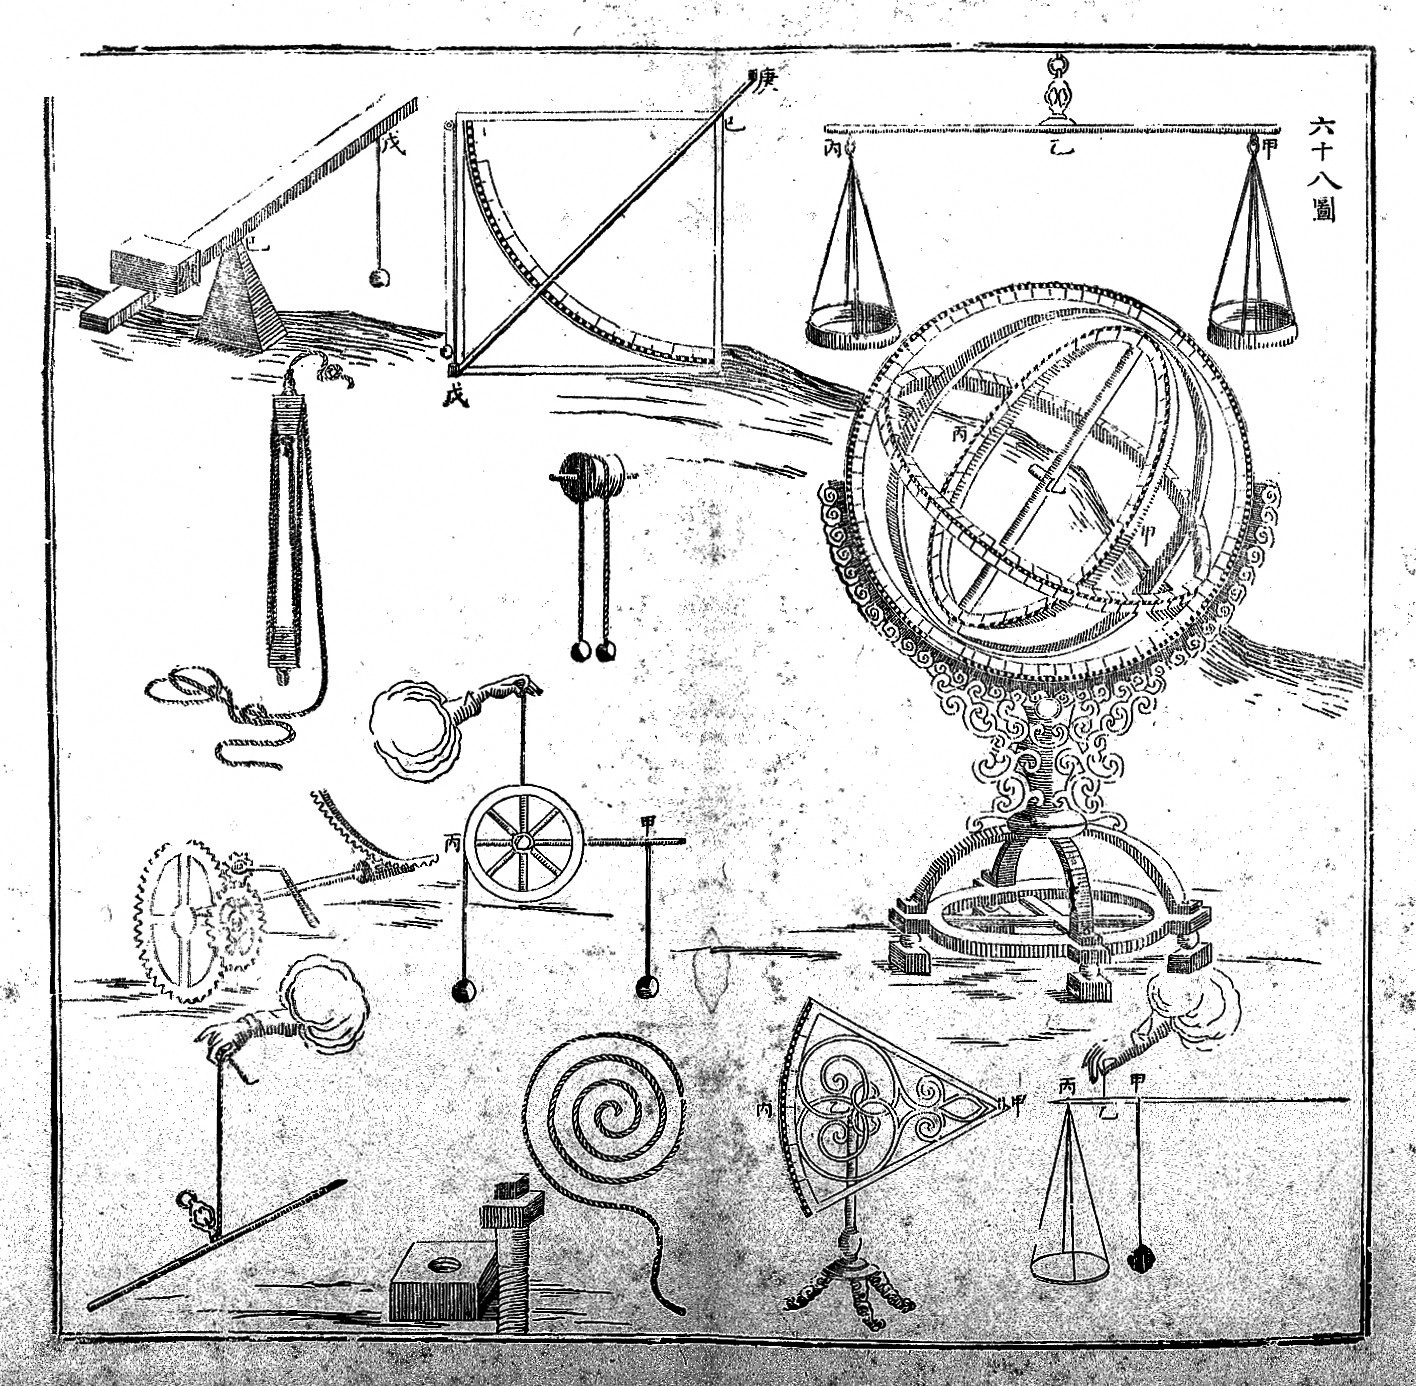 |
|
Figure 1: Illustrations of astronomical instruments, Beijing, China, by the Belgian Jesuit missionary Ferdinand Verbiest (1623–1688). Source: https://wellcomecollection.org/works/ukc9nmta |
Agriculture was critically important to these ancient societies. Thus, provincial and central government records charted severe cold, frost, snow, drought, and flood events that might impact harvests, as well as incidents such as natural disasters, plagues, and famines (Zhang 2004). Due to their proclivity for extreme weather, Japan, China, and Korea were all early developers of rain- and snow-gauge technologies and in observing and keeping records of nature, such as blossoming seasons (Aono and Saito 2010). The Chinese Qing dynasty Yu-Xue-Fen-Cun (雨雪分寸) records of rain and snow (YXFC records) document how deeply rain and snow penetrated the soil (Fig. 1). Phenological records of oriental migratory locust swarms have also been reconstructed as an indicator of climate change (Huang et al. 2019). In the towns and ports of Japan and China, such as Nagasaki, Xiamen, and Beijing, meteorological records were also made by visiting traders, doctors, and missionaries and by military officials stationed at colonial outposts from the early-modern period into the early 19th century (Demarée et al. 2013).
By the late 19th century, abundant records were made across newly formed meteorological networks of registering stations and observatories, for example the China Coast Meteorological Register compiled from observations made by the China Coast Customs Service which had its headquarters in Shanghai (Fig. 2).
These records are available in sources such as government gazettes, official communications, and newspapers. Many of these are now being recovered under the aegis of major data recovery projects (ACRE: Allan et al. 2011; REACHES: Wang et al. 2018). Personal diaries and church records are also being recovered (Mikami 2008).
Southeast Asia is more reliant on the archives of nature than of society for the pre-modern period, but some records exist. Again, these take the form of ancient chronicles that chart periods of severe droughts or floods that disrupted society, such as those available from the 14th century in Burma, Cambodia, and Dai Viet (Buckley et al. 2014). For the rest of Southeast Asia, the colonial period tends to hold the best documentation on past climates, with a wealth of climate data collated by the colonial French, British, Dutch, Spanish, Japanese, and American governments. From early medical topographies that noted aspects of the climate as they related to health, to private diaries and military records, these sources became increasingly sophisticated by the end of the 19th century as meteorological science became more standardized and regulated globally.
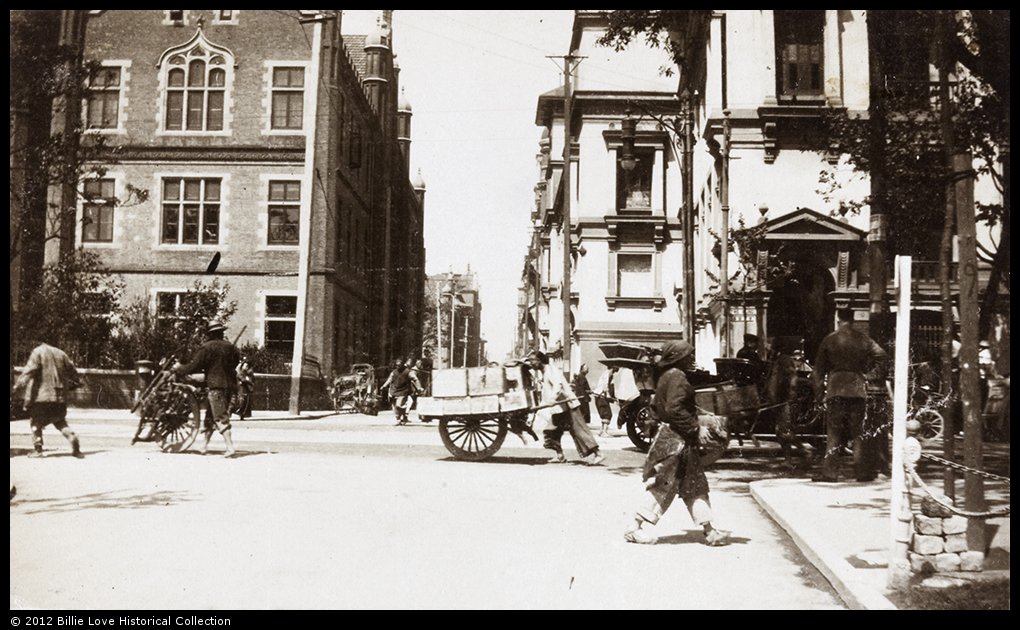 |
|
Figure 2: Custom House and German-Asiatic Bank, Bund, Shanghai, May 1911. Source: https://www.hpcbristol.net/visual/bl02-024 |
Comments
Studies undertaken for East and Southeast Asia have tended to focus on two main areas with the bulk of research undertaken in China and later Japan: first, the correlation of climatic events with changes to human societies, for example through natural disaster or prolonged climatic instability, resulting in famine, death, warfare, or regime changes; and second, the reconstruction of climate dynamics or particular events, such as El Niño or typhoons (Kubota and Chan 2009). Chinese scholars are better known for studies extending over centuries and even millennia, whereas in Japan — although Chinese recording systems had a large influence historically — scholars have had a different focus, exploring more recent climates and explaining past variations from the perspective of explaining teleconnections and climate dynamics.
Of course, there are inherent problems in using these early records. In China, the ancient records usually entailed general patterns of phenomena or events, a recording style that translates as "Generalize Details and Absorb Them". Descriptions were qualitative rather than quantitative, for instance: big (大), medium (中), or small (小). Even the considerably more systematic Qing YXFC records contain inconsistencies, as external influences, such as the abilities of the recorder or administrative differences across regions, all impinge on their accuracy (Pei and Forêt 2018).
Even the supposedly standardized instrumental observations of the later 19th century are not without criticism. In Singapore and Malaysia, even contemporaries critiqued the pre-1920s records, blaming poorly trained staff and a lack of resources.
Cross validation of statistics and data homogenization methods are used to combat these issues (Gao et al. 2018). Current paleoclimate reconstructions based on Chinese records are typically interpreted using a five-point series following the Semantic Differential Method (Zhang 2004). Japanese scholars have used the Standard Normal Homogeneity test, the Buishand Range test, and the Pettitt test (Zaiki et al. 2006). Studies reliant on ancient chronicles may also combine the historical narratives with paleo-proxy data (Buckley et al. 2014).
In spite of inaccuracies, however, reconstructions based on social archives still have the potential to span millennia and allow for amazing insights into past climates. Because studies using archives of societies for this region are significantly different from their European counterparts, the use of such archives are still gaining momentum in research and continuing to enrich the application of social archives in paleoclimatology.
affiliations
1School of Social Sciences, Singapore Management University, Singapore
2Department of Social Sciences, Education University of Hong Kong, Hong Kong
contact
Fiona Clare Williamson: fwilliamsonsmu.edu.sg
references
Allan R et al. (2011) Bull Amer Meteorol Soc 92: 1421-1425
Aono Y, Saito S (2010) Int J Biometeorol 54: 211-219
Buckley B et al. (2014) Quat Sci Rev 95: 1-19
Chun Y et al. (2013) Meteorological, Astronomical, and Seismological Observations from Ancient Korea. Korean Meteorological Archives Series No. 4, Korea Meteorological Administration, 137 pp
Demarée GR et al. (2013) Bull Séanc Acad R Sci Outre-Mer 59: 385-405
Gao E et al. (2018) Meteorol Serv Singapore Res Lett 2: 3-11
Huang B et al. (2019) Nat Hazards 95: 529-545
Kubota H, Chan JCL (2009) Geophys Res Lett 36: 1-4
Mikami T (2008) Weather 63: 190-193
Pei Q, Forêt P (2018) Environ Hist 23: 863-871
Wang PK et al. (2018) Sci Data 5: 180288
Zaiki M et al. (2006) Int J Climatol 26: 399-423
Zhang DE (2004) A Compendium of Chinese meteorological records of the last 3,000-years. Jiangsu Education Press, 2701-2843
Chantal Camenisch1, H. Huhtamaa1, N. Maughan2 and C. Rohr1
Recent studies reconstructing past climates in Northern and Western Europe have employed innovative uses of natural archives and documentary data. Documentary climate proxies include plant and ice phenological data, weather-related descriptions in chronicles, newspapers, and administrative records, as well as early weather diaries and instrumental records.
Modern historical climatology as a scientific discipline has its beginnings in Western and Northern Europe. Pioneering reconstructions by Hubert H. Lamb, Emmanuel Le Roy Ladurie, and a generation later by Pierre Alexandre, Astrid Ogilvie, and Andres Tarand, focus on these regions. In the following decades, scientists have continued to be productive in studying and analyzing past climate in this part of the world. Here, we discuss the most recent climate reconstructions (since 2014) from the field of historical climatology, together with a brief overview of the most commonly used sources and methods.
 |
|
Figure 1: Grape harvest in Northern Italy in October, by Maestro Vencelsao. This fresco, painted around 1400, is located in the Eagle Tower of the Buonconsiglio Castle in Trento, Italy. Source: https://commons.wikimedia.org/w/index.php?curid=6435756 |
France
Among the most recent reconstructions of the climate of France or parts of modern France, the work of Laurent Litzenburger (2015) deserves special mention. Litzenburger reconstructed seasonal temperature and precipitation indices for the Lorraine region as well as several extreme weather events and their impacts on society from 1400 to 1530. For this purpose, Litzenburger examined a large corpus of historical documents such as narrative sources with weather descriptions, but also plant-phenological proxies. Thomas Labbé et al. (2019) published another important summer temperature reconstruction based on grapevine phenology in Beaune from 1354 to 2018. The authors used a series of data covering 664 years to determine the beginning of the grape harvest using wage payments, newspapers, and the deliberations of a church chapter and the city council (picture of medieval grape harvest, Fig. 1). The grape harvest dates were homogenized and then calibrated and verified with a long series of early instrumental measurements from Paris. Pichard and Roucaute (2014) published a history of hydrology and flooding in the Rhone valley over the last 700 years.
Several specific extreme weather conditions and weather-related disasters have attracted attention in France in recent years. These include historical droughts, a topic which was addressed in a 2020 special issue of Regional Environmental Change edited by Nicolas Maughan et al. Alexis Metzger and Nicolas Jacob-Rousseau (2020) examined the 1857–1858 drought in Alsace. The authors combined narrative texts, such as letters and reports from municipal officials, farmers, and industries, with instrumental data derived from local rainfall stations. In Emmanuel Garnier's (2019) comparative analysis of droughts over the past 500 years from the Île-de-France, the UK, and the Upper Rhine Valley, documentary data form the backbone of the earlier part of the reconstruction. Garnier mainly uses diaries and municipal chronicles, but he stressed that historians must include all kinds of sources in their analysis. Garnier also recently reconstructed French floods and storms for case studies (Garnier et al. 2018).
The Benelux countries
One of the most comprehensive reconstructions of the last two millennia concerns the climate in Belgium and neighboring regions, with the first of several volumes published in Dutch in 1995 by Jan Buisman. The numerous and varied documentary data used for this reconstruction range from a large number of narrative sources to climate proxies and early instrumental measurements. Aryan van Engelen has transformed the text collection into semi-annual climate indices.
A number of reconstructions with a narrower focus have also been published in recent years, including a seasonal temperature and precipitation reconstruction of the 15th century by Chantal Camenisch (2015), which is based mainly on narrative sources and uses climate indices. Adriaan de Kraker (2017) applied a different approach for a reconstruction of the ice cover on Belgian canals in the period from 1330 to 1800. The author analyzed the costs for the laborers who removed the ice to enable shipping traffic on the canals, which were duly recorded in the city accounts. Alexis Metzger and Martine Tabeaud (2017) focused on winter weather conditions in a weather diary of Friesland. They analyzed temperatures and severity by comparing the duration of the wintry weather from 1594 to 1612, and by counting days of frost, rain, or snowfall in the same period.
The British Isles
Historical climatologists have also published reconstructions covering the British Isles in recent years. Kathleen Pribyl (2017) reconstructed temperatures and precipitation in Norfolk from 1256 to 1448 by analyzing grain harvest dates in medieval account books and other documentary data. Pribyl calibrated the medieval grain harvest dates with harvest dates from the 18th and 19th centuries, and with measured temperature and precipitation series. Two papers on droughts and their impact on society based on historical precipitation records from areas of the British Isles (Harvey-Fishenden et al. 2019; Murphy et al. 2020) are available, and a database called TEMPEST, on extreme weather events in the UK, is currently in progress (e.g. Veale et al. 2017).
 |
|
Figure 2: Riga and its harbor, by Adam Olearius, 1727. This map is one of the objects being investigated to provide new insights into past climate. ETH-Bibliothek Zürich, Alte und Seltene Drucke. |
Scandinavia and the Baltic states
The Nordic and Baltic states have a long tradition of employing ice phenological observations, such as the dates of freezing and ice breakup in harbors, rivers, and lakes. Such studies have used ice data from the ports of Stockholm, Tallinn, and Riga (Fig. 2), in addition to various stations from the German Baltic coast, although all of these studies were published prior to 2015. A recent addition to the historical ice-breakup observations from the region is a series (1749–2018) from Aura River in Turku, southwest Finland (Norrgård and Helama 2019). This series, like the earlier ice-breakup data, demonstrates strong correlation between the breakup dates and late-winter/spring temperatures. Besides temperature-sensitive written source materials, Dag Retsö and Lotta Leijonhufvud (2020) have compiled a dataset on Swedish historical droughts (1400–1800) from various documentary evidence.
Evaluation of the sources and methods
During the past years, historical climatologists in Western and Northern Europe have examined a large variety of documentary sources. Where available, notes of early instrumental measurement and weather diaries provide very detailed information useful for the calibration of other series. As several examples show, newspapers are also rich sources of data for historical climatology. For the period prior to these measurements, narrative sources, as well as account books and minutes of official and municipal institutions, provide a plethora of data for climate reconstructions. Such sources contain weather-related descriptions or plant or ice phenological information that can serve as proxies for climate variables. The examples of grape harvest dates in Beaune and canal freezing dates in the Netherlands and Belgium demonstrate the potential of such sources. Depending on the types of information derived from the documentary data, studies may either create indices or directly reconstruct meteorological conditions by applying calibration and verification processes.
affiliations
1Oeschger Centre for Climate Change Research and Institute of History, Section of Economic, Social and Environmental History, University of Bern, Switzerland
2Pythéas Institute - Earth sciences and astronomy observatory, Foundation A*MIDEX, Aix-Marseille University, France
contact
Chantal Camenisch: chantal.camenischhist.unibe.ch
references
Buisman J (1995) Duizend jaar weer, wind en water in de Lage Landen, Deel 1: Tot 1300. Uitgeverij Van Wijnen, 656 pp
Camenisch C (2015) Clim Past 11: 1049-1066
de Kraker AMJ (2017) Water Hist 9: 109-128
Garnier E et al. (2018) Coastal Eng 134: 10-23
Harvey-Fishenden A et al. (2019) Reg Environ Change 19: 2325-2337
Labbé T et al. (2019) Clim Past 15: 1485-1501
Litzenburger L (2015) Une ville face au climat : Metz à la fin du Moyen Âge, 1400-1530. Éditions Universitaires de Lorraine, 487 pp
Maughan N et al. (Eds) (2020) Reg Environ Change: topical collection
Metzger A, Jacob-Rousseau N (2020) Reg Environ Change 20: 48
Metzger A, Tabeaud M (2017) Clim Change 141: 331-345
Murphy C et al. (2020) Int J Climatol 40: 5329-5351
Norrgård S, Helama S (2019) Holocene 29: 953-963
Pichard G, Roucaute É (2014) Méditerranée: special issue
Pribyl K (2017) Farming, Famine and Plague: The impact of climate in Late Medieval England. Springer, 307 pp
Retsö D, Leijonhufvud L (2020) Clim Past Discuss, doi:10.5194/cp-2020-25