PAGES Magazine articles
Cherié J. Dirk and Lindsey Gillson
When restoring damaged or degraded ecosystems, land-use managers usually have a restoration target in mind. But how do they decide this target, and how do they know if it is realistic? This question is especially important when dealing with Renosterveld, a highly endangered component of the Fynbos biome in South Africa.
Restoring a biodiversity-rich, but endangered, ecosystem
Renosterveld is an evergreen, fire-prone Mediterranean-type shrubland, which is restricted to fertile, fine-grained soils of the Fynbos biome. The composition of Renosterveld generally includes grasses and a high diversity of endemic geophytes (bulbs), for example, of the genera Amaryllidaceae, Asparagaceae, Iridaceae, Hyacinthaceae, Orchidaceae, Oxalidaceae, and Geraniaceae, many of which are endemic, rare, or threatened. For example, of the Iridaceae, about 48% of the known species are listed as rare or threatened and about 76% are endemic to Renosterveld. Some bulb species (such as Freesia, Ixia, Ornithogalum, and Pelargonium) are economically important world cut-flowers (Rebelo et al. 2006). Unfortunately, 91-97% of Renosterveld has been transformed for agriculture, so the remaining fragments are vital to the survival of this megadiverse biome. The species that currently dominates Renosterveld fragments is an evergreen, unpalatable shrub called Elytropappus rhinocerotis (Renosterbos). Little is known about the historic abundance and distribution of Renosterbos, leaving managers and conservationists to speculate on whether the current composition is typical and therefore a worthy conservation target, or whether restoration efforts are needed.
A long-term understanding of Renosterveld
Very little is known about the history of Renosterveld, and whether what remains today is typical of its once much more extensive past. Though fire and herbivores are integral to Renosterveld ecology, it is difficult for land-use managers to know whether their prescribed grazing and burning regimes are appropriate to maintain such an extraordinary and unique species diversity. Furthermore, there are conflicting ideas of what Renosterveld vegetation should consist of – less or more grasses and shrubs (Cowling et al. 1986; Curtis 2013; Curtis and Bond 2013).
 |
|
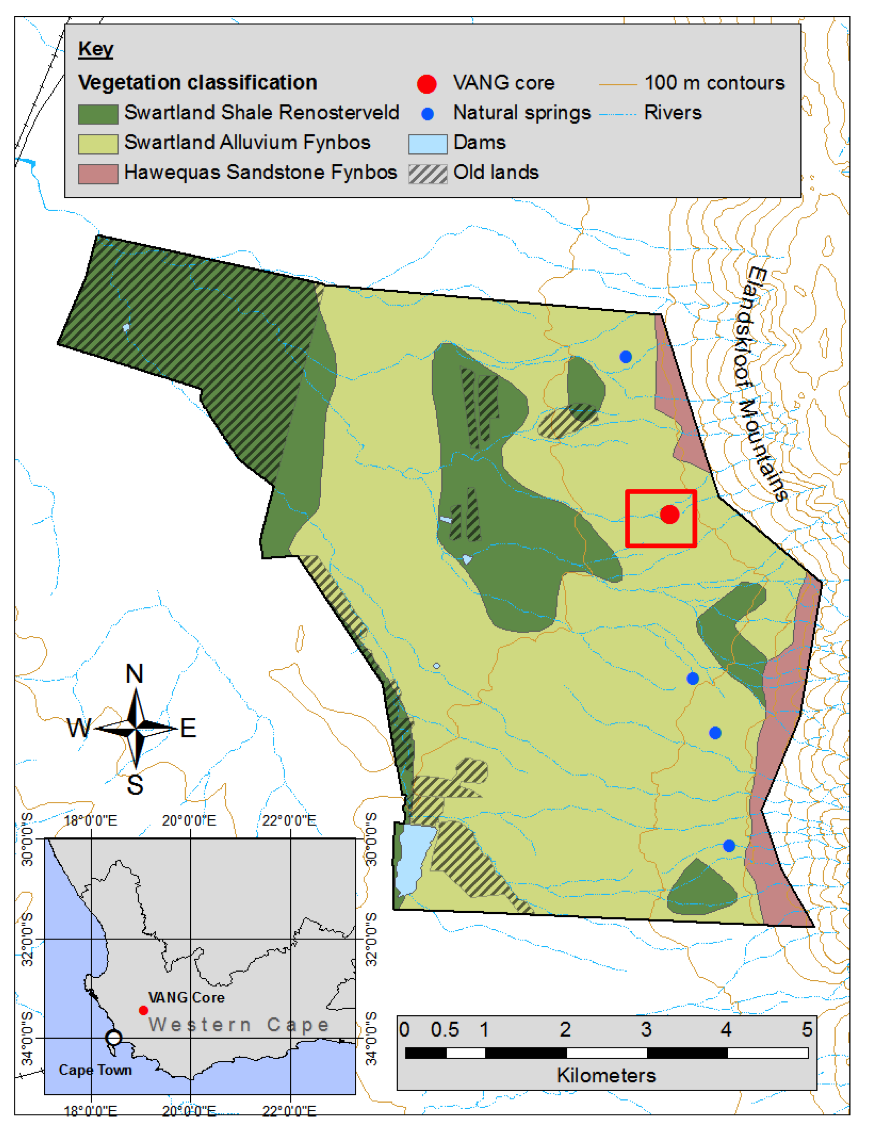
Figure 1: Map of Elandsberg PNR study site showing location of Vangkraal Spring wetland where the "VANG" sediment core was retrieved (red dot; 33.4383167 S and 19.068967 E). Diagonally crossed areas represent old lands that were previously cultivated. The red box represents the approximate study area. Figure reprinted from Forbes et al. (2018). |
One way to resolve this dilemma is to look at long-term data to find out how Renosterveld looked and functioned ecologically prior to intensive management and land transformation, which began in the mid-17th century with the arrival of European settlers and further increased in the 20th century due to agricultural intensification. As there is little documented information from this period, long-term paleoecological data can be used to reconstruct how ecosystems looked in the past. Fossil pollen, coprophilous fungal spores, and charcoal from sediment cores can be used to reconstruct changes in the surrounding vegetation, herbivory (grazing) and fire regime. This multiproxy approach can be used to assess the relative importance of changing land use (specifically fire and herbivory) and climate in driving vegetation change.
Elandsberg Private Nature Reserve as a case study
Elandsberg Private Nature Reserve (PNR) is located in the Wellington District of the Western Cape, South Africa (Fig. 1), and contains one of the few and largest remaining fragments of West Coast Renosterveld. It is especially important because it is home to the critically endangered geometric tortoise (Psammobates geometricus), which is endemic to this region and one of the rarest tortoises in the world (Boycott and Bourquin 1988). The area has a long history of land use, with people managing fire and herbivory for more than 2000 years. Hunter-gatherers were in the region from 10,000-2000 yr BP (Deacon 1992) and land use further intensified with the arrival of the Khoikhoi pastoralists, who introduced livestock approximately 2000 yr BP (Cooke 1965; Elphick 1977; Boonzaier et al. 1996). With the arrival of European-settler agriculture from the mid-17th century, the region saw an increase in grazing pressure and grain crop cultivation, and combinations of fire suppression (to protect agriculture and property) in some areas and regular burning to promote pasture in others. In the 20th century, technology and industrialization allowed agricultural intensification and further transformation of natural vegetation.
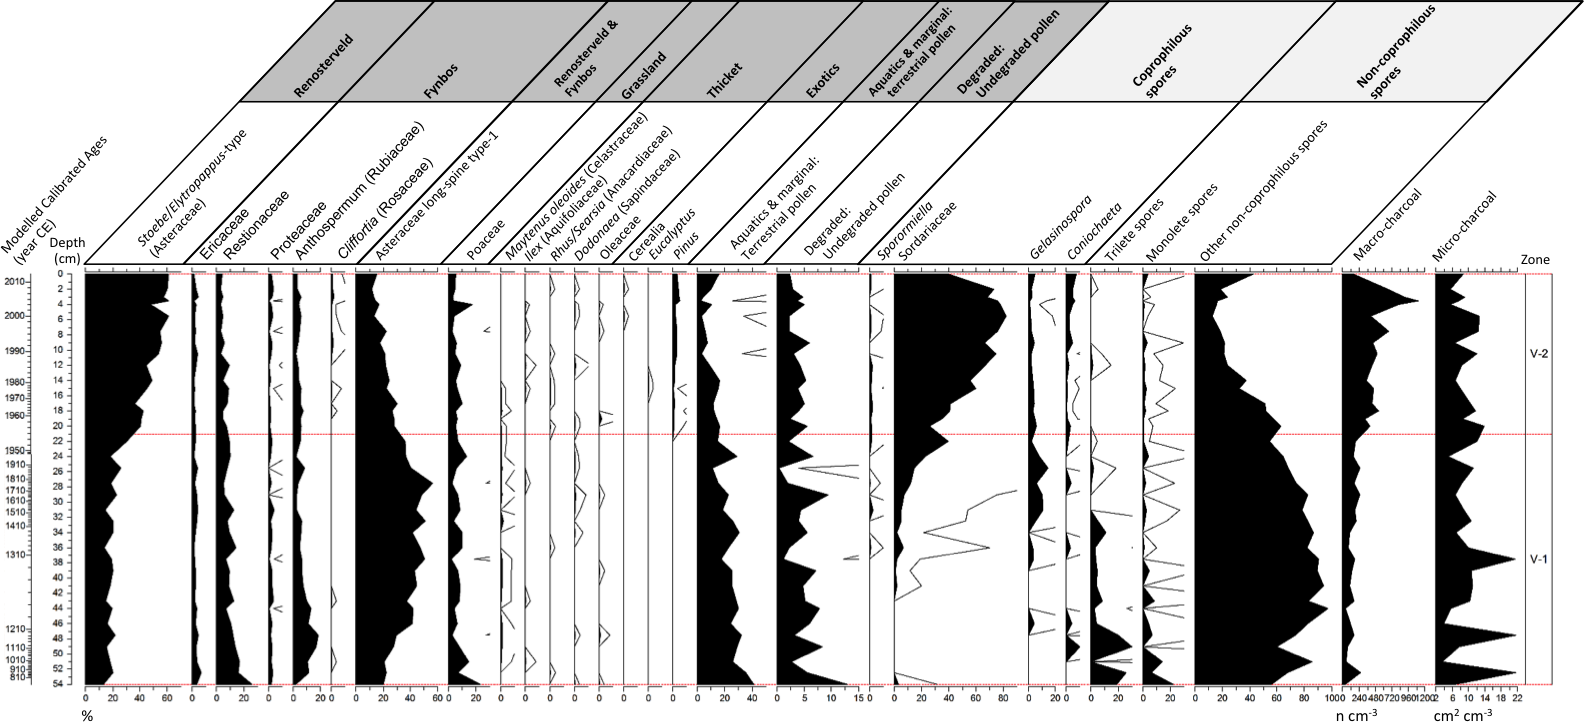
A paleoecological study has now shed light on the history of the vegetation of Elandsberg PNR, providing important pointers for management and conservation in the future (Forbes et al. 2018). Pollen, charcoal, and fungal-spore data showed that the landscape of Elandsberg PNR today is still heavily influenced by human use, despite the area being a nature reserve since 1973. The data showed that Elandsberg PNR has been heavily transformed by farming since about the 1950s, when domestic livestock were abundant (Fig. 2). Charcoal abundance increased dramatically at this time, suggesting that farmers started burning Renosterveld much more frequently, to improve grazing for cattle and sheep. This increase in herbivory and fire transformed the vegetation, specifically by causing a huge increase in the abundance of unpalatable Renosterbos (Elytropappus rhinocerotis) at the expense of other Renosterveld shrubs (Forbes et al. 2018).
 |
|
Figure 2: Percentage diagram for selected pollen taxa from the VANG core. The pollen sum included terrestrial and unknown pollen. True values have been multiplied by a factor of 10 since percentage values are often low for most taxa. Zonation is calculated by cluster analysis based on 70% minimum resemblance levels and is indicated by the dashed line and boxes V-1 and V-2 to the far right of the diagram. Troels-Smith (1955) stratigraphy is shown on the left as well as modeled calibrated ages that were determined using the age-depth model clam (Blaauw 2010). |
Although the primary function for Elandsberg PNR was for the conservation of the geometric tortoise, when it became a nature reserve, managers replaced domestic livestock with re-introduced large indigenous herbivores including eland, blue and black wildebeest, zebra, red hartebeest, gemsbok, bontebok, and springbok (Fig. 1). Whether intentional or not, the fires at Elandsberg PNR (which were often caused by uncontrolled wild fires surrounding the reserve) remained high despite the transition from farming to conservation practices. Together with the high levels of herbivory caused by the re-introduced large indigenous herbivores, more fires resulted in the vegetation remaining in a transformed state – with abundant Renosterbos, and a less-diverse flora.
These results show that Elandsberg PNR was not in a typical state when the reserve was established. In fact the landscape of the 1970s was degraded by heavy grazing and frequent fire. Before the paleoecological project, reserve managers had no way of knowing that this was the case and assumed that the 1970s was a good baseline for their management goals. However, the paleoecological results show that a much better baseline and appropriate restoration target would be before intensive farming began in the 1950s, when herbivores were fewer, fire less frequent, and Renosterbos less abundant. If current high levels of grazing and fire continue, it is possible that the landscape will become further dominated by Renosterbos, with associated loss of heterogeneity and biodiversity.
Looking ahead, Forbes et al. (2018) suggest that more experimental work is needed. Grazing exclosures and trials of different fire frequencies could help managers to find ways of reducing Renosterbos abundance and restoring vegetation to a more healthy state. Maintaining a diverse array of vegetation types in the reserve is good for Renosterveld biodiversity and also might help build resilience to future climate change. Therefore a flexible management approach and long-term monitoring at the patch and landscape level is recommended. Furthermore, future research using system dynamics modeling will provide decision-making support, allowing managers to explore the effects of future scenarios of changes in fire and grazing (Dirk et al. in prep).
Paleoecology provides a long-term perspective needed for restoration
Projects such as these show how short-term perceptions can mislead managers, to the detriment of biodiversity conservation. Most landscapes have been heavily transformed by people over the past century, and many have also been impacted by other stressors, such as climate change, and rising CO2 and Nitrogen deposition. Using 21st century baselines for conservation and restoration targets could therefore be inappropriate. Restoration is an important component of conservation biology as it seeks to actively reverse degradation of an ecosystem, but accurate information is needed to inform managers about the historical range of variability of biodiverse landscapes, and the effects of human management in recent decades. Paleoecological research can provide context for interpreting recent changes and in developing restoration targets that conserve biodiversity and ecosystem services for future generations. Paleoecology can inform restoration targets by providing a window into how ecosystems functioned before heavy impact by people in the 20th century, and therefore guide future restoration. In the case of Renosterveld, managers can use paleoecological data to decide whether landscapes contain less or more, for example, grass, bulbs, grazing, or fire, to be at a healthy state that is resilient and sustainable in the future.
affiliation
Plant Conservation Unit, Department of Biological Sciences, University of Cape Town, South Africa
contact
Cherié Dirk: cheriedirk gmail.com
references
Blaauw M (2010) Quat Geochronol 5: 512-518
Boonzaier E et al. (Eds) (1996) The Cape herders: A history of the Khoikhoi of southern Africa. New Africa Books, 147 pp
Boycott RC, Bourquin O (1988) The South African tortoise book: A guide to South African tortoises, terrapins and turtles. Southern Book Publishers, 148 pp
Cooke CK (1965) Africa 35: 263-285
Cowling R et al. (1986) Biol Conserv 37: 363-377
Curtis O (2013) Management of Critically Endangered renosterveld fragments in the Overberg, South Africa (PhD Thesis). University of Cape Town
Curtis O, Bond W (2013) What is Renosterveld? Veld Flora 99: 180-183
Deacon HJ (1992) Philos Trans R Soc Lond B Biol Sci 337: 177-183
Forbes CJ et al. (2018) Anthropocene 22: 81–93
Rebelo AG et al. (2006) In: Mucina L, Rutherford MC (Eds) The vegetation of South Africa, Lesotho and Swaziland. South African National Biodiversity Institute, 53-219
Troels-Smith J (1955) Danmarks Geologiske Undersogelse 3: 39-73
Davnah Payne1, C. Hoorn2 , C. Randin3 and S.G.A. Flantua4
Mountains host a spectacular diversity of species. Yet current species distribution is only a snapshot in time that bears the memory of past geomorphological and climatic changes. Understanding past changes is key to interpret current patterns and inform mountain biodiversity conservation and management in the future.
The present: mountains are (bio)diverse
Terrestrial mountains sensu Körner et al. (2011; 2017) cover approximately one-tenth of the total land surface. These mountains vary in many ways, from their geological history to their appearance and ecosystems. The Chaîne des Puys in France or Mount Fujiyama in Japan are volcanic, whereas the Rocky Mountains of North America are so-called fold mountains that resulted from the thickening of the Earth's crust. In the Black Hills of South Dakota, USA, mountains are dome-shaped, whereas the table-top mountains of Venezuela are plateaus.
Within the same African continent, some mountains like Mount Kilimanjaro are high and capped with ice, while others such as the Eastern Arc Mountains are lower and mostly covered with dense tropical forest. Some, like the Kohala Mountains of Hawaii, USA, cover a small geographic area, while others like the Himalayas are immense and stretch across several countries and thousands of kilometers. And yet as diverse as they are (Gordon 2018), all these mountains share a common characteristic: they host a spectacular diversity of species, of which many are endemic, and contribute disproportionately to the terrestrial biodiversity on Earth (Rahbek et al. 2019a). The Cape Fold belt of South Africa alone has 68% endemism across the 9000 plant species known to science (IPBES 2018), the Andes are home to an approximate 45,000 plant species (Myers et al. 2000), and more than half of the world's "biodiversity hotspots" are entirely or partly in mountainous areas (Körner and Ohsawa 2005).
The past: geomorphology, climate, and evolution
The current distribution of mountain species and their high levels of richness and endemicity just represent a snapshot in time that bears the collective memory of the millions of years of geomorphological and climatic changes that drove species along individual evolutionary trajectories. These environmental drivers often left almost intangible traces, making the reconstruction of the historical biogeography of mountains and their biodiversity an intriguing puzzle. Yet, the general consensus is that uplift events (Hoorn et al. 2018) set the stage for species' evolution by providing novel ecological opportunities along newly arising surfaces (Antonelli et al. 2018a).
 |
|
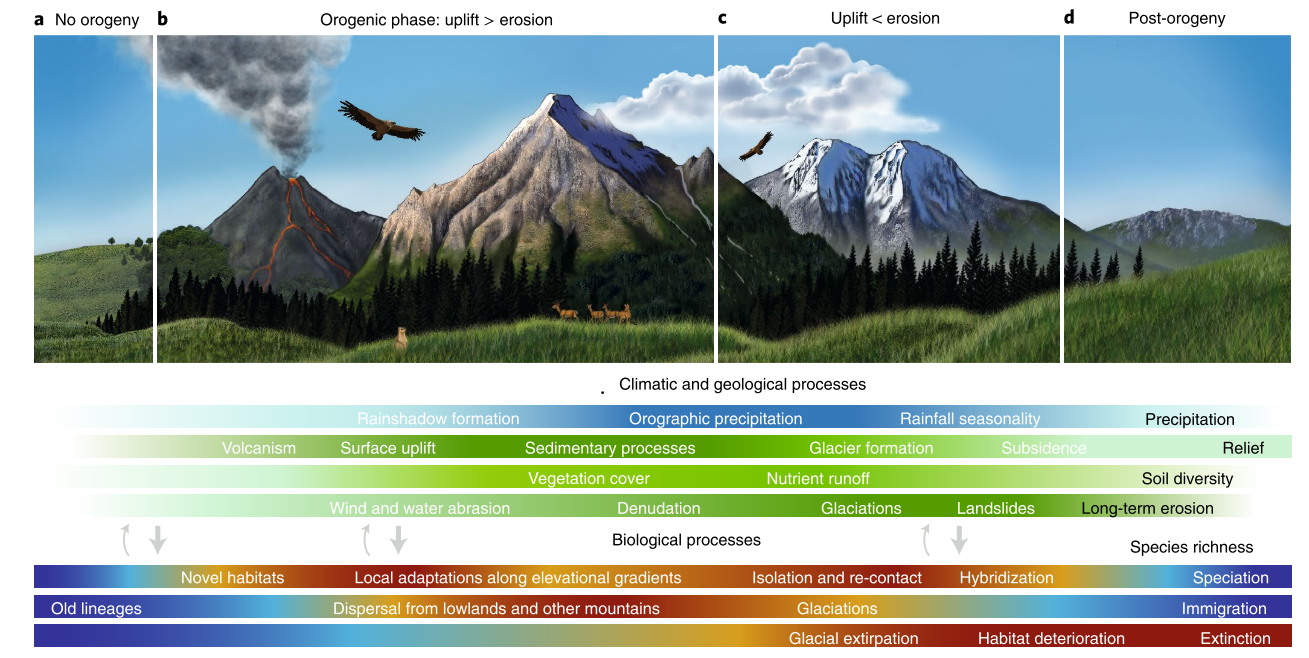
Figure 1: Linking the evolution of mountains and biodiversity. (A-D) Climatic (blue bar) and geological (green bars) variables influence species richness through speciation, immigration, and extinction (lower bars) through different orogenic phases. Darker/warmer and lighter/colder colors in the bars indicate high and low levels, respectively. As the arrows indicate, climatic and geological processes exert the strongest effects on species richness, but some feedbacks exist (such as plants colonizing bare rocks and increasing erosion, and animals affecting soils through burrowing). Figure courtesy of I. Voet, Muséum National d'Histoire Naturelle, Sorbonne Université, Paris; first published in Antonelli et al. (2018a). |
The uplift of the tropical Andes, for example, was instrumental in the development of biodiversity and humidity entrapment in the Neotropics, including the Amazon basin. It created both dispersal barriers and opportunities for colonization and diversification through novel high-elevation environments and greater topographic complexity, as well as for dispersal along newly opened routes. Uplift and other geomorphological processes created diverse mountain morphologies (Elsen and Tingley 2015), as well as complex and unique landscapes of ridges, valleys, peaks, and plateaus (Molnar 2018). With recent methodological advances in thermochronology and paleoaltimetry (e.g. Antonelli et al. 2018a; Perrigo et al. 2019), estimations of the timing and rate of these processes are becoming increasingly precise, robust links can be drawn between spatial biogeographic patterns, and geological scenarios can be tested. Such techniques revealed, for example, that some mountain systems such as the Southern Alps in New Zealand uplifted in the past 15 million years (Myr) whereas others such as the European Alps appeared longer ago.
The interaction between novel topographies, tectonic and erosional processes, regional climates partly dictated by the geographic location of mountains and their orientation in relation to global atmospheric circulation patterns (Antonelli et al. 2018a), and shifts in climate patterns subsequently served to increase environmental heterogeneity and achieve the extraordinary diversity of species and life histories in mountains.
Over the last three or more Myr, successive climatic cycles modified patterns of biodiversity by stimulating geographic-range shifts within mountain regions and between mountains and adjacent lowlands, driving rapid altitudinal migrations upslope during interglacial and downslope during glacial periods, temporarily opening pathways or creating barriers for dispersal to new environments, or dividing and isolating populations.
Accordingly, species richness can be envisioned as the result of multiple episodes of diversification triggered by the consecutive connection and isolation of mountains and species, a hypothesis described in the so-called "flickering connectivity system" framework (Flantua and Hooghiemstra 2018; Flantua et al. 2019). This hypothesis builds on the premise that changes in historical connectivity are important – and possibly as important or even more so than mere isolation – in determining present biodiversity, with historically connected areas characterized by higher species richness (Flantua and Hooghiemstra 2018).
An important fragmentation mechanism associated with climatic cyclicity that played an important role in the diversification of species, such as birds in the Southern Alps of New Zealand (see Flantua and Hooghiemstra 2018) or plants in the Tibeto-Himalayan region (Mosbrugger et al. 2018; see Muellner-Riehl 2019), comes from ice caps on mountaintops and ridges. Yet, while fragmenting habitats, ice also created islands of ice-free habitats, microrefugia from where species such as Saxifraga florulenta in the Maritime Alps could recolonize downhill habitats after episodes of warming (see Patsiou et al. 2014).
Accordingly, the glacial and interglacial periods resulting from climatic fluctuations also played an important role in triggering the evolutionary mechanisms driving present-day species diversity (e.g. Theodoridis et al. 2017), including fragmentation, hybridization, speciation, and extinction (Rahbek et al. 2019b), which all varied in time and space among species and mountain ranges, leaving unique "mountain fingerprints" (Flantua and Hooghiemstra 2018).
The future: why and how to learn from the past
In view of expected changes in present climatic conditions, a better understanding of past species' community dynamics (see Koutsodendris et al. 2019) and of the relationship between environmental transitions and temporal dynamics in morphological and functional traits (Papadopoulou and Knowles 2016; Huang et al. 2019; Muellner-Riehl 2019) can extend the lead-time for adopting sustainable management and adaptation measures. This is particularly important in high elevation and artic regions exposed to rapid warming (Pepin et al. 2015) and likely to experience particularly severe biodiversity losses (Dullinger et al. 2012). Episodes in Earth's history characterized by temperatures and atmospheric carbon dioxide concentrations comparable to those expected in the near future are therefore particularly informative.
Episodes that can serve as an analogue for a future anthropogenic world are the Pliocene (Burke et al. 2018) and the early Eocene (Hollis et al. 2019), when global temperatures were some degrees warmer than today, atmospheric carbon dioxide concentration was slightly higher, and major shifts in plant communities occurred. Examples of such shifts include the strong expansion of Artemisia at the expense of Chenopodiaceae and other drought-tolerant taxa in the Chinese Loess Plateau (Koutsodendris et al. 2019).
Unraveling the biogeographic history of mountain species, determining the relative role and importance of geomorphological processes and climate on the evolutionary trajectories of species, and learning from the past to inform the future requires interdisciplinary approaches and novel methodologies. Interdisciplinary approaches are needed that integrate expertise across fields and temporal scales from paleobiology and -geology to contemporary conservation, genomics, and remote sensing (see Antonelli et al. 2018b on transdisciplinary biogeography).
Novel methods, in turn, are needed to accurately measure the timing of mountain formation and disentangle the effects of mountain uplift from environmental and climatic changes (Perrigo et al. 2019). Together, approaches from thermochronology or paleoaltimetry have considerably improved models and temporal estimates of mountain uplift (Perrigo et al. 2019). Fitting increasingly robust models with data ranging from fossil records to genome sequences is an effective approach to address the correlative nature of prevalent analyses and the space-for-time substitution (Perrigo et al. 2019). Paleo-niche reconstructions and modeling combined with phylogenetics and phylogeography are in turn powerful approaches to reconstruct mountain biome dynamics and improve our understanding of the role of these dynamics in shaping current biodiversity patterns (Flantua and Hooghiemstra 2018).
affiliations
1Global Mountain Biodiversity Assessment (GMBA), Institute of Plant Sciences, University of Bern, Switzerland
2Institute for Biodiversity and Ecosystem Dynamics, University of Amsterdam, The Netherlands
3Department of Ecology and Evolution, University of Lausanne, Switzerland
4Department of Biological Sciences, University of Bergen, Norway
contact
Davnah Payne: davnah.payneips.unibe.ch
references
Antonelli A et al. (2018a) Nat Geosci 11: 718-725
Antonelli A et al. (2018b) PeerJ 6: e5644
Burke KD et al. (2018) Proc Natl Acad Sci USA 115: 13288-13293
Dullinger S et al. (2012) Nat Clim Chang 2: 619-622
Elsen PR, Tingley MW (2015) Nat Clim Chang 5: 772-777
Flantua SGA, Hooghiemstra H (2018) In: Hoorn C et al. (Eds) Mountains, Climate and Biodiversity. Wiley-Blackwell, 171-186
Flantua SGA et al. (2019) J Biogeogr 46: 1808-1825
Gordon JE (2018) In: Hoorn C et al. (Eds) Mountains, Climate and Biodiversity. Wiley-Blackwell, 137-154
Hollis CJ et al. (2019) Geosci Model Dev 12: 3149-3206
Hoorn C et al. (2018) In: Hoorn C et al. (Eds) Mountains, Climate and Biodiversity. Wiley-Blackwell, 1-14
Huang S et al. (2019) J Biogeogr 46: 1777-1791
IPBES (2018) Archer E et al. (Eds) The IPBES regional assessment report on biodiversity and ecosystem services for Africa. Secretariat of the Intergovernmental Science-Policy Platform on Biodiversity and Ecosystem Services, 492 pp
Körner C, Ohsawa M (2005) In: Hassan R et al. (Eds) Millenium Ecosystem Assessment- Ecosystems and human wellbeing: current state and trends. Island Press, 681-716
Körner C et al. (2011) Alp Bot 121: 73-78
Körner C et al. (2017) Alp Bot 127: 1-15
Koutsodendris A et al. (2019) Glob Planet Change 180: 117-125
Molnar P (2018) In: Hoorn C et al. (Eds) Mountains, Climate and Biodiversity. Wiley-Blackwell, 17-36
Mosbrugger V et al. (2018) In: Hoorn C et al. (Eds) Mountains, Climate and Biodiversity. Wiley-Blackwell, 429-448
Muellner-Riehl AN (2019) Front Plant Sci 10: 195
Myers N et al. (2000) Nature 403: 853-858
Papadopoulou A, Knowles LL (2016) Proc Natl Acad Sci USA 113: 8018-8024
Patsiou TS et al. (2014) Glob Chang Biol 20: 2286-2300
Pepin N et al. (2015) Nat Clim Chang 5: 424-430
Perrigo A et al. (2019) J Biogeogr 47: 315-325
Rahbek C et al. (2019a) Science 365: 1108-1113
Louis François1 and Alain Hambuckers2
Paleovegetation modeling, particularly in mountainous areas, could be an important method to understand and produce more reliable forecasts of the impacts of climate change on vegetation and plant species' distribution. The two main tools used for such studies are dynamic vegetation models and species-distribution models.
Greenhouse gas emissions and climate change are, without doubt, affecting plant species' distributions. The diversity of individual responses, the complexity of biotic interactions, and the intensity of human perturbations (fragmentation, pollution, hunting, etc.) make predictions for the future challenging. High-altitude mountain vegetation is particularly at risk and therefore interesting to study because, in the mountains, the climate gradients are steep and it is impossible for species growing near the summits to migrate to higher altitudes.
One of the keys to understand mountain species dynamics and assess future changes in their distributions, productivity and competitiveness, may be searched for in the past. Recent studies (e.g. Cheddadi et al. 2017; Pinaya et al. 2019) have shown that mountain tree species in Africa and South America have responded strongly to late Pleistocene and Holocene climate fluctuations. Here, we briefly examine whether current vegetation and plant-species models are appropriate tools to study those problems, and what the necessary requirements are to model mountain tree species' turnover observed in connection with paleoclimatic changes.
The models and their data
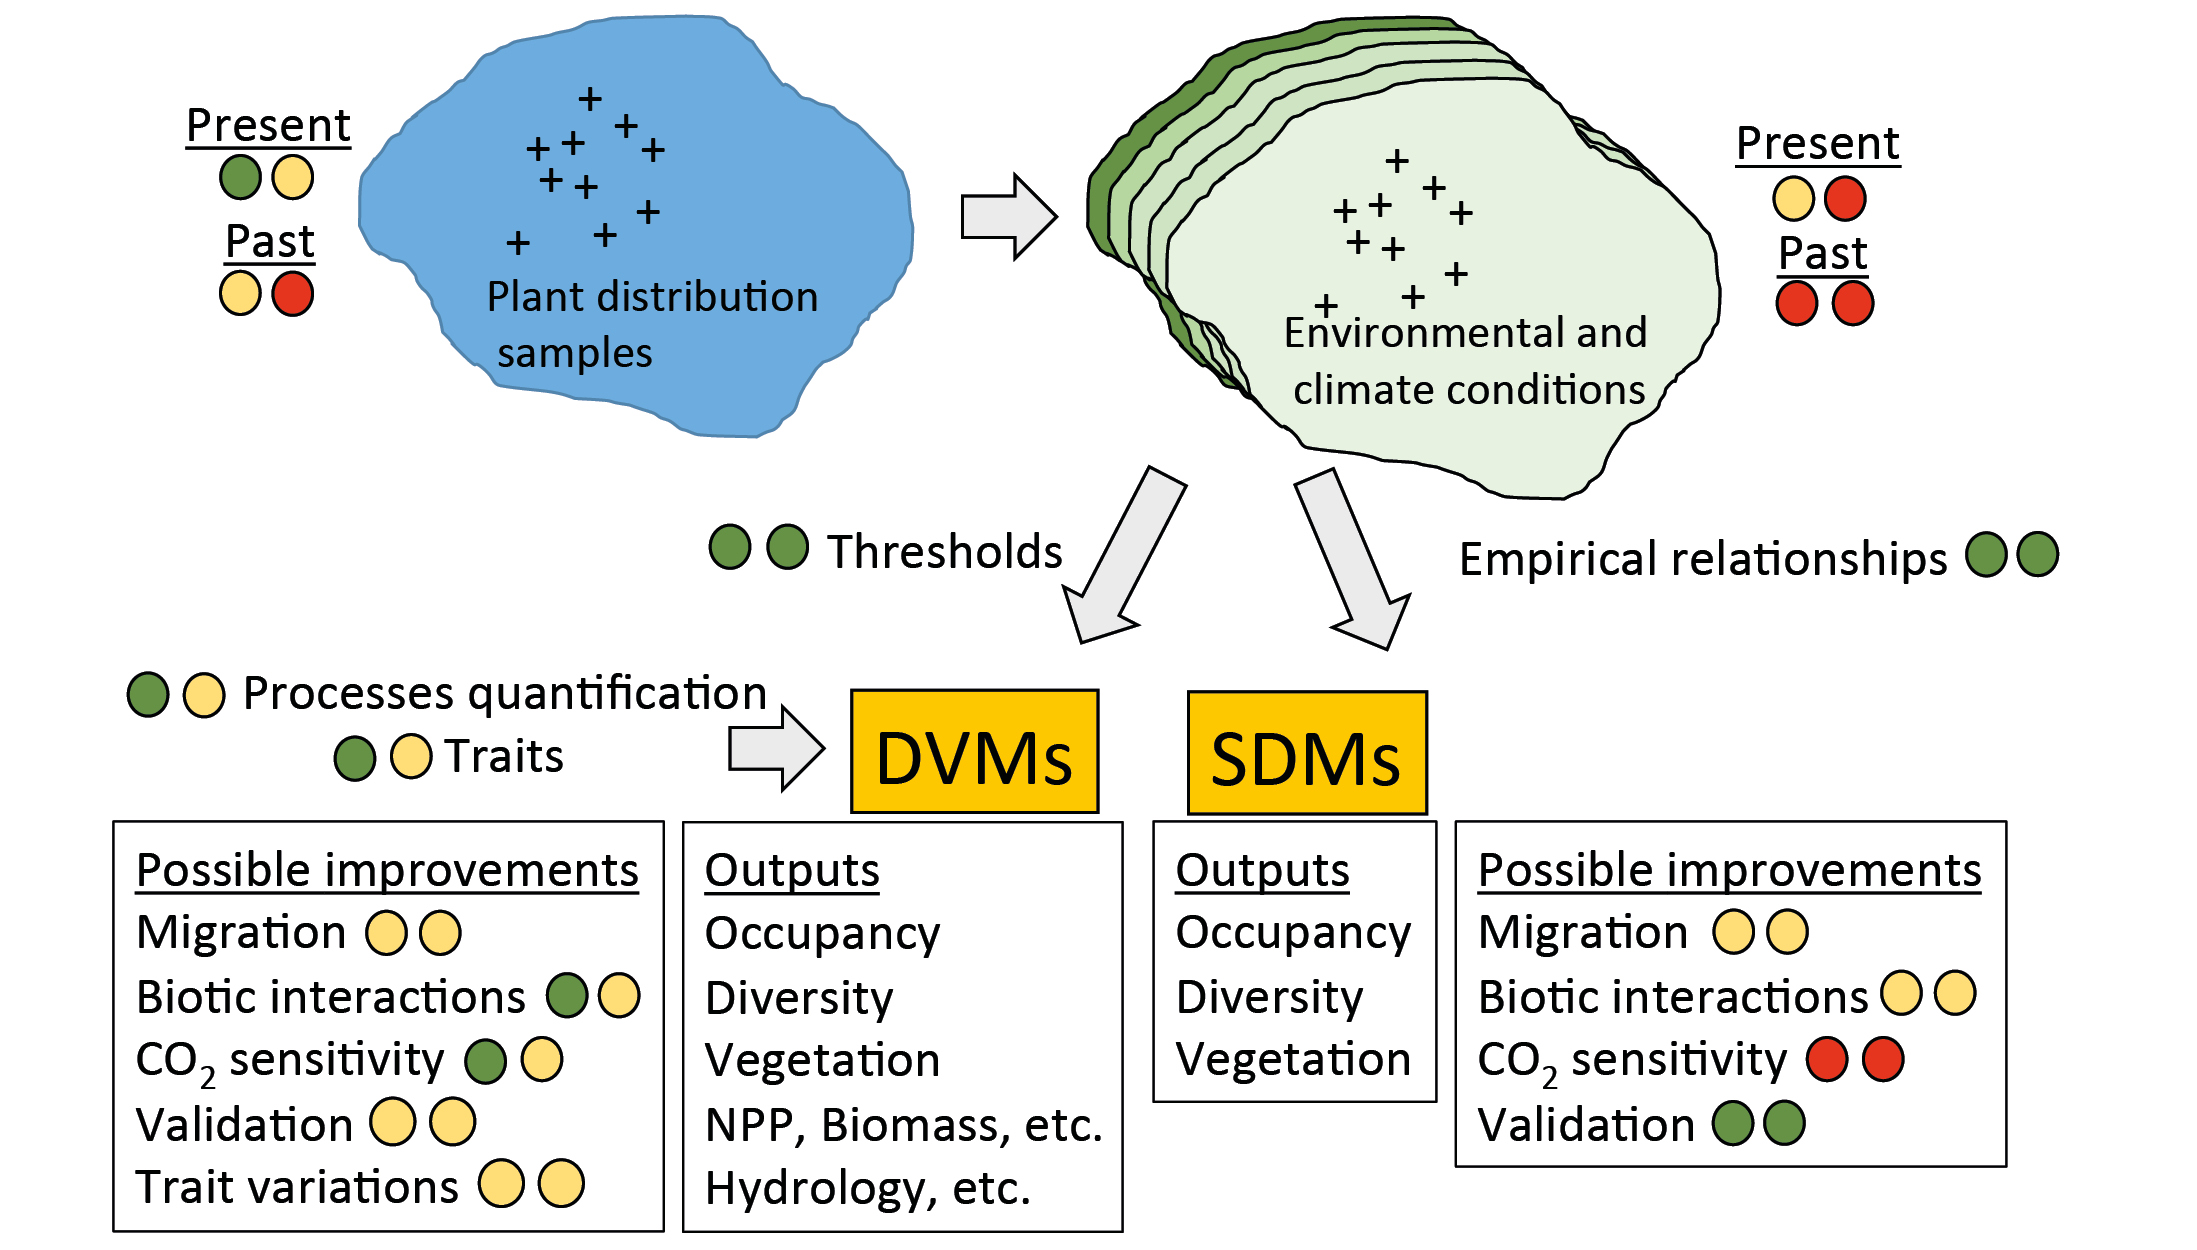
The most popular tools are the species-distribution models (SDMs; Fig. 1). They establish empirical relationships between species' presence and a set of predictors (climate variables, soil properties, land use, etc.; Thuiller et al. 2009). Vegetation can also be modeled with dynamic vegetation models (DVMs), which are process-based models describing the establishment, growth, and mortality of objects representing various plant types, competition among these objects, and processes such as photosynthesis, and respiration (Snell et al. 2014). Most often these objects are plant functional types corresponding to broad vegetation units, but it is also possible to simulate taxa, like species or genus. SDMs and DVMs require large amounts of climatic and environmental data with high enough resolution and accuracy. DVMs used with species require validation data sets like net primary productivity, which are more difficult to obtain.
 |
|
Figure 1: The two main modeling approaches available to reconstruct paleovegetation distribution, with features needing very substantial (red-red), substantial (orange-red), intermediate (orange-orange), small (green-orange) or very small (green-green) efforts. |
In mountains, the accuracy of the forcing and validation data represents a challenge. Climate is strongly variable in space and time and it has been ascertained that growth and establishment of species are strongly dependent on local microclimatic and topographic features. The first challenge is thus to identify those conditions, by developing gridded climatic datasets at high spatial resolution over the studied areas. This is not an easy task, since not only temperature is affected by elevation and complex topography, but also precipitation and cloudiness, solar radiation, air humidity, and wind speed. All these variables must be reconstructed in a consistent way despite the scarcity of meteorological stations in high elevation areas. Temperature inversions are also frequent, especially in winter, and the use of an average vertical temperature gradient may be problematic (Yang et al. 2011). Ideally, dynamic downscaling with high-resolution regional climate models should be used, but it is still rarely the case in ecological studies (Maclean 2019), especially where paleoclimatic reconstructions are concerned.
Complex topography also impacts soil hydrological conditions because of water transport along slopes. The water flow establishes hydrological gradients between mountain summits, and valleys, which induces changes in water-table depth. The presence of springs and the access to or capillary rise of groundwater may be critical for species survival during droughts; this has been found to be essential in explaining the distribution of vegetation at high spatial resolution (at scales smaller than a few kilometers) on any type of terrain. For that reason, SDMs and DVMs should take into account the water transport among grid cells and possibly the dynamics of the water table, when they target a very high spatial resolution. This approach, however, requires detailed and accurate information on soil depth, soil texture, and underlying rock porosity (Wolf 2011), generally not available over the entire distribution area of typical plant species.
CO2 and plant traits
The atmospheric CO2 level is another environmental variable that controls plant growth and distribution. The mixing ratio of CO2 in the atmosphere (~410 ppmv in 2019) has shown very large fluctuations in the past: 1000 to 2000 ppmv in the Eocene, 190 ppmv during the Last Glacial Maximum, and 280 ppmv in the pre-industrial era. It has been established that elevated CO2 stimulates plant growth and resistance to hydric stress at least in the short term. Only DVMs are able to integrate these effects.
 |
|
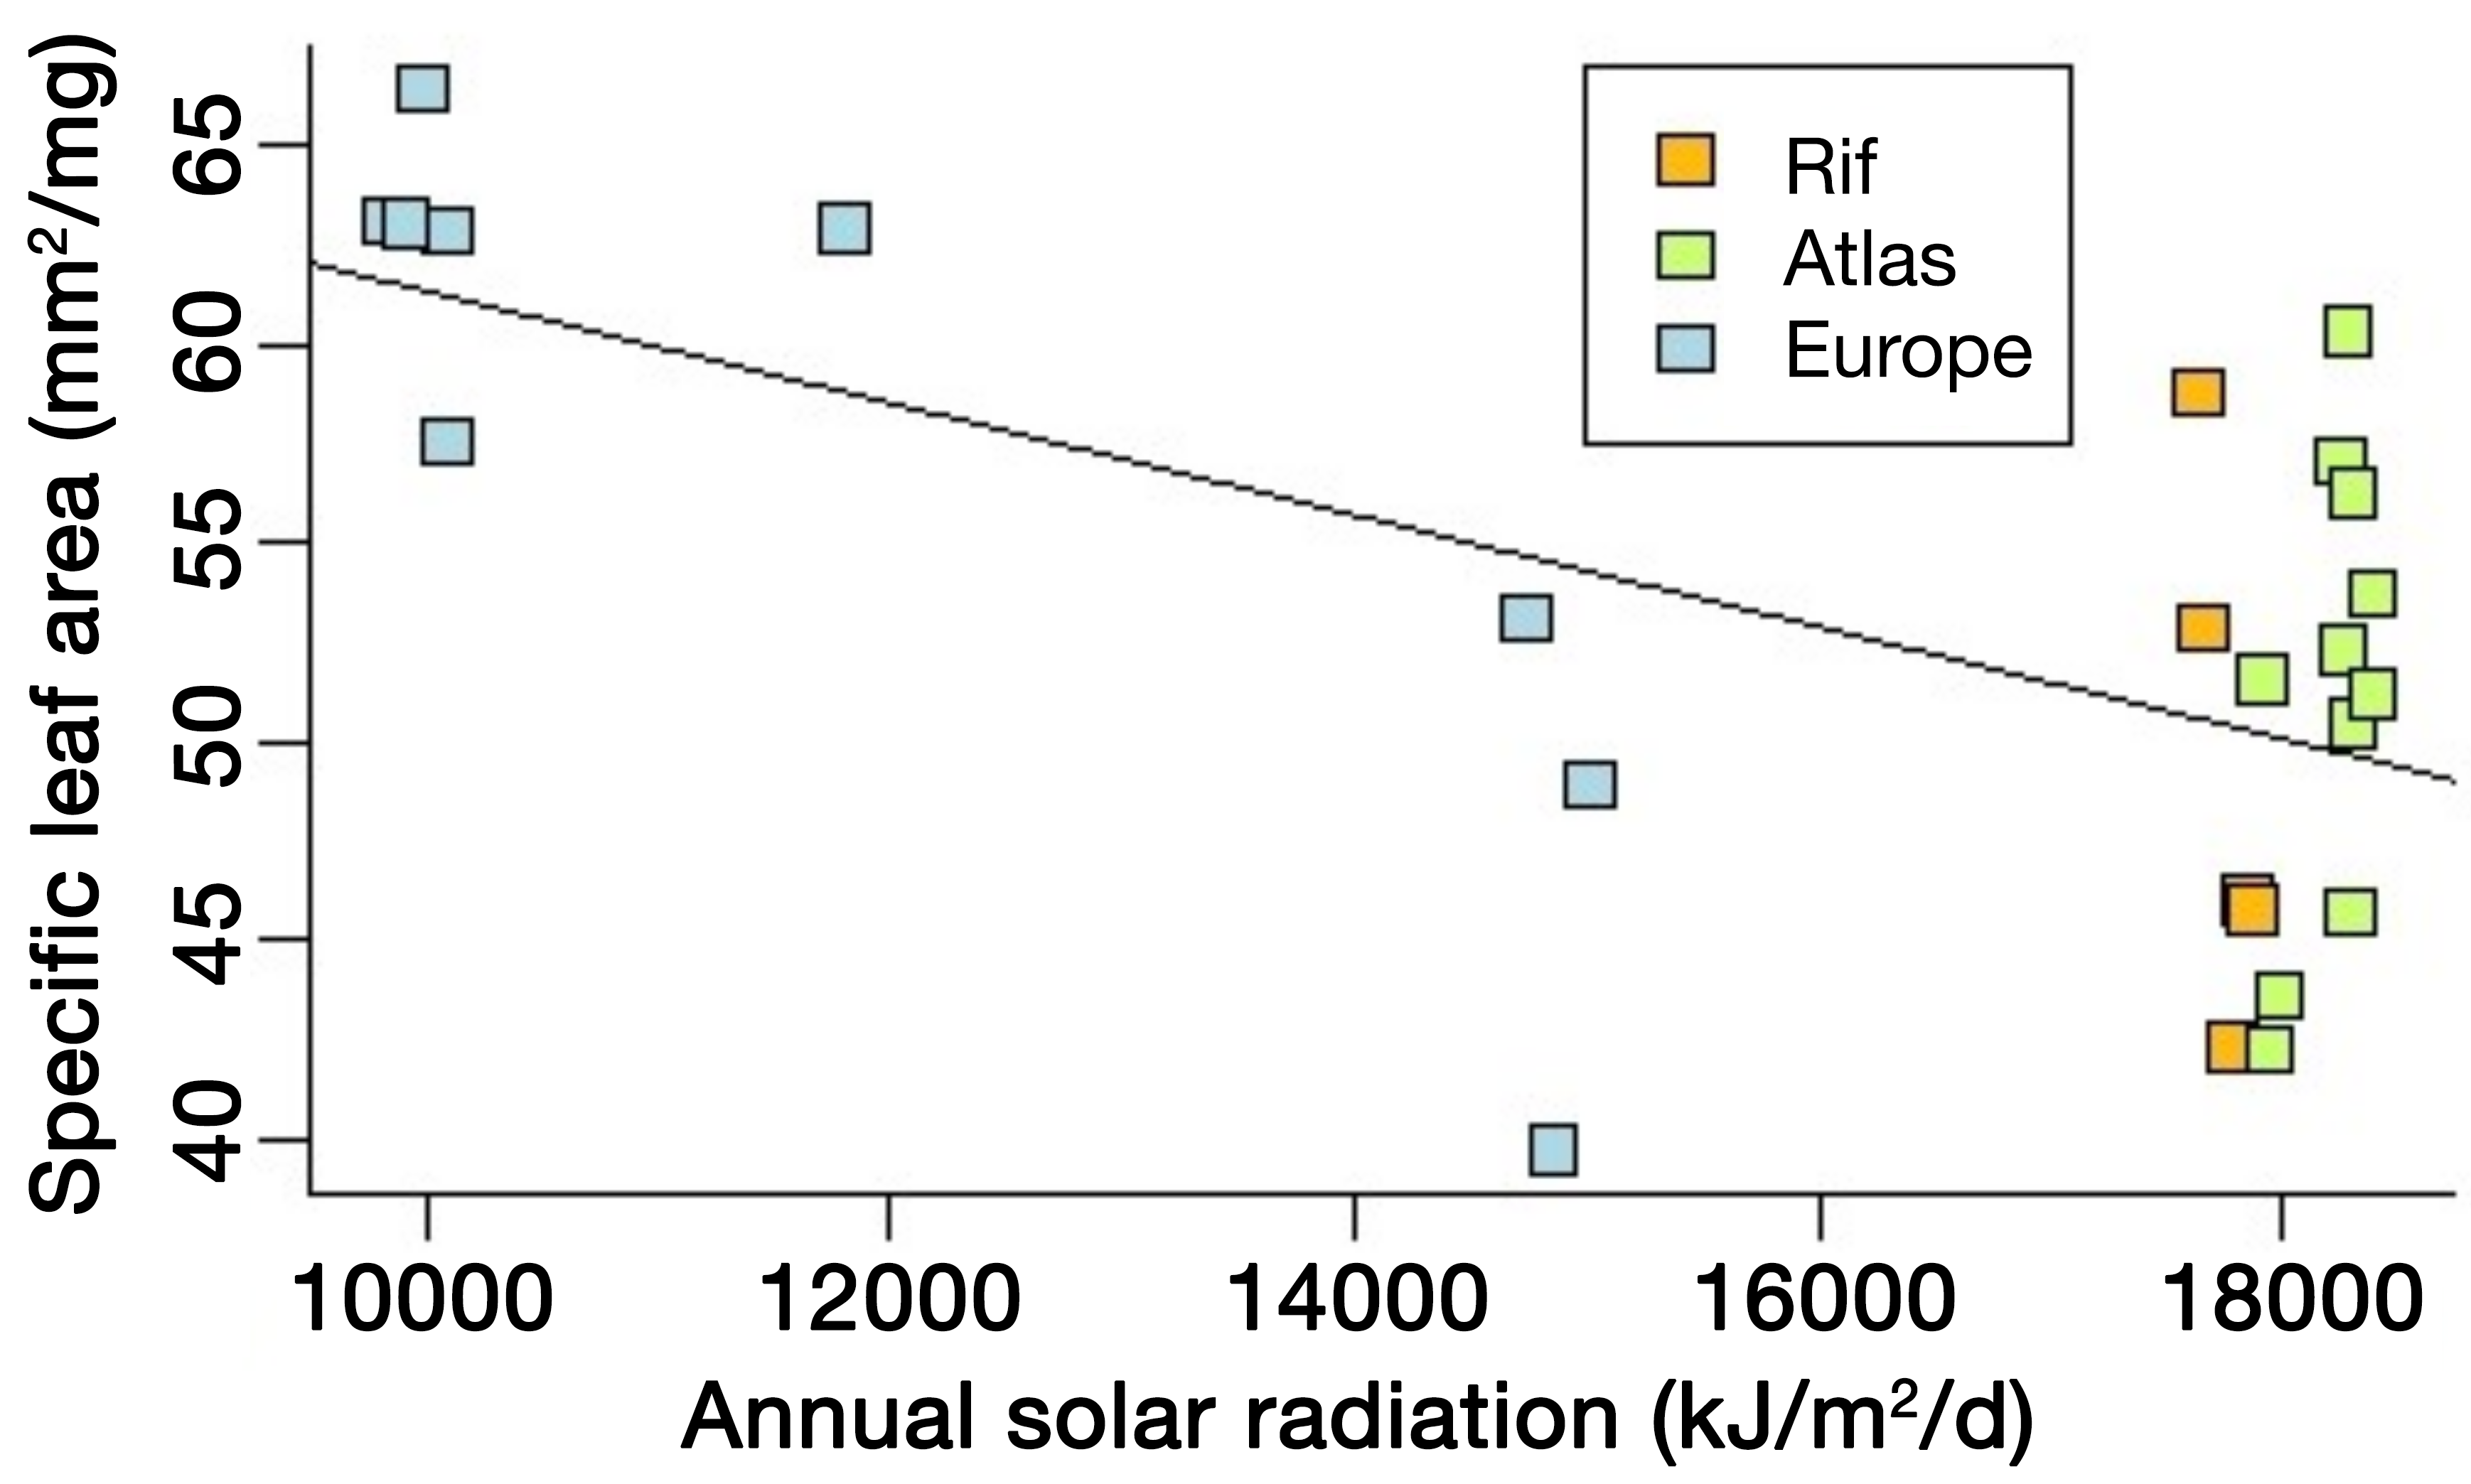
Figure 2: Example of trait variation with a climatic factor: specific leaf area of Cedrus atlantica in Morocco (Rif and Atlas Ranges) and in Europe as a function of annual solar radiation (linear mixed model; likelihood ratio test: p-value = 0.0006, marginal R2 = 0.5123). Other factors related to water availability also exert a control on this trait and may explain the large dispersion of the data points, making predictions challenging. Trait variation in time may follow similar behavior. |
While DVMs seem more appropriate than SDMs to simulate past plant distribution, particularly in view of their sensitivity to CO2, their use is not straightforward, because this requires information on the morphophysiological properties of the taxa, the so-called plant traits. Examples of important traits are leaf and wood nitrogen contents, specific leaf area (i.e. area-to-weight ratio), and leaf longevity. Today, trait data are implemented in international databases, such as TRY (Kattge et al. 2020). However, they are still lacking for many species and the collection of such data is time consuming. In addition, many traits are sensitive to climate and environmental conditions (Fig. 2), reflecting the acclimation capacity of the organisms.
Thus, there may have been variations in these traits in the past, modifying the species' sensitivity to climate variables. The involved processes are complex and consequently large uncertainties remain. For instance, this is the case with the long-term impacts of high CO2 levels (Van Der Sleen et al. 2015). CO2 enters the leaf through the stomata. This inflow increases under elevated CO2, which stimulates photosynthesis. But carbon fixation by photosynthesis also depends on leaf nitrogen, and it has been observed that, in the long term, the plant acclimates to elevated CO2 by allocating less nitrogen to leaves, which reduces the productivity enhancement. Also, stomatal density declines under elevated CO2, a phenomenon used to evaluate paleo-CO2 from fossil leaves (Royer 2001), which finally increases plant resistance to water stress and impacts the distribution.
The biotic interactions
Beyond the problems of physiology, additional complications in predicting the past or the future are associated with biotic interactions (competition-facilitation, predation-parasitism) and migration limitations. The ranges of environmental conditions in which the species are able to thrive (fundamental niche) are modified by these biotic interactions. Species could also be absent in suitable conditions owing to dispersal limitations. SDMs include both, since they straightforwardly and statistically reflect the species-distribution sample used for their computation. This explains their ability to reproduce the present distribution, but also the challenge in predicting the past or the future. Indeed, SDMs rely on the hypothesis that biotic interactions and dispersal limitations are temporally constant. With species, DVMs reflect more the fundamental niche because the environmental thresholds limiting plant growth are derived from extreme supported values (Raghunathan et al. 2019). Obtaining the realized niche distributions requires long computation times with other plants to allow for competition for light and water to equilibrate.
Moreover, when making past or future projections, both modeling approaches produce new areas of climatic suitability but are rarely able to determine whether these areas could be reached by the organisms from their initial range. A first approach consists of using cellular automaton constraining cell occupancy of the new suitability areas with dispersal factors (Engler and Guisan 2009). The second approach is the coupling, with the plant models, of mechanistic models of seed dispersal by wind or animals. The main difficulty may be the discrepancy between the scales of the processes, since the dispersal model works for individual plants, while the resolution of plant models is typically on the order of at least several kilometers. Both methods could be used with DVMs or SDMs but data are lacking particularly for validation.
In conclusion, for achieving reliable reconstructions of paleovegetation, current models could be improved. However, it is mandatory to develop spatio-temporal series of data to allow for robust validation of these models.
affiliations
1Unit for Modeling of Climate and Biogeochemical Cycles, UR SPHERES, University of Liège, Belgium 2Behavioural Biology Unit, UR SPHERES, University of Liège, Belgium
contact
Louis François: louis.francoisuliege.be
references
Cheddadi R et al. (2017) Front Ecol Environ 5: 114
Engler R, Guisan A (2009) Divers Distrib 15: 590-601
Kattge J et al. (2020) Glob Change Biol 26: 119-188
Maclean IMD (2019) Glob Change Biol 26: 1003-1011
Pinaya JLD et al. (2019) Sci Rep 9: 17912
Raghunathan N et al. (2019) Reg Environ Change 19: 219-232
Royer DL (2001) Rev Palaeobot Palynol 114: 1-28
Snell RS et al. (2014) Ecography 37: 1184-1197
Thuiller W et al. (2009) Ecography 32: 369-373
Van Der Sleen P et al. (2015) Nat Geosci 8: 24-28
Laura Parducci
Considerable advances during the last decade in DNA sequencing technology and bioinformatics have enabled in-depth study of the genome from a larger number of ancient samples derived from a larger variety of substrates and environments. In particular, extraction and analysis of ancient DNA from lake sediments has provided important clues regarding the evolution of past environments in relation to climate change. This information is essential for understanding the importance of climate and plants' dispersal ability in determining their distributional ranges, and for predicting the response of plants to ongoing climate change.
Ancient lakes
Ancient lake sediments store biological, chemical, and physical information that allow for a detailed reconstruction of past environmental and climatic changes. Biological micro- and macrofossil remains, combined with adequate chronologies, provide not only information on changes in patterns, structure, and diversity of past ecosystems, but can also be used to reconstruct past temperature and precipitation. Despite a wealth of information on past environmental and climatic changes that has been obtained from lake sedimentary records during the past decades, paleoecologists are aware that fossil assemblages represent only a tiny fraction of all the organisms that existed at a certain time in the past (due to e.g. post-mortem processes, differential decomposition, or depositional changes). In addition, each paleoecological method has its specific limitations (e.g. diatoms may partly be dissolved; high pollen producers obscure the abundance of other plant species; some species are better preserved than others in sediments).
Large-scale sequencing data from lakes
Recent advances in ancient DNA (aDNA) analyses now make use of large-scale sequencing technologies, which parallelize the sequencing process and produce millions of sequencing reads simultaneously. In this way, DNA sequenced from soils offer an unprecedented opportunity to unravel a complementary and larger spectrum of plant taxa compared to those identified by micro- or macrofossil analyses alone (Taberlet et al. 2018). They also allow identification of plants at lower taxonomic levels than conventional paleoecological proxies (Willerslev et al. 2014; Pedersen et al. 2016; Parducci et al. 2019). However, DNA from soil mainly represents taxa growing a few meters from the sampling point (Edwards et al. 2018).
 |
|
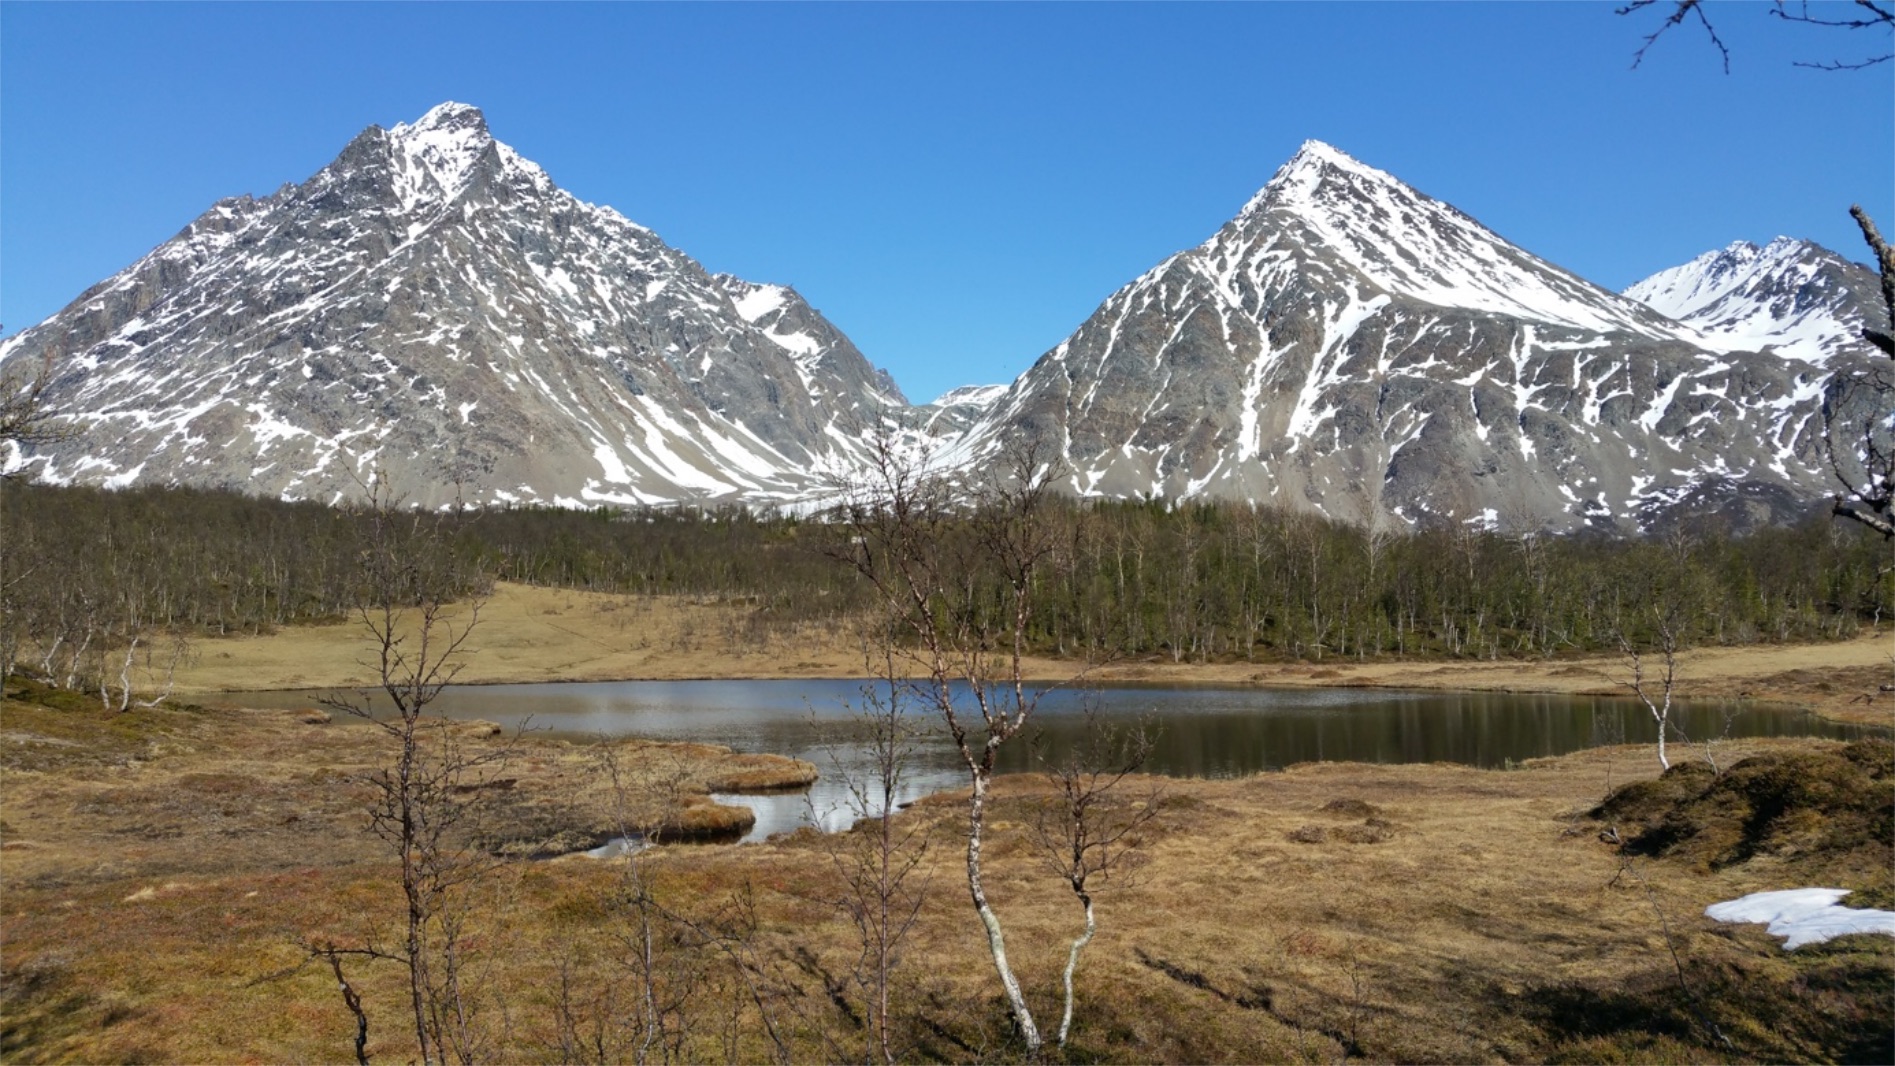
Figure 1: Rundvatnet, Lyngen, Tromsø, Norway (Photo credit: Inger Greve Alsos). |
Lakes, on the other hand, have large catchment areas and recent studies have suggested that plant aDNA from lacustrine sediments is a more powerful tool for paleo floristic reconstruction (Parducci et al. 2017; Giguet-Covex et al. 2019). In particular, sediment records from small lakes are excellent archives for molecular studies, as the effects of disturbances are low and seem to represent the surrounding terrestrial environment well (Fig. 1). As such, aDNA studies of lake sediments have the potential to revise and complement our understanding of how plant species and communities responded in the past to long- and short-term environmental changes. At the species level, this allows us to assess the effect of climate change over hundreds of generations, while at the community level it permits the investigation of the structure of ancient communities (dominant versus rare species) and their correlation with temperature, precipitation, and biotic interactions. This information is essential for understanding the importance of climate and dispersal ability of plants in determining past ranges and for predicting the response of ranges to ongoing and future climate changes.
Plants' responses to climate
There are several examples of questions that can be addressed by using aDNA analyses from lakes to tackle issues related to plants' responses to climate and that can help us understand what we can do in the face of future changes. One in particular is the question concerning the Reid's paradox of rapid migration of plants (Reid et al. 1899). This is the observation that the speed of forest recolonization process after the last Quaternary glaciation (from ca. 12 cal. kyr BP) is faster (115–550 m/yr; Feurdean et al. 2013) than it would be expected, based on life histories and ability to transport seeds and fruits of the species involved (Clark et al. 1998). Fast recolonization can be explained by rare long-distance dispersal events mediated by birds and wind and promise well for future populations suggesting that plants can do so again in response to global warming, but alternative explanations need to be investigated thoroughly.
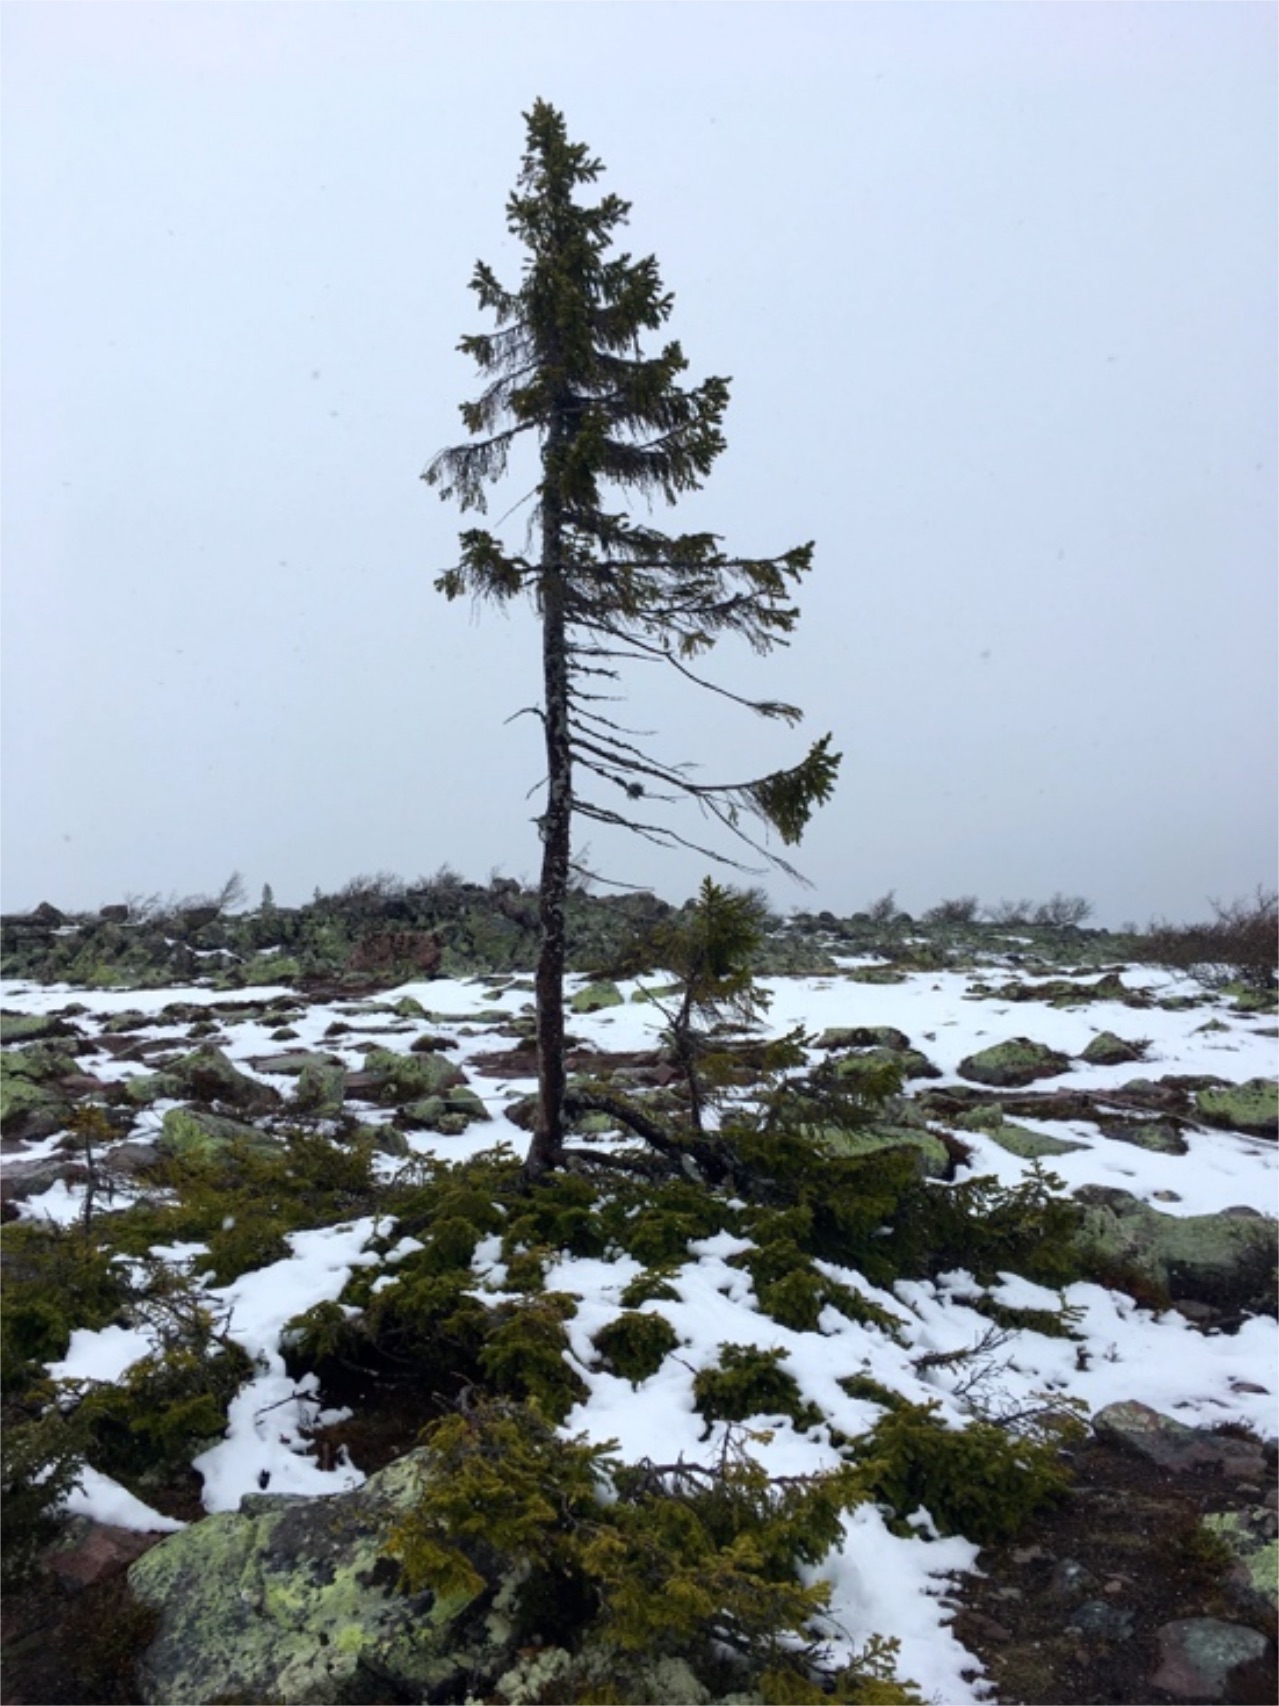
One alternative explanation, though controversial (Tzedakis et al. 2013), is that cold-tolerant tree species survived at high latitudes in small isolated microrefugia and recolonized locally once the ice retreated (Stewart et al. 2010). Recently, several lines of evidence based on fossil analysis, species distribution modeling, and phylogeographical surveys have been used to propose the existence of these small microrefugia at northern latitudes in the Northern Hemisphere (e.g. Napier et al. 2019). In Scandinavia, in central Sweden, several megafossils of mountain birch (Betula pubescens Ehrh. ssp. tortuosa (Ledeb.) Nyman), Norway spruce (Picea abies (L.) Karst.), and Scots pine (Pinus sylvestris (L.)) have been recovered earlier than expected (14, 11, and 11.7 kyr BP, respectively; Kullman 2002), and in the same region today, hundreds of clonal P. abies trees are growing with plant material under their root systems dated up to 9.5 kyr BP (Fig. 2). The early presence of tree species at high latitudes suggests either an early Holocene arrival or survival during the last glaciation. These hypotheses were tested using aDNA extracted from Norwegian lakes, and the genetic findings showed that spruce trees were present in Norway during the late glacial and the early Holocene (Parducci et al. 2012), leaving open, however, the question of their origin.
Plant survival under changing climates
These findings question traditional views on survival, resilience, and spread of cold-tolerant trees as a response to climate changes, and although restricted to specific regions and taxa, they are relevant to paleoecological studies worldwide. The ability of trees to survive at high latitudes has important implications for the response of forests to future climate changes and is particularly important for conservation and forest breeding programs interested in identifying genetic resources and provenances with traits related to survival under changing climates.
 |
|
Figure 2: Old Tjikko is a 9,550-year-old Norway spruce clone, located on Fulufjället Mountain in the Dalarna province of Sweden. The visible part of the tree is less than 100 years old but is the last individual of a colony of trees with a very ancient root system (Photo credit: Laura Parducci). |
A first implication is the limited dispersal ability of certain forest tree species, which in turn implies that factors like geographical accessibility from glacial refugia and history are important constraints in species distribution (Svenning et al. 2008), and may act strongly as diversity predictors together with climate. It also implies that we cannot expect forests to simply track the forecasted 21st century climatic changes as suggested by several ecological niche modeling studies.
A second important implication is that postglacial migration rates based on pollen records require revision and should not be used alone to predict tree-range shifts in future modeling-based scenarios. Lower postglacial migration rates imply also that trees tolerate climatic changes better than previously assumed.
The scale of climate changes predicted for the next century is comparable to the scale of warming during the Holocene (several degrees Celsius depending on the region), but the rate of change is forecasted to be much faster (IPCC 2014). Recent modeling studies based on general circulation and vegetation models have suggested that rates of future climate changes require plant migration rates even faster than those observed in the fossil record, and hence may drastically reduce biodiversity by selecting for highly mobile and opportunistic plant species. However, the ability of certain species to tolerate changing climates and survive in northern refugia may mean that some catastrophic projections based on these models (Thuiller et al. 2005) might be overstated.
A final important implication for conservation is that northern populations may have preserved locally genotypes and genes best adapted to changing climatic conditions that are worth protecting. If trees only migrated from the south, the adaptation we see today to changes in temperature and photoperiod must have occurred over a relatively short time (the Holocene or the last ~13,000 years), and is based on "standing genetic variation" present in the southern macrorefugia, since this is a faster process than adaptation based on new mutations.
New directions of plant aDNA research
Despite early challenges, plant aDNA research now offers the opportunity to detect hidden plant diversity and a complementary spectrum of fossil remains than those identified by traditional paleoecological analyses alone. In addition, new sequencing technologies have recently significantly changed the direction of plant aDNA research and we have moved from the analysis of a few chloroplast loci to the study of entire nuclear and organelle genomes. This has already provided important information for plant evolution, adaptation, conservation, crop breeding, and food security (Estrada et al. 2018). However, the aDNA field cannot work alone. Collaborative studies between researchers with different backgrounds (geologists, paleoecologists, archeologists, and molecular ecologists), as well as acknowledgment and discussion of the results from complementary disciplines, is not only a recommendation, but a requirement in this rapidly growing research field.
affiliation
Department of Environmental Biology, La Sapienza University of Rome, Italy, and Department of Ecology and Genetics, Uppsala University, Sweden
contact
Laura Parducci: Laura.Parducciuniroma1.it
references
Clark JS et al. (1998) BioScience 48: 13-24
Edwards ME et al. (2018) Holocene 28: 2006-2016
Estrada O et al. (2018) Nat Plants 4: 394-396
Feurdean A et al. (2013) PLoS ONE 8: e71797
Giguet-Covex C et al. (2019) Sci Rep 9: 14676
IPCC (2014) Pachauri RK, Meyer LA (Eds) Climate Change 2014: Synthesis Report. IPCC, 151 pp
Kullman L (2002) J Biogeogr 29: 1117-1124
Napier JD et al. (2019) Ecography 42: 1056-1067
Parducci L et al. (2012) Science 335: 1083-1086
Parducci L et al. (2017) New Phytol 214: 924-942
Parducci L et al. (2019) Front Ecol Evol 7: 189
Pedersen MW et al. (2016) Nature 537: 45-49
Reid C (1899) The Origin of the British Flora. Dulau, 236 pp
Stewart JR et al. (2010) Proc Biol Sci B 277: 661-671
Svenning J-C et al. (2008) Ecography 31: 316-326
Thuiller W et al. (2005) Proc Natl Acad Sci USA 102: 8245-8250
Inger G. Alsos1, M.E. Edwards1,2 and C.L. Clarke2
Preserving biodiversity requires knowledge of the processes that underlie geographical patterns of species' distribution and sustain diverse communities over long periods of time. Studies of modern and ancient DNA may provide new insight into these processes.
The fate of the NW European biota during the last glacial period has been debated for almost 150 years. While the consensus in the 1960s was that at least the arctic-alpine elements of the flora survived in small, coastal, ice-free areas or on nunataks in Greenland, Iceland, Svalbard, or Fennoscandia, a more recent review concluded that all extant species colonized post-glacially (Brochmann et al. 2003).
These opposing views of arctic plant history are based on different perspectives on understanding the frequency of long-distance dispersal, evolution rate, and species' ability to persist under a changing climate. Molecular tools have shed new light on this debate.
By analyzing genetic variation within present-day populations (modern DNA studies), the relationship among populations in different geographical areas can be established. Further, based on the amount and spatial structure of genetic diversity, modern molecular data can also be used to infer areas of glacial persistence (i.e. where there is high genetic diversity and/or distinct genetic markers) and the direction of postglacial dispersal (Avise 2000). More recently, advances in the use of ancient DNA have greatly increased our ability to detect past species' distributions and responses to climate changes.
 |
|
Figure 1: (A) Post-glacial dispersal routes of arctic plants within the North Atlantic region based on amplified fragment length polymorphism fingerprinting studies of 25 species (Alsos et al. 2015). Red dots indicate potential glacial survival of single species (Alsos et al. 2015; Westergaard et al. 2019), whereas green shading indicates the main focus regions. Note that the dispersal routes in most cases are not along the shortest distance, which would be expected if dispersal was a random process. Thus, dispersal agents such as sea-surface circulation (B; blue = cold water, red = warm water) or birds (C; migration routes for geese species (blue) and snow bunting (red)) may have aided dispersal. Red dots indicate potential glacial survival of single species (Alsos et al. 2015; Westergaard et al. 2019), whereas green shading represents the main focus areas. |
Lessons learned from studies of modern DNA
Studies of modern DNA have greatly advanced our knowledge of past dispersal. For example, genetic fingerprinting of 17 widespread arctic plant species throughout their current distributional range showed that the main barriers to dispersal were the Ural Mountains, the Greenland Ice Sheet, and the Atlantic Ocean, plus the lowland areas between the Alps and the Scandinavian Mountains (Eidesen et al. 2013). Alsos et al. (2015) extended the dataset to 25 species and used this in combination with floristic studies to infer the main dispersal routes in the north Atlantic region (Fig. 1).
These data show that long-distance (300-1000 km) dispersal in this region was frequent. In contrast, long-term isolation and evolution, as indicated by unique genotypes and high levels of genetic diversity for some species in some areas, appears to have been uncommon. Thus, current data indicate that postglacial dispersal may have been extensive while glacial survival was rare (Alsos et al. 2015; Westergaard et al. 2019). However, studies of modern DNA only give a relative age of past events and may overlook processes such as extinction of lineages or repeated dispersal. Recent advances in ancient sedimentary DNA have great potential to fill this knowledge gap (Parducci et al. 2017).
Combining modern DNA data with species' distributions may enable an estimation of genetic consequences of climate change on arctic plants in the past (Pellissier et al. 2016) and projection of future scenarios (Alsos et al. 2012). Past changes in species' ranges were associated with a genetic bottleneck effect: a shift in species' distribution by 1000 km is associated with an average loss of 21% of the genetic diversity. All species, even common ones, are expected to lose part of their current range as a consequence of ongoing global warming. This range loss is expected to cause loss of genetic diversity, with herbs lacking berries or other adaptations for long-distance dispersal being especially at risk.
What can we learn from studies of ancient DNA?
Ancient DNA can provide direct evidence for the occurrence of a plant species at a given site and time in the past and thus greatly improve our ability to reconstruct past glacial refugia and dispersal routes. While past presence of a given species may be indicated by the presence of macrofossils (e.g. Binney et al. 2009), arctic-alpine plant species are often poorly represented due to variable preservation; furthermore, they are often under-represented in pollen records because the majority of taxa are insect-pollinated, having poor pollen productivity and transport characteristics (Birks 2008).
 |
|
Figure 2: The ancient sediment DNA record from Lake Bolshoye Shchuchye shows the survival of arctic-alpine plants during a period when the climate was warmer, and shrubs (light green shaded bar) and trees (dark green shaded bar) expanded (modified from Clarke et al. 2019). Each square represents one occurrence of the plant taxon, with a blue color ramp used to indicate how many of the eight replicates per sample the taxon was detected within. |
Calibration studies have demonstrated that sediment DNA comes from within the local catchment area (Alsos et al. 2018) and that pollen is not likely to be a source of sediment DNA (Sjögren et al. 2017). Ancient DNA extracted from sediments (sedaDNA) has proven a useful new tool for reconstructing past plant community composition, particularly with regard to arctic-alpine herbs (Willerslev et al. 2014), and it can significantly augment information derived from pollen and plant macrofossil records (Alsos et al. 2016; Parducci et al. 2017).
In a recent study of a long (24 m) sediment core from Lake Bolshoye Shchuchye in the Polar Ural Mountains of Arctic Russia, Clarke et al. (2019) assessed how the diversity of the arctic-alpine flora fared through large-magnitude climate changes over the past 24,000 years using sedaDNA analysis. The lake catchment has supported a typical arctic-alpine community over the last 24,000 years, while there has also been diversification through time to include shrub-tundra and boreal-forest taxa (Fig. 2).
The sedaDNA record provides robust empirical evidence of the persistence of the arctic-alpine flora through a long period of environmental change, including the postglacial expansion of woody taxa and a period of forested conditions between 9,000 and 4,000 cal. years BP, when summer temperatures were likely warmer than present. The diversity and abundance of arctic-alpines did, however, decline as soon as shrubs expanded, suggesting that in a future warming scenario, loss of competition-sensitive arctic-alpine species may occur long before the establishment of boreal forest. Nevertheless, most of the plants that were present during the last glacial period, including all of the arctic-alpine plants, are still found in the region today, suggesting resilience to climate changes.
The Lake Bolshoye Shchuchye record highlights the conservation significance of spatially heterogeneous mountain landscapes such as the Polar Urals. Plants adapted to extreme conditions can be at high risk from climate change; arctic-alpine plants, in particular, could "run out of space" as they are out-competed by expansion of woody vegetation. However, heterogenous landscapes may provide a range of habitats for different taxa and a variety of communities. This in turn confers resilience in the face of climate change.
Future perspectives
As more sites are analyzed for ancient DNA, we can greatly increase our knowledge of the past distribution of arctic-alpine plants. This will allow us to more effectively combine studies of modern DNA with ancient DNA records to determine past species' distributions and model likely future ones. Direct analyses of genotypes through time and space are now possible, allowing for the study of the genetic consequences of climate change (e.g. as applied to macrofossils of silver fir, Abies alba; Schmid et al. 2017). In the near future, similar studies based on ancient sedimentary DNA alone should be possible and potentially more widely applicable.
affiliations
1Tromsø University Museum, The Arctic University of Norway (UiT), Norway
2School of Geography and Environmental Science, University of Southampton, UK
contact
Inger G. Alsos: inger.g.alsosuit.no
references
Alsos IG et al. (2012) Proc R Soc Lond B 279: 2042-2051
Alsos IG et al. (2015) AoB Plants 7: plv036
Alsos IG et al. (2016) Holocene 26: 627-642
Alsos IG et al. (2018) PLoS ONE 13: e0195403
Avise JC (2000) Phylogeography: The History and Formation of Species, Harvard University Press, 464 pp
Binney HA et al. (2009) Quat Sci Rev 28: 2445-2464
Birks HH (2008) Plant Ecol Divers 1: 135-146
Brochmann C et al. (2003) Taxon 52: 417-450
Clarke C et al. (2019) Sci Rep 9: 19613
Eidesen PB et al. (2013) New Phytol 200: 898-910
Parducci L et al. (2017) New Phytol 214: 924-942
Pellissier L et al. (2016) J Biogeogr 43: 461-470
Schmid S et al. (2017) Methods Ecol Evol 8: 1374-1388
Sjögren P et al. (2017) New Phytol 213: 929-941
Gentile F. Ficetola1,2 and Pierre Taberlet2,3
Genome skimming and environmental DNA extracted from lake sediments are increasingly important to measure genetic diversity, and to understand how environmental changes affected species distribution through time. Here we describe how genome skimming on the current geographic distribution of species can be combined with the analysis of lake sediments, to perform unprecedented tests of phylogeographic hypotheses, and reconstruct past refugia and colonization routes.
DNA sequencing has greatly improved over the past 15 years, and next generation sequencing is transforming DNA analysis (van Dijk et al. 2014). Today, the most powerful sequencer, the NovaSeq 6000 (Illumina), is able to produce up to 40 billions of sequence reads of 250 nucleotides in a single experiment. Such sequencing power induces a complete change in assessing genetic diversity of wild species. It is now affordable to analyze a significant portion of the genomes instead of looking only at a few target regions. Here, we will focus on two approaches linked to next generation sequencing: genome skimming and environmental DNA analysis; both can greatly improve our understanding of how environmental changes have impacted the genetic diversity of species.
Genome skimming (Coissac et al. 2016; Dodsworth 2015; Straub et al. 2012) corresponds to the sequencing of random DNA fragments of the genome, at a sequencing depth that does not allow for the assembly of the whole nuclear genome, but that allows for the assembly of all repetitive DNA such as, for plants, the chloroplast genome, the nuclear ribosomal DNA, and possibly the mitochondrial genome. Genome skimming has been proposed as an extension of the current barcoding approach (Coissac et al. 2016), as it provides much more information for DNA-based species identification and for phylogenies (e.g. Malé et al. 2014).
The analysis of environmental DNA extracted from lake sediments allows us to reconstruct the variation of species distribution over the last few millennia, and is becoming a widely used approach for assessing past communities, either targeting a single species, or dealing with all species from a taxonomic group such as plants or mammals (review in Bálint et al. 2018; see also Giguet-Covex et al. 2014; Pansu et al. 2015). Although most of the studies performed so far focused on individual species or on higher-level taxonomic entities, lake sediments could also be a source of information at the intraspecific level, provided that the appropriate DNA markers are available.
Combining genome skimming and environmental DNA
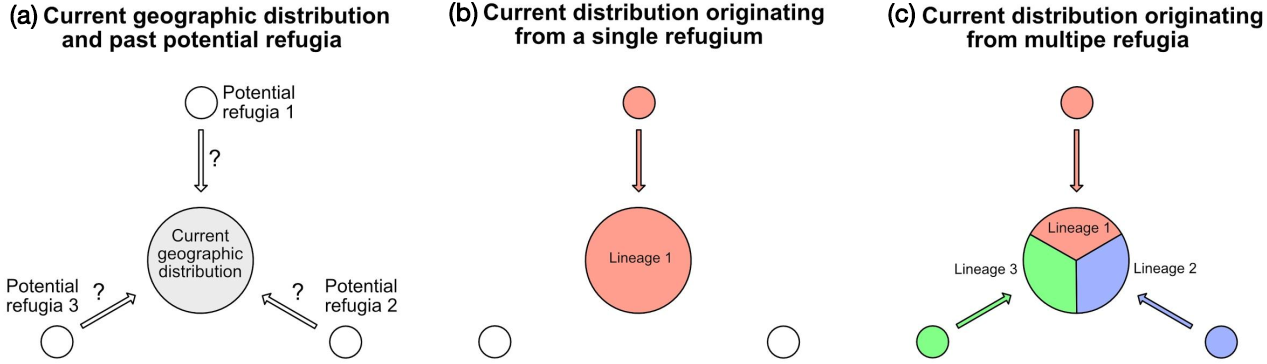
By combining genome skimming on the current geographic distribution of a target species, and the analysis of lake sediments, it is now possible to test intraspecific phylogeographic hypotheses, i.e. to find past refugia and colonization routes. Figure 1 illustrates this approach, which has not yet been implemented but has a great potential for understanding past distributions of different lineages within a species.
 |
|
Figure 1: Hypothesis testing, based on phylogeographic data and lake sediment analysis in different potential refugia (see text for details). |
The first step must start with a phylogeographic study of the considered species. This consists of collecting representative samples over the whole current distribution (Fig. 1a). After DNA extraction, these samples are sequenced on a next generation platform, using a genome skimming approach, to produce about one gigabase of sequence, e.g. about seven million sequence reads, each 150 base pairs long. Based on these sequences, for each sample, the whole chloroplast DNA and the whole nuclear ribosomal DNA can be assembled. The comparison of these sequences among all samples reveals the phylogeographic structure of the species, showing the geographic distribution(s) of either a single homogeneous lineage (Fig. 1b), or different lineages (Fig. 1c).
The second step is the identification of genetic markers that unambiguously characterize each lineage, with the goal of being able to recover these markers from lake sediments. This requires choosing markers that are as short as possible, with conserved flanking regions where PCR (polymerase chain reaction) primers, i.e. short DNA sequences that are necessary for DNA amplification, can be anchored. As genome skimming provides the sequences of the whole chloroplast DNA and of the ribosomal DNA, it is quite easy to find such short diagnostic markers for each lineage.
The third step consists of collecting lake sediments, within both the current geographic distribution and potential refugia. The different cores must be precisely dated, and DNA extraction is carried out from many core slices. The objective is to test for the presence or absence of the different lineages at different times and locations. This presence is determined using the DNA markers designed in step two. These markers are amplified via PCR and sequenced on next generation sequencers. The results should allow us to reconstruct the history of each lineage very precisely, including past presence in areas where it later disappeared, and colonization routes towards the current geographic distribution.
Perspectives
All the technologies and methodologies for carrying out the above approach have already been available for more than five years. Surprisingly, not a single paper has taken the opportunity to combine them for resolving important controversies concerning potential refugia, postglacial colonization routes, and the evolution of intraspecific genetic diversity. For example, the re-establishment of flora in Scandinavia is controversial, opposing the "tabula rasa" versus the "nunatak" hypotheses (Brochmann et al. 2003). The "tabula rasa" hypothesis suggests that after the last glacial maximum, Scandinavia was only recolonized from the South. Alternatively, the "nunatak" hypothesis opens the possibility for a recolonization from non-glaciated cryptic refugia in Scandinavia such as Andøya Island (Parducci et al. 2012). The recolonization of Scandinavia could be tested by collecting lake sediments in the plain south of the ice sheet during the last glacial maximum. If for many species the same lineages are found in Scandinavia and in these plains where they are currently absent, this will be in favor of the "tabula rasa" hypothesis. On the contrary, if the lineages in these plains about 20 thousand years ago are different from the ones found in Scandinavia, this will support the possibility of northern cryptic refugia.
Climatic oscillations occurring since the Pleistocene have shaped the present day biodiversity of plant and animal species; yet, human-driven global changes are leading to unprecedented changes of species distributions and diversity. Understanding the processes that have determined the present-day genetic diversity can also help us understand the biotic response to ongoing environmental changes, and identify appropriate management strategies.
affiliations
1Department of Environmental Science and Policy, Università degli Studi di Milano, Italy 2Laboratoire d'Ecologie Alpine (LECA), CNRS, Université Grenoble Alpes, France 3The Arctic University of Norway (UiT), Tromsø Museum, Norway
contact
Gentile Ficetola: francesco.ficetolagmail.com
references
Bálint M et al. (2018) Trends Ecol Evol 33: 945-957
Brochmann C et al. (2003) Taxon 52: 417-450
Coissac E et al. (2016) Mol Ecol 25: 1423-1428
Dodsworth S (2015) Trends Plant Sci 20: 525-527
Giguet-Covex C et al. (2014) Nat Commun 5: 3211
Malé P-JG et al. (2014) Mol Ecol Resour 14: 966-975
Pansu J et al. (2015) Mol Ecol 24: 1485-1498
Parducci L et al. (2012) Science 335: 1083-1086
Rachid Cheddadi1 and Keith D. Bennett2
Glacial refugia in the temperate Northern Hemisphere proved to be havens for present ecosystems' diversity. The modern microrefugia, where isolated populations of threatened plant species are persisting, might well play a similar role for preserving future biodiversity.
Classical and cryptic glacial refugia
Plant species' potential range (fundamental niche) is delineated by a climate space that they often occupy only partially (realized niche). Generally, temperate plant species tend to occupy a wider geographical range when climate is warm and wet, and retract when climate is cold and dry. During the last glacial period, cold-tolerant herbs dominated the mid- to high-latitude landscape in both hemispheres and the range of most temperate tree species was reduced to discrete populations until the climate became warmer and wetter during the Holocene, which allowed them to expand.
The persistence or survival of plant species in restricted areas during past unfavorable climate time spans is a fundamental ecological pattern that has contributed to shaping the modern range of species, ecosystem composition, and species' genetic diversity. Restricted areas in the Northern Hemisphere such as in the Mediterranean basin, known today as "classical southern refugia" (Bennett and Provan 2008), played a major role in the survival of European plant species during the last glacial period. These geographically restricted and scattered areas located at lower latitudes offered local (micro)climates that were suitable for plant species. However, other refugial spots designated as "cryptic refugia" have been identified at higher latitudes than the classical southern refugia in the Northern Hemisphere, namely in Sweden (Parducci et al. 2012), Beringia, North America (Provan and Bennett 2008), and northern China (Fan et al. 2016).
 |
|
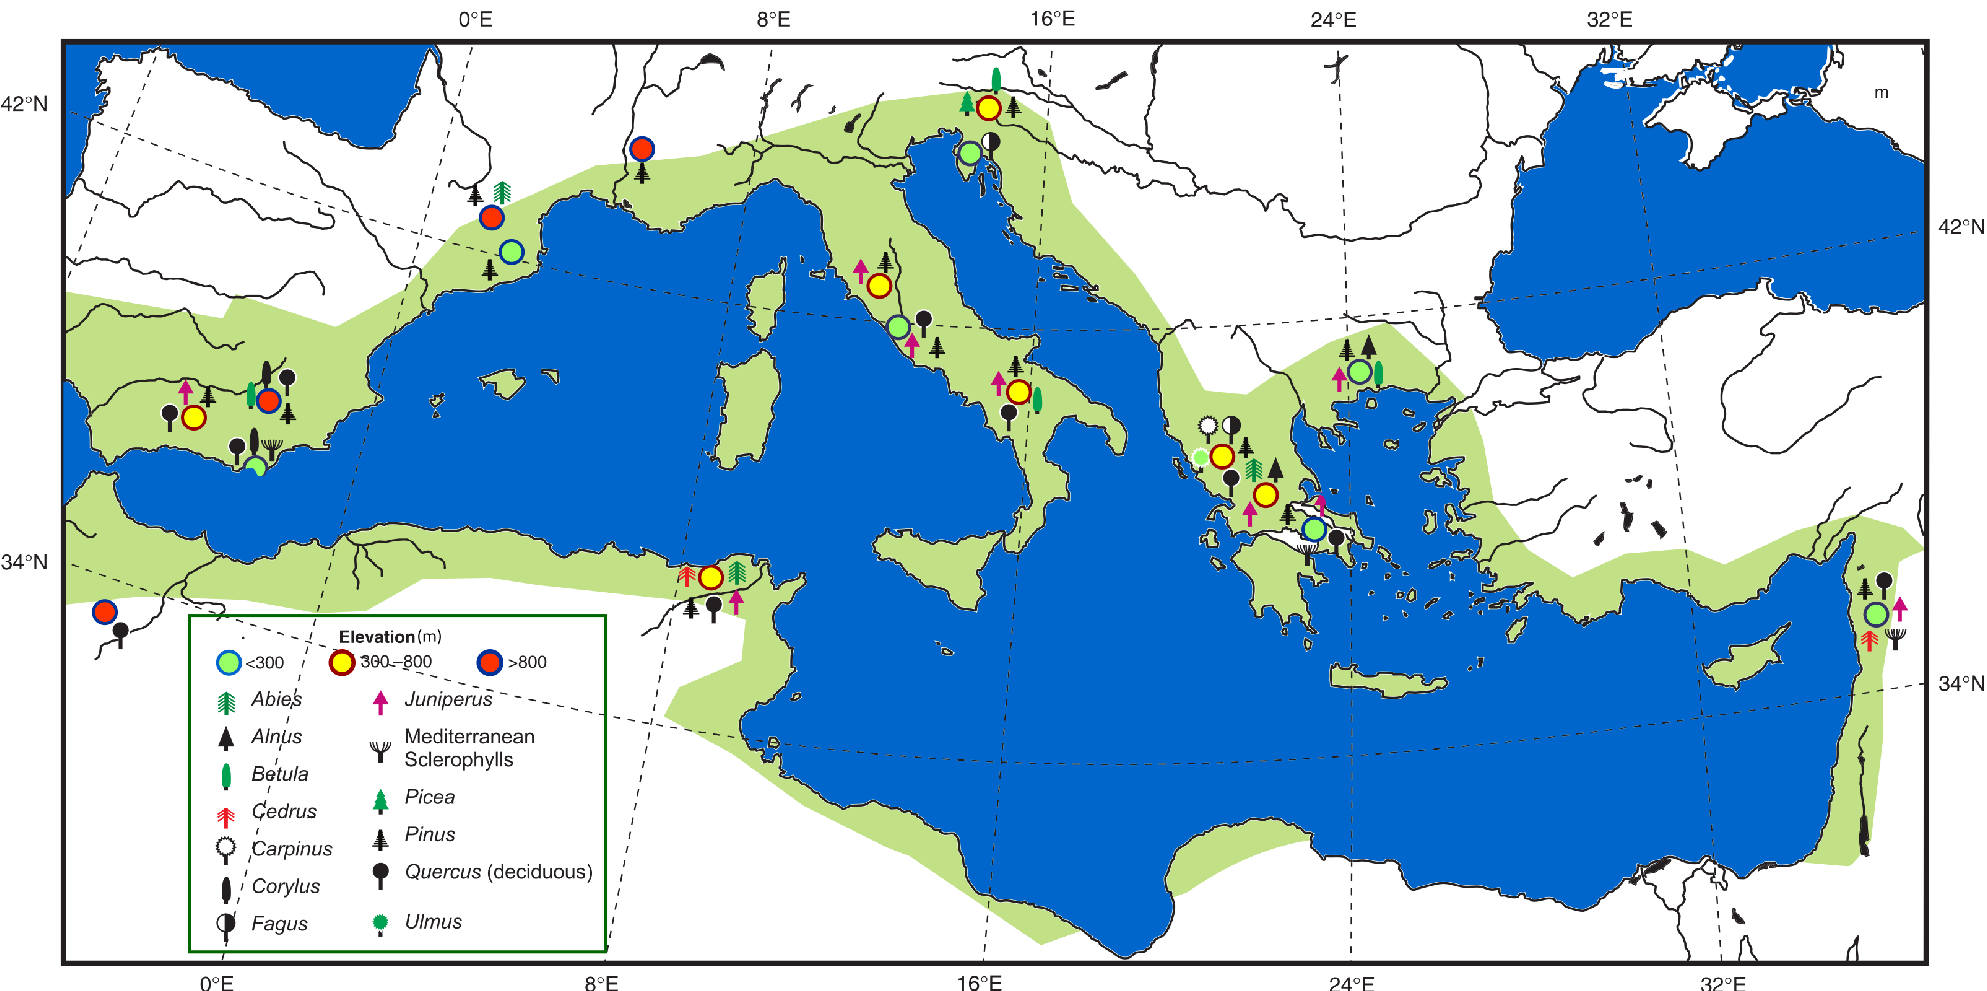
Figure 1: Inferred last glacial refugia (circles) of a few tree populations (symbols) from fossil pollen records collected from wetlands located at different elevations (modified from Tzedakis 2009). The green area represents roughly the present Mediterranean hotspot of biodiversity according to Myers et al. (2000; modified). Note that most of the identified glacial refugia are within the biodiversity hotspot. |
Refugial areas where plant species were present continuously over the last climatic cycle under different extreme climates (Tzedakis et al. 2002), or since just the last glacial period until today under the modern fast climate change, are of primary importance for potential future species' conservation (Morelli et al. 2016). In southern Europe, scholars have shown that there is a strong relationship between the location of the classical glacial refugia and the modern areas where high biodiversity and endemism rates are measured (Fig. 1).
Where are the refugia?
Locating past refugia is also important for evaluating species' migration rates, hindcasting the species' range change through time using different climate scenarios, and testing and validating process-based vegetation models for competition between species. These species and/or vegetation-type models help to evaluate species' diversity loss under different future climate scenarios, their capacity for migrating, and the potential future suitable habitats for their conservation.
During a change in global climate, the areas where local microclimates are found to play the role of refugia for the persistence of plant species over several centuries or millennia (Tzedakis et al. 2002). This could be the case during either glacials or interglacials (Bennett and Provan 2008). Refugial areas are often located in mountainous regions (Bennett et al. 1991), which offer a wide range of landscapes, geological substrates, and exposure time to the sun. Mountains with high rugosity may provide more microrefugial areas (Rull 2009) for plant species under regionally less favorable climate than areas with smoother landscapes (Valencia et al. 2016). In addition, mountains represent a much faster option for species to compensate for global climate change by migrating easily up or down towards cooler/warmer and/or wetter/drier altitudes. The Föhn winds can raise temperature and bring moisture from the adjacent seas to mountains, which may create local microclimates. By migrating 1000 m in altitude, a species may compensate for a temperature change between 6 and 10°C, depending on the latitudinal location of the mountain (Bennett et al. 1991). Today, under ongoing global warming, many species persist as scattered populations in mountainous areas because of the existence of offset suitable microclimates. The estimated velocity of temperature change is lower within tropical and temperate mountain biomes than in lowlands (Loarie et al. 2009). Species respond individualistically to climate change, and their estimated past migratory rates seem to be slower than the modern climate change. Survival of many species under the ongoing climate change may rely on their ability to persist in some modern microrefugia (Rull 2009) with favorable (micro)climatic conditions.
Glacial refugia and species' modern genetic diversity
Refugial areas in the past can be identified from paleorecords and genetic data (Fig. 2). Fossil remains, such as pollen grains and macro-remains, allow for the identification of the occurrence of a species and its time of persistence at a site or the area surrounding the study site. Phylogeographers and paleoecologists have worked together over the past few decades to identify glacial refugia and to reconstruct the pathways of species expansion, based on species haplotypes using different genetic markers (Petit et al. 2003) along with extended sets of fossil pollen records.
 |
|
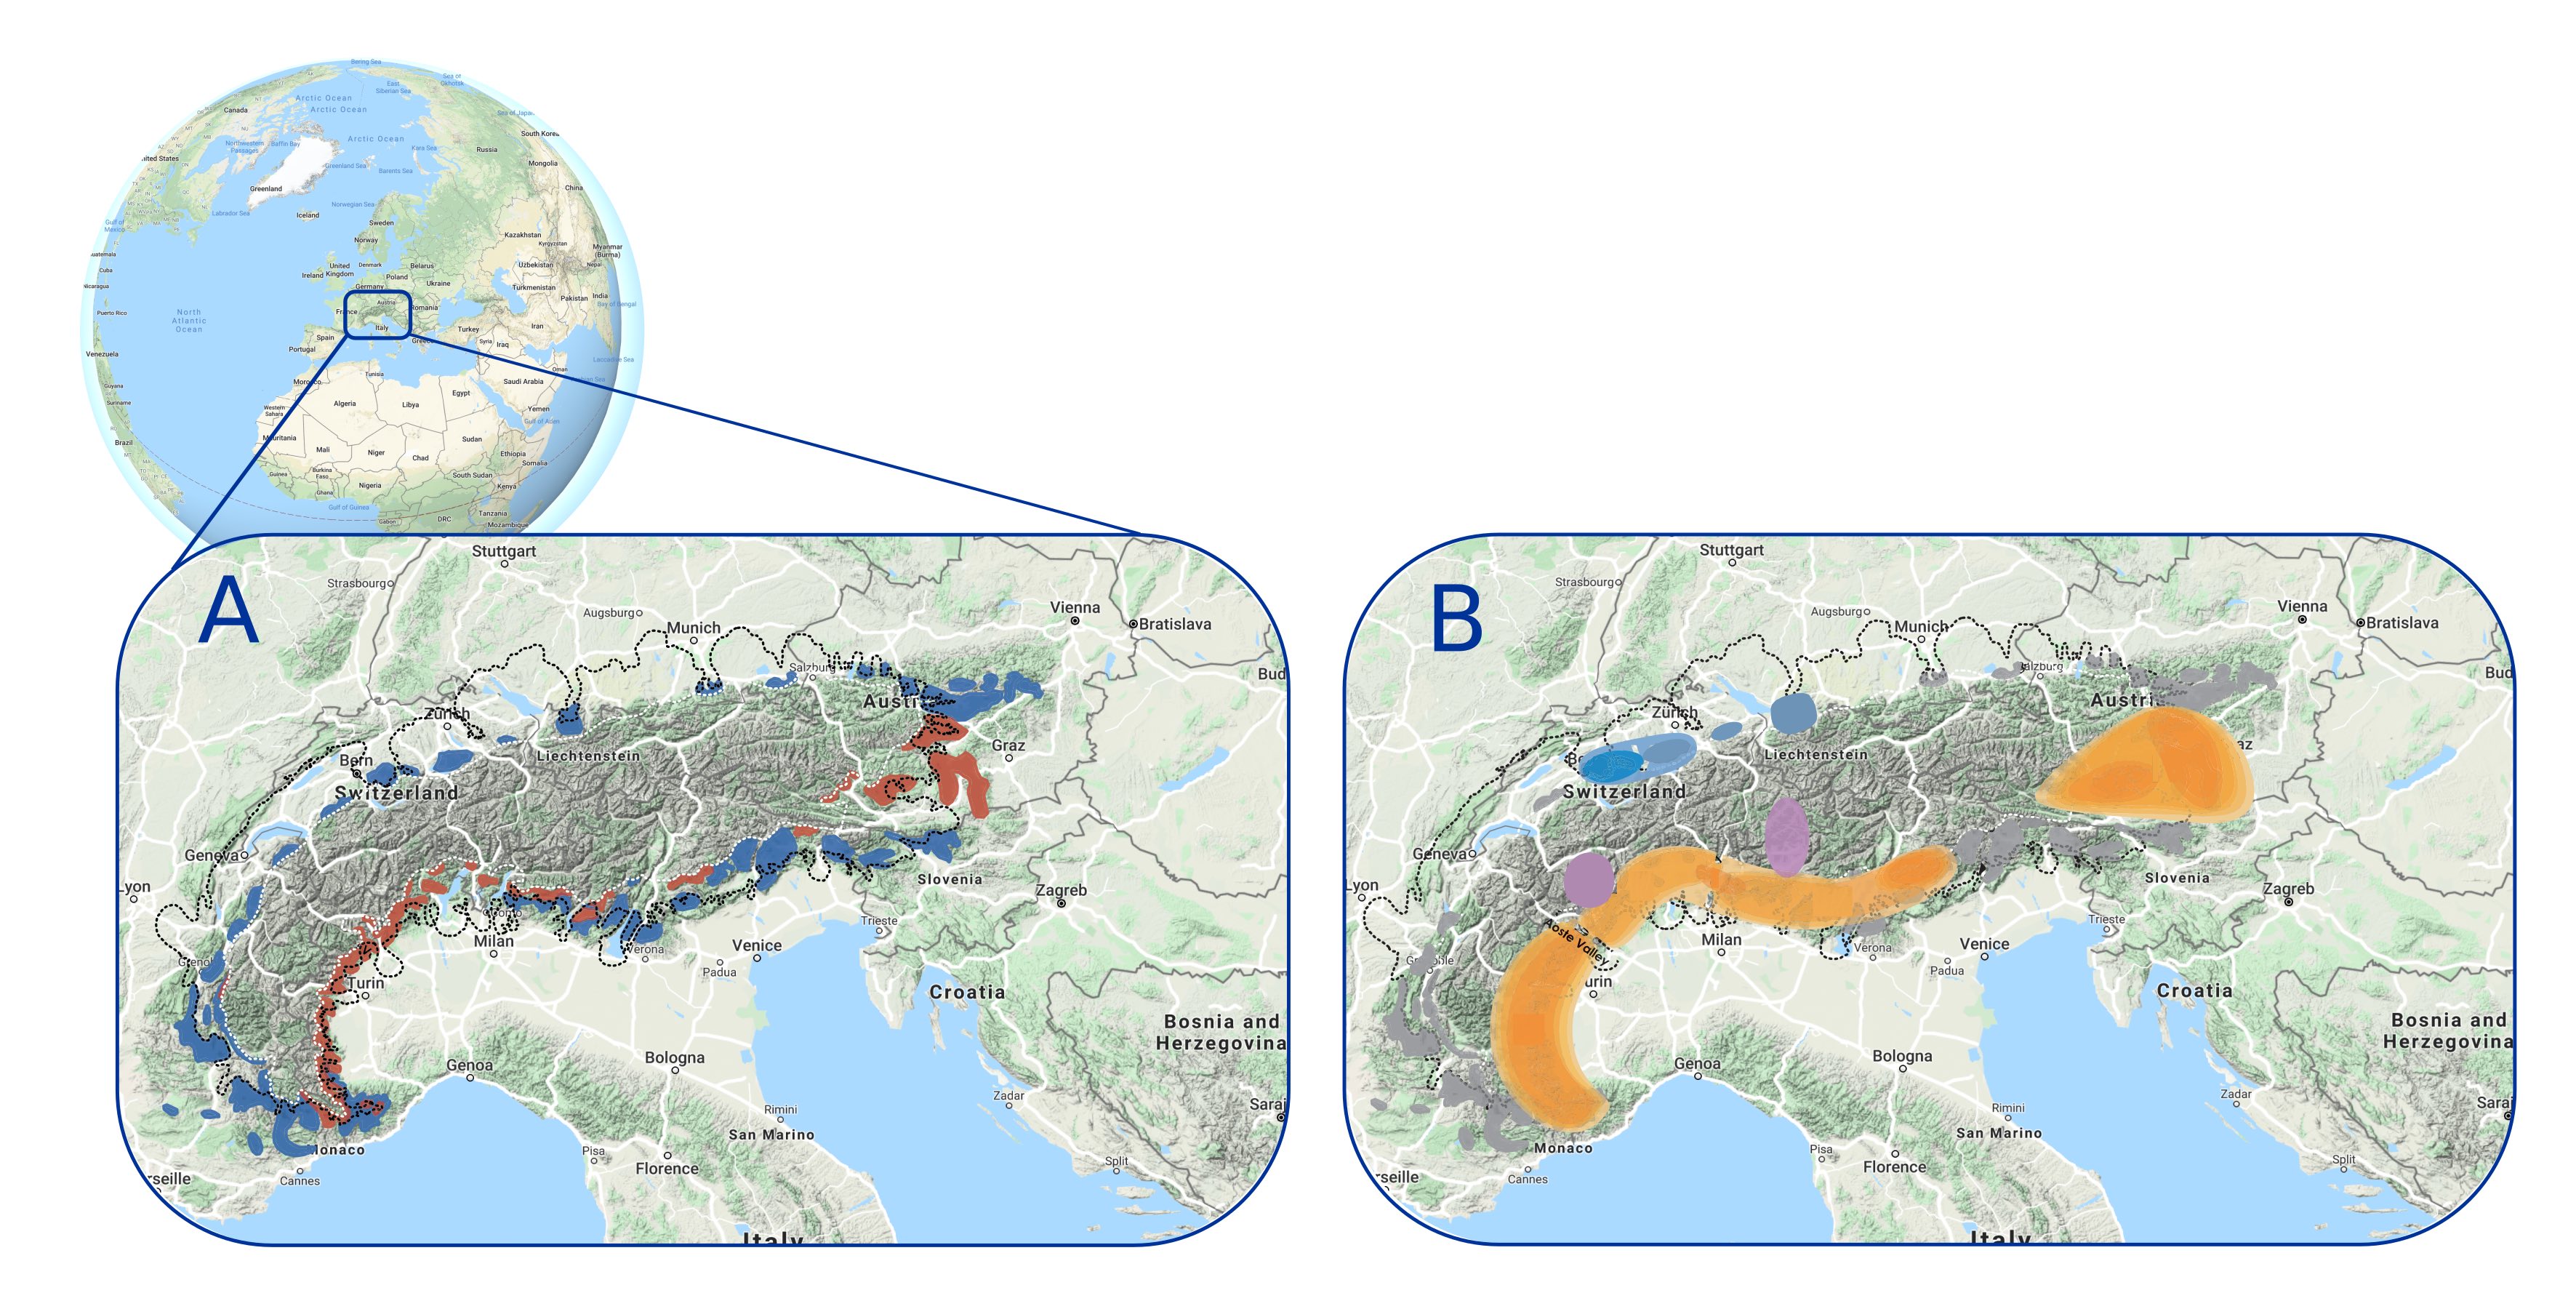
Figure 2: Multiple glacial microrefugia of different plant species around the Alps identified from (A) fossil records on different bedrocks (blue: calcareous; red: siliceous) that have been confirmed by (B) phylogeographic analyses, which provide more details about the different types of refugia (different colors on the map) and the species diversity that they shelter (modified from Schönswetter et al. 2005). |
For many species, microrefugia with stable microclimates that are offset from the global climate may represent the only alternative to extinction if their migration rate is lower than the velocity of climate change (Hannah et al. 2014). Modern microrefugia may have an important role in preserving species under the ongoing global climate change (Cheddadi et al. 2017) and may represent a reservoir of biodiversity. Genetic diversity would be maintained within these isolated populations and perhaps even improved if there is a genetic flow between different populations.
Phylogeographic studies have highlighted the role played by the glacial refugia for species survival and their legacy in shaping their modern genetic diversity (Petit et al. 2003). Depending on the range size and the time span over which plant species remain isolated in a refugium, there may be a local genetic shift of the species. The genetic drift during this time may lead to reduced genetic polymorphism in different geographically scattered refugia. Consequently, differences between DNA haplotypes could appear in the different refugia, which may be traced back by genotyping individuals of the same species collected over its modern range.
Potential contribution of modern refugia to future biodiversity
Genetic studies have shown that glacial refugia do not necessarily harbor the most diverse populations. However, the postglacial crossing of different lineages of the same species during the recolonization process from multiple refugia produced the most genetically diverse populations (Petit et al. 2003). Thus, even if the genetic diversity of a population tends to decrease over time when a species remains isolated in a refugium, its persistence into multiple scattered refugia may contribute to conserving and improving future species diversity. The future persistence of different species under the ongoing global warming and the preservation of biodiversity might well depend on the identification of potential modern refugia for threatened species and the protection of these refugia from anthropogenic degradation.
Identifying and protecting microrefugial areas may represent an additional option for species conservation (Hannah et al. 2014) which is likely to be one of the most efficient scientific solutions for species conservation with a reasonable social cost, especially in areas where local public resources are low.
affiliations
1ISEM, University of Montpellier, CNRS, IRD, France 2School of Geography & Sustainable Development, University of St. Andrews, UK
contact
Rachid Cheddadi: rachid.cheddadiumontpellier.fr
references
Bennett KD et al. (1991) J Biogeogr 18: 103-115
Bennett KD, Provan J (2008) Quat Sci Rev 27: 2449-2455
Cheddadi R et al. (2017) Front Ecol Evol 5: 1-15
Fan D et al. (2016) Sci Rep 6: 31044
Hannah L et al. (2014) Trends Ecol Evol 29: 390-397
Loarie S et al. (2009) Nature 462(7276): 1052–1055
Morelli TL et al. (2016) PLoS ONE 11: 1-17
Myers N et al. (2000) Nature 403: 853-859
Parducci L et al. (2012) Science 335: 1083-1086
Petit RJ et al. (2003) Science 300: 1563-1565
Provan J, Bennett KD (2008) Trends Ecol Evol 23: 564-571
Rull V (2009) J Biogeogr 36: 481-484
Schönswetter P et al. (2005) Mol Ecol 14: 3547-3555
Tzedakis PC et al. (2002) Science 297: 2044-2047
Zhuo Zheng1, K. Huang1, Q. Wan1 and R. Cheddadi2
The onset of the evergreen forest expansion throughout subtropical eastern Asia took place progressively from the tropical latitudes after the Younger Dryas and ended between 8000 and 6000 years BP.
Eastern subtropical Asia (ESA) is a territory about the size of Europe and corresponds to a vast ecotonal area between the tropical and the northern temperate climate systems. ESA underwent a tremendous biome turnover over the last glacial/interglacial transition (Ni et al. 2010). Today, the evergreen broad-leaved (EBL) biome prevails in ESA, and during the last glacial period it was dominated by a fragmented deciduous broad-leaved (DBL) vegetation (Yue et al. 2012) over the mountain landscapes and open vegetation at lower altitudes (Yu et al. 2017). The EBL biome (known as laurophyllous forest), currently the most widely distributed biome in eastern Asia, extends from about 22°N to 33°N under a monsoon regime.
The replacement of the scattered DBL biome by a denser and more continuous EBL forest took place during the transition from the last glacial period to the warmer and wetter Holocene. However, there are major questions concerning the timing, dynamics, and causes of such a large biome transformation over the subtropical belt in China (Zhao et al. 2009). Different and concomitant climate variables, such as an increase of temperature (during both summer and winter) and/or the seasonal changes in precipitation related to an increased monsoon (Zhou et al. 2016) after the glacial termination, might have favored the spread of the EBL at the expense of the deciduous biome. Fossil records collected in ESA can provide us with useful information about such a large-scale biome change.
Timing and dynamics
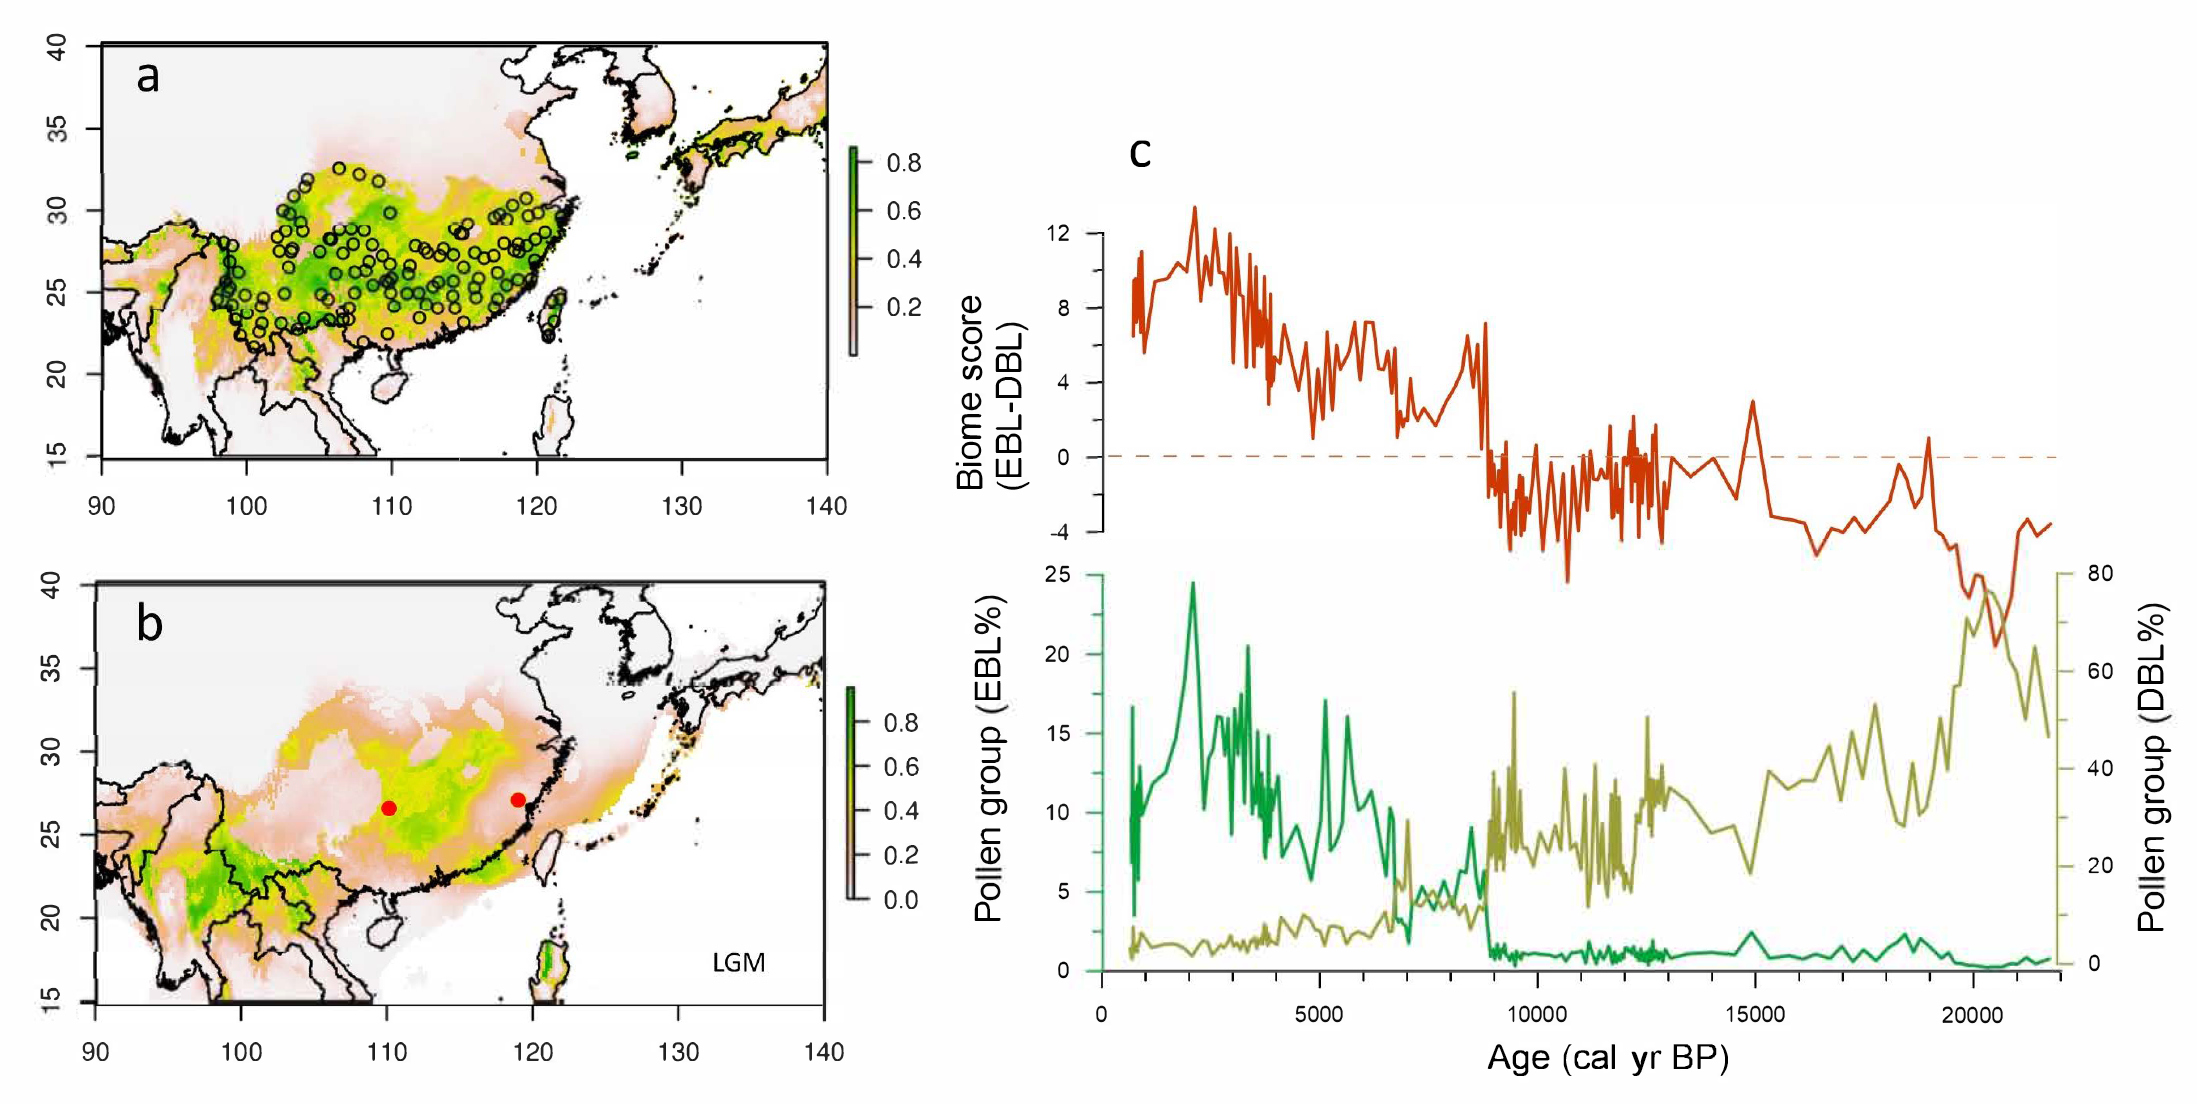
Although the forest was not the only dominant ecosystem during the last glacial period, the DBL forest covered a large part of southern China that is dominated today by the EBL biome (Fig. 1a and 1b). A high-resolution pollen record collected in the center of the subtropical zone shows that until the last Heinrich event (H1, dated to around 16.5 thousand years before present, kyr BP) the main forest populations in southern China were composed of deciduous rather than evergreen species (Fig. 1c). However, the complete absence of the EBL biome north of 24°N during the Last Glacial Maximum (LGM; Ni et al. 2010) seems to not be coherent with the phylogeographic studies that suggest some species composing the EBL biome survived during the LGM in situ in numerous northern refugia (Fan et al. 2016).
 |
|
Figure 1: Potential distribution of evergreen broad-leaved forest simulated by species distribution model for the (A) present-day and (B) LGM compared with (C) pollen groups and biome scores from a coring (SZY) collected in southeast China. The random selected points (circles) in (A) are extracted from digitized present-day evergreen broad-leaved forest distribution. |
The postglacial expansion of the EBL biome over the subtropical zone primarily began at the Bølling/Allerød (B/A) warming (around 14 kyr BP), but more substantial replacement occurred after the Younger Dryas (YD) cooling (12.7-11.5 kyr BP). A major massive migration took place from the southern tropical belt of eastern Asia rather than from the putative scattered northern refugia, suggested by the phylogeographic studies. In the western high Tibetan plateau, within the subtropical zone, despite a different vegetation type during the LGM (sclerophyllous mixed oak and conifer forests), there is also simultaneously a profound biome change over the altitudinal belts (Wang et al. 2018; Nishimura et al. 2014; Cheng et al. 2018). The transitional turnover from DBL to EBL after the YD event is depicted in most records located north of the Tropic of Cancer. This post-YD large biome turnover originated in the northern tropical boundary of eastern Asia and progressively spread throughout all of subtropical China. The northernmost front of the EBL was reached around 8-7 kyr BP and corresponds to the northern limit of the East Asian Summer Monsoon. The progressive timing of the EBL expansion inferred from pollen records shows a significant delay with the speleothem oxygen isotope records from Dongge and Hulu caves from southern China.
The DBL/EBL biome turnover was quite synchronous over the same latitude, with a progressive time-lag from south (11.5 kyr BP) to north (8-6 kyr BP; Cheng et al. 2018; Zhou et al. 2016). Pollen data from the semi-arid belt in northern China under the influence of the summer monsoon also indicate a delayed expansion of the EBL biome during the early to mid-Holocene, which confirms the south-north progressive recolonization of the DBL biome over the ESA (Wang and Feng 2013).
The time-transgressive propagation of the EBL across the subtropical landscape stabilized during the mid-Holocene around 4 kyr BP. Pollen data relate an opening of the vegetation and the expansion of cultivated species towards the end of the Holocene that is probably related to a combined effect of a reduction of the annual amount of precipitation along with an increase in the regional anthropogenic disturbances. The modern range of the EBL biome in the subtropical zone seems to be constrained by the superimposition of the effects of increasing human activities (slash and burn, cultivation, etc.) and climate change.
The causes
The pattern of subtropical forest changes in response to the postglacial climate warming has drawn extensive attention (Lee and Liew 2010). The strengthening of the summer monsoon over the last post-glacial warming has been considered as the main factor driving large vegetation changes in eastern Asia (Zhou et al. 2016). Several speleothem records provide strong evidence for the strengthening of the monsoonal system (Dykoski et al. 2005); however, an increase in precipitation (annual and/or seasonal) may not be sufficient to explain a complete replacement of the DBL by an EBL biome at the scale of ESA.
 |
|
Figure 2: Standardized differences between EBL and DBL biome scores in the subtropical zone (pastel blue), reconstructed MAT based on biomarker result (brGDGT) from core SZY (circles), simulated annual mean temperature of Greenland (blue; Liu et al. 2014), and in top figure, oxygen isotopic curves from the stalagmite records of Dongge and Hulu caves (light brown) and summer insolation in 30ºN. |
The temperature reconstruction based on biomarkers and fossil pollen data reveals a threshold determined by the mean annual temperature for the EBL/DBL biome transformation during the early Holocene (Wang et al. 2017; Fig. 2). Today, the mean minimum temperature seems to be a more accurate or appropriate climate variable for defining the distribution boundary of EBL forest in China. The annual and winter temperature isotherms (15-16°C and 6-8ºC, respectively) delineates the northern limit of modern EBL forests in the subtropical mountains and corresponds to the transition between the DBL and EBL biomes. The temperature simulated by a transient model is consistent with the observed trend (Liu et al. 2009), and the combined data of biome transformation across the overall zone is coherent with the progressive increase in temperatures, which is controlled by winter insolation and seasonality during the last deglaciation to mid-Holocene. Thus, besides the strengthening of the monsoon, the turnover of EBL/DBL forest was probably extremely sensitive to both the seasonal amplitude and the long-term increase in winter and annual temperature during the early Holocene (Fig. 2).
The temperature increase and the seasonal change in precipitation are related to several global climate variables. The gradual increase in the sea surface temperature in the warm pool of the South China Sea and the northward cross-equatorial atmospheric heat transport during the early to mid-Holocene have played an important role in heating up the subtropical continent. Besides the impact on the monsoonal system, the energy delivered to China increases de facto the inland temperature. The fact that the EBL forest recolonization was halted by the last Heinrich event and then the Younger Dryas, both of which are marked cool periods recorded in the North Atlantic, tends to suggest that global ocean circulation was also an important driving mechanism for the temperature changes over China, therefore impacting its large vegetation changes.
In conclusion, ESA underwent a large biome turnover that is clearly related to the post-glacial global climate changes, and the expected future climate changes will probably impact it again as was the case in the past.
Acknowledgements
This work was supported by the National Key R&D Program of China (2016 YFA0600500) and the National Natural Science Foundation of China (No. 41230101).
affiliations
1Guangdong Key Lab of Geodynamics and Geohazards, School of Earth Sciences and Engineering, Sun Yat-sen University, Guangzhou, China
2ISEM, University of Montpellier, CNRS, IRD, France
contact
Zhuo Zheng: eeszzhuomail.sysu.edu.cn
references
Cheng Y et al. (2018) Earth-Sci Rev 182: 174-185
Dykoski CA et al. (2005) Earth Planet Sci Lett 233: 71-86
Fan D et al. (2016) Sci Rep 6: 31044
Lee C-Y, Liew P-M (2010) Palaeogeogr Palaeoclimatol Palaeoecol 287: 58-66
Liu Z et al. (2009) Science 325: 310-314
Liu Z et al. (2014) Quat Sci Rev 83: 115-128
Ni J et al. (2010) Palaeogeogr Palaeoclimatol Palaeoecol 289: 44-61
Nishimura M et al. (2014) Palaeogeogr Palaeoclimatol Palaeoecol 396: 75-92
Wang M et al. (2017) Chem Geol 463: 94-102
Wang W, Feng Z (2013) Earth-Sci Rev 122: 38-57
Wang X et al. (2018) Quat Sci Rev 192: 236-248
Yu SH et al. (2017) Quat Sci Rev 157: 114-128
Yue YF et al. (2012) Palaeogeogr Palaeoclimatol Palaeoecol 365-366: 115-123
Past and future contexts for climate and water-cycle variability, and consequences for the biosphere
Pascale Braconnot1 and Françoise Vimeux1,2
The Earth's climate has changed in the past and is expected to continue to change in the future with implications for water resources, ecosystems, and human societies. Climate models are now reaching a level of complexity that makes them more useful to understand the linkages between climate and environment, and to connect global and regional changes.
Temperature projections for the 21st century
Human activity, by modifying the atmospheric composition (greenhouse gases and aerosols) and the land surface (agriculture and deforestation), affects the Earth's energetics. Future perturbations are characterized by Representative Concentration Pathways (RCPs) indicating the amount of energetic change by 2100. Simulations with climate models able to predict the evolution of the climate system on timescales of seasons to decades and longer have become references to inform decisions regarding adaptation and mitigation. Temperature projections exhibit robust spatial patterns and consistent upward evolution over the 21st century. They all show a gradual increase in temperature everywhere, regardless of which RCPs are considered, with more pronounced changes in high latitudes than in the tropics. In all projections, the magnitude of changes after 2050 depends on the future greenhouse gas emissions and changes in land use. Note that uncertainties associated with model output for a given emission pathway are actually lower than the uncertainties concerning the evolution of human activities.
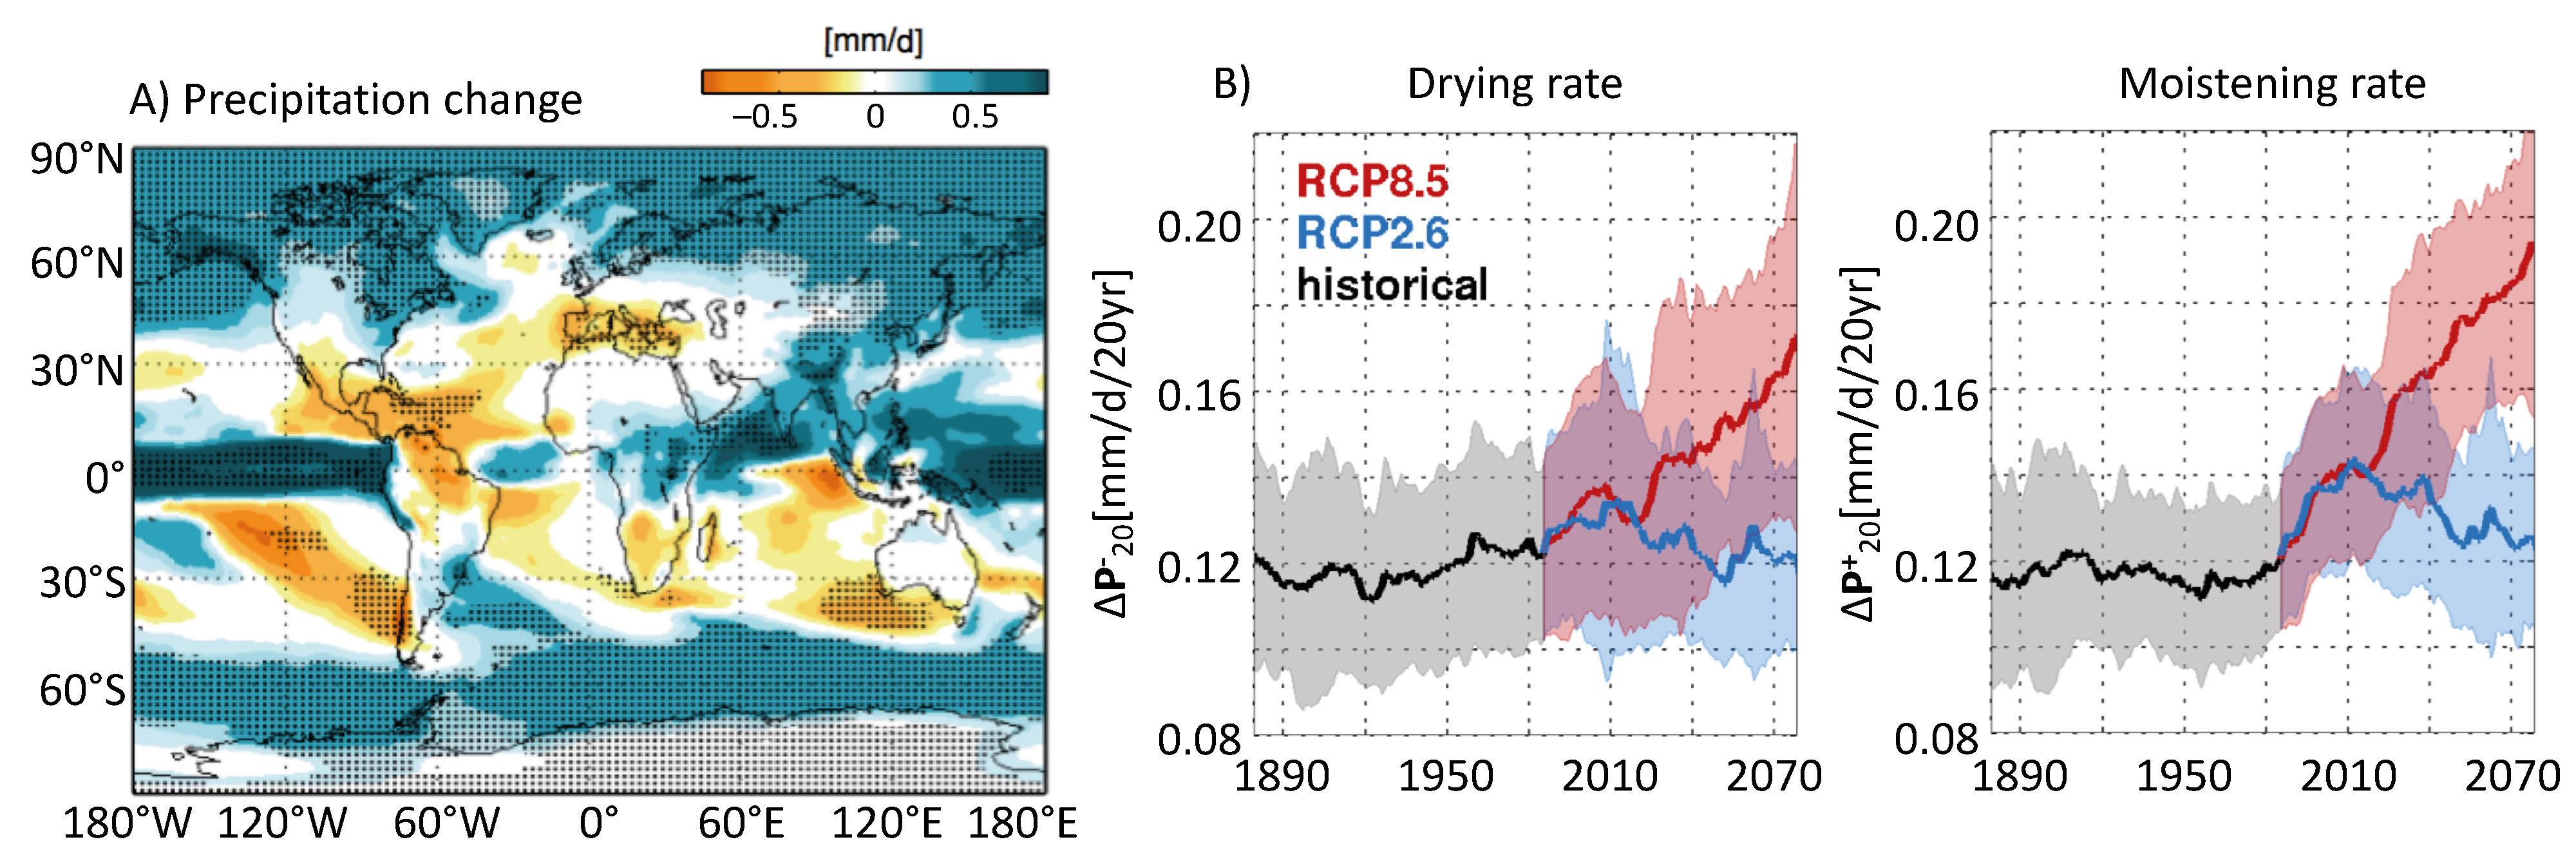 |
|
Figure 1: (A) Multi-model ensemble mean of the absolute change of annual mean precipitation (in mm/day) between the end of the 20th century (1986-2005) and the end of the 21st century (2081-2100) for RCP 8.5. When dots are drawn, 90% of models agree on the sign of the change and the later exceeds at least two times the internal variability; (B) Multi-model ensemble mean evolution of the drying (left) and moistening (right) precipitation rate (mm/day per 20 years). The number of runs is given in parenthesis. Adapted from Chavaillaz et al. (2016). |
Precipitation projections for the 21st century
While water vapor increases in the atmosphere by about 7% for each degree Celsius of warming, following the Clausius-Clapeyron thermodynamic law, global precipitation is estimated to increase at a lower rate of about 3%/°C (Collins et al. 2013). This precipitation trend simulated over the 21st century is associated with large spatial disparities as shown in Fig. 1a (Chavaillaz et al. 2016). Globally, we observe an increasing contrast between regions of moisture convergence and divergence: additional precipitation is expected in tropical and mid-to-high latitudes (up to 50% more compared to the end of the 20th century), whereas less precipitation is simulated in subtropics. This arises from atmospheric thermodynamics and changes in the atmospheric dynamics that lead to the counterintuitive result of increasing heat export from the tropics associated with a slowdown of the Hadley-Walker circulation (Chadwick et al. 2013). Some regions also exhibit more pronounced trends, such as the drying of the Mediterranean area (by as much as 30% less precipitation).
Still positive, the rate of precipitation changes throughout the 21st century clearly depends on the RCPs (Fig. 1b). Under RCP 2.6 (the strongest mitigation pathway), the rate of the precipitation change stabilizes both in drying and moistening regions, and even reduces at the end of the 21st century to return to historical values. In contrast, for RCP 8.5 (considered as the "business-as-usual" emission pathway), the rate of the precipitation change continuously increases during the 21st century (Fig. 1b), both in drying and moistening regions, leading to a doubling of the rate of change in mean precipitation by 2080. This reflects an acceleration of precipitation changes regardless if it is in a drying or a moistening region. As a consequence of small discrepancies between precipitation rate in moistening and drying regions (Fig. 1b), the fraction of moistening regions changes during the 21st century: under RCP 8.5, it tends to increase slightly by a few percent and to stabilize in the mid-21st century whereas under RCP 2.6, moistening region area clearly decreases by almost 10% by 2080.
In addition, as stated in the 5th Assessment Report of the IPCC (IPCC 2013), there are regions and climate variables for which model projections remain particularly uncertain. This is the case for tropical precipitation projections, which are critically important for assessing the social impacts of climate change (tropical areas are among the most populated and the most vulnerable regions of the world), but for which no consensus emerges among climate models (Meehl and Washington 2012). The large spread among models illustrates important differences in climate sensitivity and biases (Dufresne and Bony 2008). Over tropical continents, not only the magnitude of the changes differs among models but also their sign (e.g. Douville et al. 2006; Sun et al. 2007; IPCC 2013).
As a consequence of climate change, vegetation is also expected to evolve during the 21st century with a potential decrease of the forest cover (e.g. in the tropics) or increase (e.g. in high latitudes). As a consequence of the expected climate change, some plant species are also expected to expand northward and towards higher altitudes with a modified growth season (e.g. Harsch et al. 2009; Savage and Vellend 2015; Pecl et al. 2017). Furthermore, simulations with interactive vegetation have confirmed the observed biophysical feedbacks associated with large-scale changes in vegetation.
Future changes in relation to past changes
These rapid changes are part of a longer history that has shaped our modern environment, and for which the major forcing was not trace gases such as CO2 but changes in the incoming solar radiation at the top of the atmosphere related to slow changes in the Earth's orbit. The current generation of global climate models, such as the one used for the future climate projections presented above, can now be used to investigate the interplay between the long-term evolution of the external forcing, temperature, precipitation, and vegetation in different regions, though still in a simplified way (Braconnot et al. 2019; Dallmeyer et al. 2020). Figure 2 illustrates this long-term evolution. The IPSL climate model was only forced by Earth's orbital parameters and trace gases, ignoring human land use, volcanism, and solar irradiance variability. As it only considers natural vegetation, results cannot be fully compared to observations in the last part of the record.
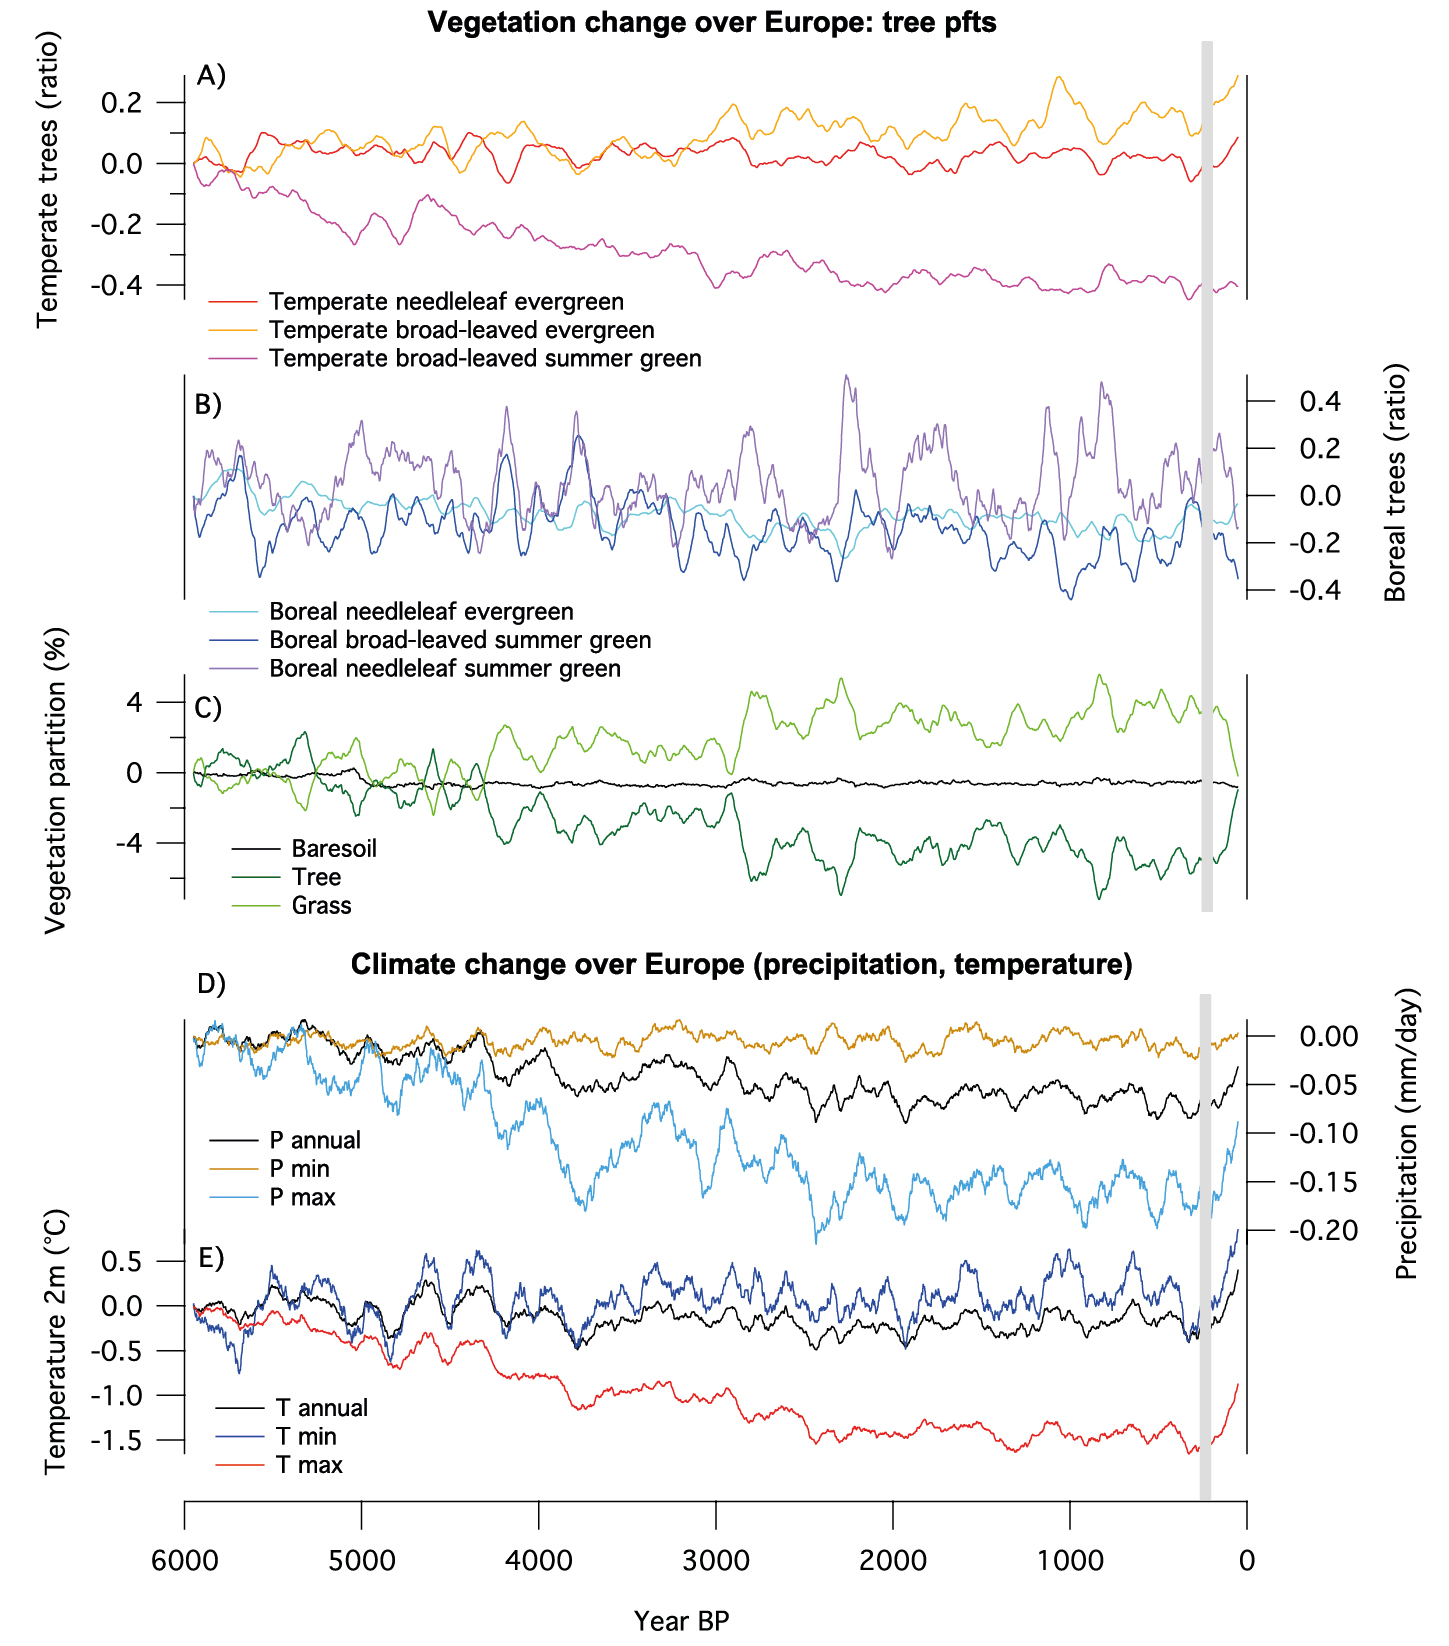 |
|
Figure 2: Evolution of climate conditions and vegetation over Europe, as simulated over the last 6000 years with the IPSL model. The different panels from top to bottom represent (A) the evolution of the temperate and (B) boreal tree fractions, expressed as a ratio to their initial cover; (C) parallel evolution of the total area (% of total land surface) covered by tree, grass, and bare soil, expressed as a deviation from the first 100-year average of the total area covered in the initial mid-Holocene state; (D) annual mean, annual monthly minimum (driest month), and annual monthly maximum (wettest month) precipitation (mm/day), and (E) annual mean, annual monthly minimum (coldest month), and annual monthly maximum (warmest month) 2-m air temperature. All curves have been smoothed by a 100-year running mean. The gray bar shows the pre-industrial period in 1750. |
Figure 2 clearly highlights the fact that despite the slow change in insolation forcing, the long-term trend in all variables is punctuated by substantial variability. The long-term temperature cooling is a direct response to the insolation forcing, associated with a simultaneous decrease of the tree fraction, which is consistent with paleo reconstructions over Europe (Davis et al. 2003; Marsicek et al. 2018; Mauri et al. 2015). These changes are associated with a long-term precipitation decrease that is well depicted in the reduction of both maximum monthly and annual mean precipitation (Fig. 2). This aridification is associated with a decrease in temperature seasonality induced by insolation and mainly driven by warmest-month temperature. The relationship between humidity, precipitation, and temperature changes discussed for future projections at global scale is only found when these variables are averaged over the Northern Hemisphere (Braconnot et al. 2019).
However, the pace of change varies with time, and the largest trends are found between about 5000 years BP and 3000 years BP. During the last 200 years of the simulation, the rapid increase of greenhouse gases (mainly CO2) induces rapid changes in climate variables and vegetation that counteract their long-term evolution; this represents about half of the signal for climate and, in the case of total tree cover, most of the signal for vegetation over Europe. This stresses the fact that the linkages between ecosystems and climate cannot simply be deduced from past trends behavior, and that major differences are expected in the interplay between climate and vegetation in the future, with many unknowns compared to past climate evolution.
Another important message is that periods of several decades or centuries are characterized by both large climate and vegetation variations. Even though most of the curves in Figure 2 exhibit similar large variations, there is no systematic correspondence in the relative magnitude and duration of the temperature and precipitation events, or between climate and vegetation fluctuations. One reason is that climate variations need to be large enough to cross a threshold and impact the environment, and that different types of ecosystems react to different thresholds. In this respect, the total tree fractions over Europe also mask different dynamics between the different tree plant functional types (pfts). The different simulated pfts provide a more dynamic view of changes in ecosystem diversity. In this simulation, only the temperate broad-leaved summer green tree pft declines with time, whereas the other pfts show a more chaotic behavior and do not systematically exhibit synchronous variability. They respond differently to the different events, depending on their sensitivity to temperature or precipitation or to specific patterns of climate events over Europe that may or may not affect their geographical range.
Even though such long simulations are still imperfect, and model biases are large and prevent detailed explanations of reconstructed changes, they highlight the different spatio-temporal scale that need to be accounted for to properly anticipate future climate change. Introduction of land use is also an important factor to better characterize the Holocene impact of human activity in addition to the rapid increase in greenhouse gases. This additional human effect is modifying regional climate characteristics (Harrison et al. 2020). Ensembles of such long simulations will soon be available to the community, providing new opportunities to understand the evolution of both the water cycle and ecosystems.
affiliations
1Institut Pierre Simon Laplace (IPSL), Laboratoire des Sciences du Climat et de l'Environnement (LSCE), Gif-sur-Yvette, France
2Institut de Recherche pour le Développement, Laboratoire HydroSciences Montpellier, France
contact
Pascale Braconnot: pascale.braconnotlsce.ipsl.fr
references
Braconnot P et al. (2019) Clim Past 15: 997-1024
Chadwick R et al. (2013) J Clim 26:3803-3822
Chavaillaz Y et al. (2016) Clim Dyn 47: 951-965
Dallmeyer A et al. (2020) Clim Past 16: 117-140
Davis BAS et al. (2003) Quat Sci Rev 22: 1701-1716
Douville H et al. (2006) Clim Dyn 26: 367-385
Dufresne J-L, Bony S (2008) J Clim 21: 5135-5144
Harrison SP et al. (2020) Geosci Model Dev 13: 805-824
Harsch MA et al. (2009) Ecol Lett 12: 1040-1049
IPCC (2013) Climate Change 2013: The Physical Science Basis. Cambridge University Press, 1535 pp
Marsicek J et al. (2018) Nature 554: 92-96
Mauri A et al. (2015) Quat Sci Rev 112: 109-127
Meehl G, Washington W (2012) J Clim 25: 3661-3683
Pecl GT et al. (2017) Science 355: eaai9214
Rachid Cheddadi1, S. Báez2, S. Normand3, D. Payne4 and P. Taberlet5,6
Past climate changes have shaped the distribution of species across the planet by impacting their dispersal abilities, their migration rates, and the ongoing competition between and among them, as well as by triggering their local or total extinctions. This, in turn, has led to major changes in community composition and to ecosystem turnovers. Ongoing climate change is affecting species as well, and will keep doing so in the future. However, the challenge that we face today is that climate change is happening much faster than in the past and exceeding the migration rates of many species, driving a need for informed management to support the natural ability of species to respond. Moreover, climate change is no longer the only important factor in determining biodiversity patterns.
Changes in diversity are driven by complex interactions between climate change and increasing human pressures, whether from large-scale political and socio-economic transformations, overexploitation and unsustainable management of natural resources, or demographics. The accelerated growth of the human population, for example, is likely to dramatically reduce and fragment the range of species' natural habitats, thereby threatening their potential for long-term persistence. In this modern context, many plant species will have to adapt locally or will become extinct because their natural dispersal to more suitable habitats will be compromised.
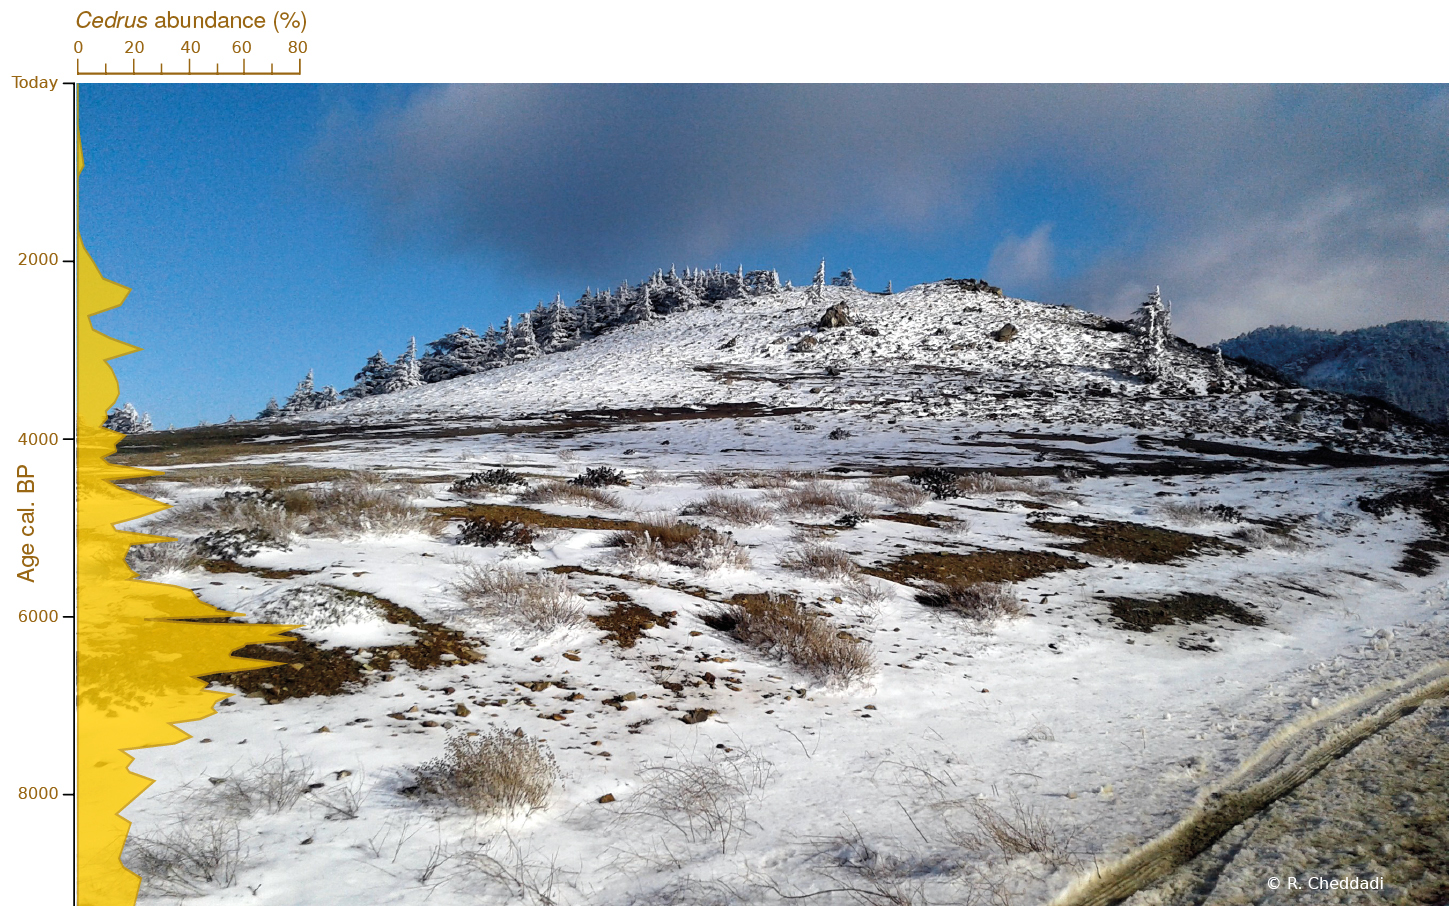 |
|
Figure 1: The fossil record shows that Atlas cedar (Cedrus atlantica), which currently is endangered, formerly comprised significantly more extended forests in the Rif Mountains (Morocco). This picture shows a relict population of the Atlas cedar at ~1800 m above sea level in the Rif Mountains. Snow still occurs in winter but the increase of winter temperature and the steady decrease of annual precipitation over the past few decades is threatening the local persistence of the Atlas cedar in North Africa. |
The evolutionary history of plants and their communities and of their response to environmental drivers started long ago and has followed various pathways. Accordingly, there are as many explanations for current patterns of diversity as there are species, and each species has a unique history among its coevals. Over geological time, certain plant species have adapted locally or migrated to more suitable habitats while others are now extinct because of their low dispersal abilities and/or reduced capacities for adaptation to new environments (e.g. the Atlas cedar in the Rif Mountains in Morocco; Fig. 1). For example, during the last glacial period, many temperate plant species persisted with low densities and/or with restricted ranges in so-called "refugia", many of which are found in mountains. Phylogeographical studies have shown that many of these glacial refugia are hotspots of genetic and species diversity that result from a high relative abundance of endemic and ancestral genes and marked genetic differentiation at the local scale.
Relicts of the past can provide us with fascinating and useful information on how species reacted to different climatic situations, which in turn could inform management strategies to protect the remaining species on Earth now and in the future. For example, fossil records contain a wide range of proxies for reconstructing past climates, species occurrences, their range of fluctuations, and their extinction through time. Accordingly, studies combining surveys of modern DNA and fossil records allow us to trace Quaternary population and range dynamics with unprecedented detail, while studies on ancient DNA extracted from geological records are providing new insights into species adaptation to environmental changes.
Models offer another way to inform management strategies and species' conservation policies. Modeling the ancient distribution of plant species illustrates potential migration pathways and refugia, and can increase our understanding of the demographic history and current genetic structure of species. However, numerous decisions and challenges accompany such modeling efforts, including the choice of modeling paradigm and algorithm, biases in algorithms and distribution data, variability in estimates of paleoclimate, means of model validation, genetic heterogeneity and model equilibrium, estimates of dispersal capacities, and our understanding of the lability of species' environmental tolerance and biotic interactions.
Management strategies and species' conservation policies can certainly be optimized through the integration of knowledge from different sources, disciplines, and timescales. However, the implementation of such strategies requires multi-scale, multi-species, and multi-disciplinary approaches to evaluate the relationship between long-term climate changes and biodiversity.
In this issue we present highlights from research on past climate changes, genetic approaches, and vegetation modeling to examine the relationship between past environmental changes and their impacts on different aspects of plant species' diversity. We then discuss how such approaches could inform conservation and management.
The articles in this issue fall into four main sections: (1) Issues related to past climate variability in terms of amplitude, velocity, and abruptness, and how they have affected where species have persisted during climatically unsuitable time periods (Braconnot and Vimeux p. 4; Zheng et al. p. 6; Cheddadi and Bennett p. 8), (2) Impacts of long-term isolation and migration of species on their genetic diversity (Ficetola and Taberlet p. 10; Alsos et al. p. 12; Parducci p. 14), (3) Models of past species' distributions and biases to modeling approaches (François and Hambuckers p. 16), and finally (4) Lessons from the past to inform plant species conservation in the future (Payne et al. p. 18; Dirk and Gillson p. 20; Sarmiento et al. p. 22; Castilla-Beltrán et al. p. 24).
affiliationS
1ISEM, University of Montpellier, CNRS, IRD, France
2Departamento de Biologia, Escuela Politécnica Nacional del Ecuador, Quito, Ecuador
3Arctic Research Centre, Aarhus University, Denmark
4Global Mountain Biodiversity Assessment (GMBA), Institute of Plant Sciences, University of Bern, Switzerland
5Laboratoire d'Ecologie Alpine (LECA), CNRS, Université Grenoble Alpes, France
6The Arctic University of Norway (UiT), Tromsø Museum, Norway
contact
Rachid Cheddadi: rachid.cheddadiumontpellier.fr