PAGES Magazine articles
Benjamin D. Stocker1, Z. Yu2 and F. Joos3,4
Reliable reconstructions of past land-use change are essential to address key challenges in understanding the role of humans in the Earth’s environmental history. Here we discuss how to integrate past carbon cycle changes within constraints of the land carbon budget.
Particular features in the ice-core CO2 and CH4 records have been hypothesized to be linked to the rise and fall of agriculture and societies (Ruddiman 2003) and have been used to serve as stratigraphic markers for the Anthropocene (Lewis and Maslin 2015). The trend reversals in atmospheric CO2 around 7000 years (7 ka) before present (present=1950 CE) and in CH4 around 5 ka BP, and the continuous increase in their concentrations thereafter, have been linked to the expansion of early agriculture, associated deforestation and CO2 emissions, and the establishment of wet rice cultivation with high CH4 emissions. The apparent downturn in atmospheric CO2 after 1500 CE falls into the period following the arrival of Europeans in the Americas and the subsequent dramatic collapse of native populations. However, these proposed hypotheses, claiming a causal link between the history of civilizations and past greenhouse gas changes, critically rest on the plausibility of land-use and land-cover change (LULC) reconstructions and the magnitude of associated greenhouse gas emissions. Several studies have put these links into question (e.g. Pongratz et al. 2009; Singarayer et al. 2011; Stocker et al. 2011).
Contrasting land-use reconstructions
Expansion of agriculture has reduced the land area covered by forest throughout much of the Holocene. Today, about a third of the Earth's land surface area is — more or less intensively — in use for agriculture. This estimate of modern land use is derived from national statistics and satellite data. However, such precise information is only available for the last few decades. Past vegetation, reconstructed from pollen records in lake sediments or bogs, have only just begun to be used for quantitative land-cover reconstructions (Editorial, this issue). Instead, reconstructions of past LULC are typically based on estimates of historical population size and assumptions on the per-capita requirement of cropland and pasture area over the Holocene. These values are highly uncertain, and the most widely used land-use reconstructions provide conflicting results (see Harrison et al., this issue).
Replacement of forests by agricultural land also affects the energy balance at the land surface, reduces evapotranspiration where trees have been replaced by crops and grasses, or increases evapotranspiration where lands are being irrigated. It further increases the surface albedo, especially in northern latitudes when snow is present. This effect has contributed to a cooling in the mid-latitudes that counteracted LULC-induced warming due to greenhouse-gas emissions in the past, and may have exacerbated cold conditions during the Little Ice Age (Betts et al. 2007). Reducing the large uncertainties in reconstructions of past LULC is therefore important to define a reliable land-surface boundary condition for climate model simulations covering past centuries and millennia, and for other simulations that use preindustrial boundary conditions (e.g. piControl, historical, abrupt-4×CO2, 1pctCO2 of CMIP6 model simulations; see Eyring et al. 2016). The boundary between preindustrial and industrial conditions is commonly set at 1850 CE (see also Harrison et al., this issue).
Land conversion also impacts carbon (C) storage in the soil. The long residence time of soil carbon entails legacy effects of past land use on the terrestrial carbon balance, even decades after land conversion. Conflicting land-use reconstructions underpin the ongoing debate about the extent and impact of preindustrial human activities on the carbon cycle and climate. However, there are two constraints that help narrow the range of possible land-use histories in the past (Stocker et al. 2017) and the influence of past LULC on climate and the carbon cycle.
Constraints on LULC histories
 |
|
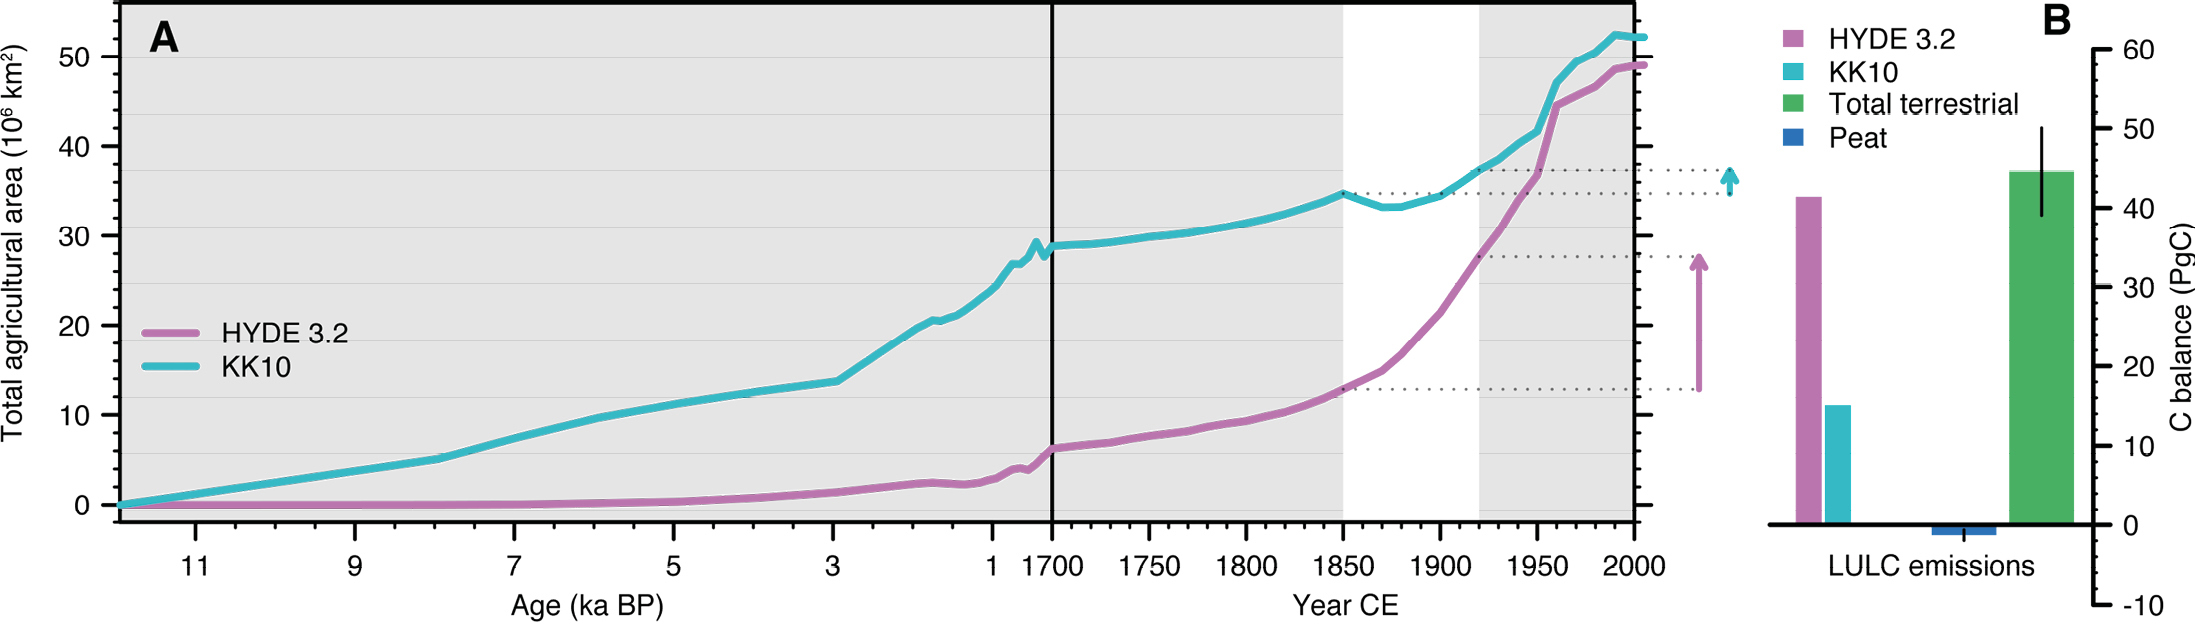
Figure 1: (A) Time series of global total land area under agricultural land use for HYDE 3.2 (Klein Goldewijk 2016) and KK10 (total of pasture and croplands in HYDE 3.2; Kaplan et al. 2009). The time axis is on a different scale before and after 1700 CE. Total expansion for the two scenarios between 1850 and 1920 CE is illustrated by arrows on the right. (B) The terrestrial C budget for the period 1850 to 1920 CE. Cumulative CO2 emissions from LULC for HYDE 3.2 (purple) match within uncertainties the total terrestrial C stock change inferred from the atmospheric CO2 record (green), whereas LULC emissions for KK10 (cyan) are much smaller. C uptake by peat (blue) is small. LULC emissions are from simulations with the LPX-Bern Dynamic Global Vegetation Model (Stocker et al. 2017). |
First, the present-day state of land use and the biomass density of vegetation across space is relatively well known. The difference between C storage in actual vegetation and in potential natural vegetation is equal to cumulative CO2 emissions from past LULC since appearance of the first agriculturalists. Hence, cumulative LULC CO2 emissions are relatively well-constrained, implying that uncertainty in past LULC emissions becomes mainly a problem of distributing their cumulative total through time. More emissions in distant millennia imply that less is left for the more recent past. Emissions have to converge to within the constrained range of estimates for cumulative emissions. Quantitatively, Stocker et al. (2017) found relatively small differences in cumulative LULC-induced CO2 emissions when applying different LULC histories in their model (Fig. 1). However, further research is needed to reduce remaining uncertainty in cumulative emissions and differences between satellite and model-based estimates (Erb et al. 2018).
The second constraint comes from the total C budget of the terrestrial biosphere. Ice-core data on past CO2 concentrations and carbon-isotopic composition have been successfully used to reconstruct the net C balance of the land biosphere, as well as the C balance of the ocean (Elsig et al. 2009). Knowing all natural contributions to land C inventory changes, we can isolate anthropogenic sources by difference. Despite imperfect knowledge on C sources and sinks from all ecosystems, this approach provides a way to integrate our understanding of past C cycle changes within the budget constraint. Two examples below illustrate this point.
Unprecedented terrestrial C release after 1850 CE: very likely anthropogenic
During the period 1850-1920 CE, ice-core data suggest a substantial terrestrial C source of 45 PgC in total. This is on average 0.64 PgC/yr, or around half the current annual CO2 emissions from modern LULC and by far the most rapid land-C-balance change ever recorded in all preceding periods of the Holocene. Is this the anthropogenic signal? One reconstruction of past LULC (HYDE 3.2; Klein Goldewijk 2016) suggests that emissions fall right into the same magnitude as this apparent land C source (Fig. 1). The alternative reconstruction (KK10; Kaplan et al. 2009) suggests a much larger land area under use in 1850 CE than HYDE 3.2. This necessarily leaves less room for further land-use expansion after that point in time, and resulting emissions cannot explain the net C source derived from the ice-core data. Additional natural C loss from land in response to the slight warming trend was likely counteracted by the fertilizing effect of slowly rising CO2 between 1850 and 1920 CE, assuming that our estimates of these feedback strengths are accurate. Taken together, the land C budget suggests that the KK10 scenario, featuring extensive deforestation before 1850 CE, leaves a C source of 31 PgC unexplained and therefore appears less likely than a more moderate extent of pre-1850 CE deforestation as suggested by HYDE 3.2. However, KK10 is more in line with pollen-based quantitative vegetation reconstructions in northwestern Europe than HYDE 3.2 (Kaplan et al. 2017). These considerations of the land C budget and timing of emissions illustrate the relevance of improving preindustrial land-use reconstructions to understand terrestrial C sources and sinks and climate-carbon cycle feedbacks also in the most recent decades.
A large terrestrial C source after the Mid-Holocene
 |
|
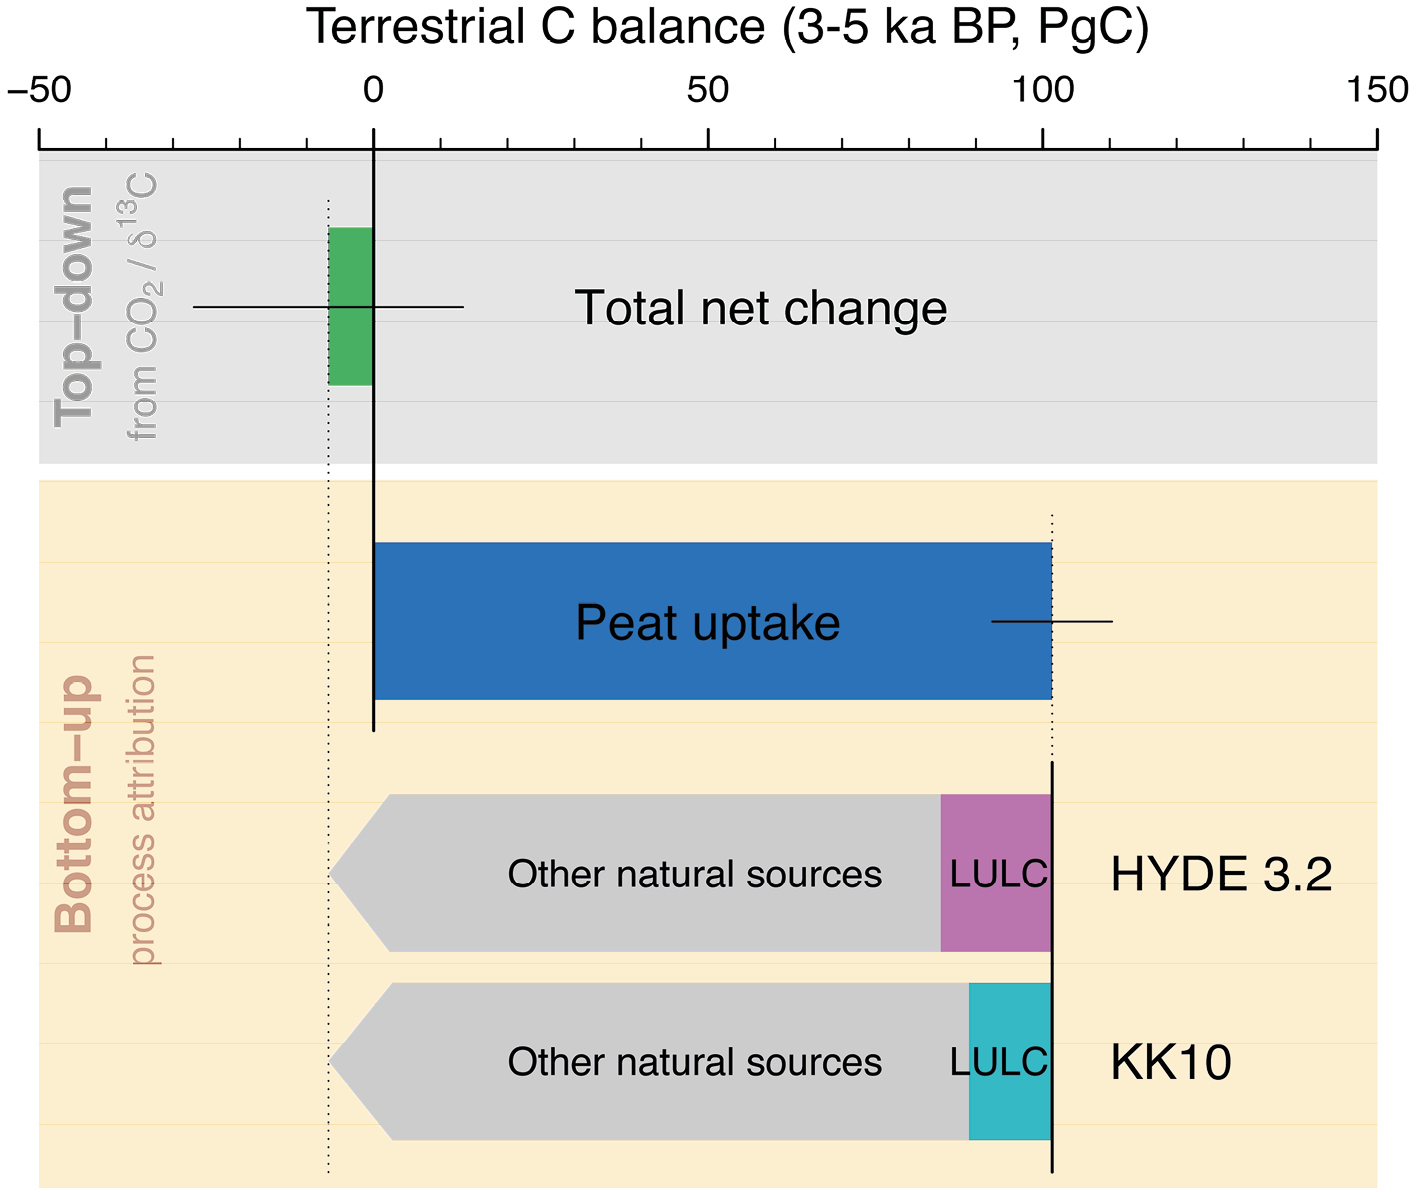
Figure 2: Terrestrial C budget in the period 5-3 ka BP. The total terrestrial net change (green) is derived from ice-core CO2 and δ13C data. The difference between the total net change and peat uptake (blue) provides a top-down constraint on the sum of CO2 emissions from LULC and other natural sources (grey bars). LULC emissions are estimated based on two alternative scenarios, HYDE 3.2 (purple) and KK10 (turquoise). |
The parallel evolution of ice-core CO2 and its isotopic composition suggests no significant change in terrestrial C storage between 5 and 3 ka BP. Could large anthropogenic emissions have been masked by an equally large and contemporaneous natural C sink? Indeed, the build-up of northern peatlands, initiated after ice-age conditions, was a major C sink at these timescales. Through large-scale data synthesis (Loisel et al. 2014) and global modeling (Stocker et al. 2014), it is now possible to estimate the timing and amount of C sequestration in peatlands throughout the Holocene. This allows subtracting their contribution from the total land C balance and reveals that a large terrestrial non-peatland C source must have contributed to the near-neutral land C balance in that period (Fig. 2). Can anthropogenic emissions close the budget? Probably not. A comparison of the inferred natural non-peatland C source with LULC emission estimates based on available LULC reconstructions suggests that other, still unknown, natural sources must have contributed to C cycle changes during this period.
Other gradual changes in the land C cycle amount to substantial sinks or sources at these long timescales. Examples include permafrost changes, the continuous build-up of soil C after the retreat of ice sheets, biome shifts in response to monsoon weakening in Africa and summer cooling in the boreal zone after the Mid-Holocene. It would be fruitful to specifically target and reduce uncertainties in these less-well-quantified but important components of the land C cycle through multi-model studies, constrained by data from paleoecological archives. This would allow us to isolate additional components of the terrestrial C budget and further narrow the range of possible land-use histories. This range will additionally be reduced by integrating information from pollen-based vegetation reconstructions and archaeology-based land-use characteristics as produced by PAGES’ LandCover6k working group (http://pastglobalchanges.org/landcover6k, see also Editorial and Harrison et al., this issue). The combination of such bottom-up and top-down constraints for the land C budget will improve our understanding of the Earth’s environmental history and the role of humans therein.
affiliations
1CREAF, Bellaterra (Cerdanyola del Vallès), Spain
2Department of Earth and Environmental Sciences, Lehigh University, Bethlehem, USA
3Climate and Environmental Physics, University of Bern, Switzerland
4Oeschger Center for Climate Change Research, University of Bern, Switzerland
contact
Benjamin D. Stocker: b.stocker creaf.uab.cat
references
Betts RA et al. (2007) Agric For Meteorol 142: 216-233
Elsig J et al. (2009) Nature 461: 507-510
Erb K-H et al. (2018) Nature 553: 73-76
Eyring V et al. (2016) Geosci Model Dev 9: 1937-1958
Kaplan JO et al. (2009) Quat Sci Rev 28: 3016-3034
Kaplan JO et al. (2017) Land 6: 91
Lewis SL, Maslin MA (2015) Nature 519: 171-180
Loisel J et al. (2014) Holocene 24: 1028-1042
Pongratz J et al. (2009) Global Biogeochem Cycles 23: GB4001
Ruddiman WF (2003) Clim Change 61: 261-293
Singarayer JS et al. (2011) Nature 470: 82-85
Stocker BD et al. (2011) Biogeosciences 8: 69-88
Sandy P. Harrison1, B.D. Stocker2, K. Klein Goldewijk3, J.O. Kaplan4,5 and P. Braconnot6
We motivate and describe the minimum set of data required to improve the modeling of feedbacks associated with land-cover and land-use changes on climate over the Holocene.
The paleoclimate modeling community is gearing up for a new set of analyses of past climate change as part of the current phase of the Coupled Model Intercomparison Project (CMIP6). The role of land-surface feedbacks on climate will be a major focus of these analyses. Assessment of the importance of human impacts on land use and land cover (LULC) for climate during the industrial period have been hampered by uncertainties about the nature and size of these changes and by differences in the way LULC changes are implemented in models. The climate impact of LULC changes before the industrial period is also a matter of debate. Here, we examine why we need to include anthropogenic LULC changes in paleoclimate experiments and the key data requirements for doing so.
What is LULC change and how does it affect climate?
 |
|
Figure 1: Land use in the Middle East (top panels) at 6000 year BP and West Africa (bottom panels) at AD 1500, from the two widely used global historical land-use scenarios HYDE 3.2 (left panels, Klein Goldewijk et al. 2017) and KK10 (right panels, Kaplan et al. 2011), illustrating the large disagreement between LULC scenarios at a regional scale. |
Climate-induced changes in land cover during the last century have been small, and largely confined to increased productivity and shifts in growing-season length. However, human activities during the industrial period have profoundly changed terrestrial landscapes, by removing natural vegetation for agriculture and husbandry, and through more subtle changes in structure and composition of the vegetation caused by management practices. Anthropogenic LULC changes affect climate through changes in the carbon cycle resulting from modifications in vegetation and soil carbon storage (biogeochemical feedbacks) and through changes in the surface-energy budget resulting from modifications of surface albedo, evapotranspiration, and canopy structure (biophysical feedbacks). About one third of the total anthropogenic CO2 emissions during the industrial period have been attributed to LULC changes, while biophysical effects have contributed to cooling extra-tropical regions and warming the tropics (Myhre et al. 2013). However, large differences between reconstructions of the extent of agricultural and grazing land prior to industrialization (Fig. 1) imply significant uncertainty in anthropogenic climate forcing during the historical period (Stocker et al. 2018).
Early agricultural impact on climate?
There is archaeological and palynological evidence from many parts of the world for human-induced landscape changes during the Late Holocene. This raises the issue of whether the LULC changes associated with the Neolithic agricultural revolution, from ca 10,000 year BP onwards in the Middle East, were large enough to affect climate. The idea that greenhouse gas emissions associated with Neolithic LULC changes were sufficiently large to offset climate cooling (the overdue-glaciation hypothesis: Ruddiman 2003) has been challenged on multiple grounds (e.g. EPICA Community Members 2004; Stocker et al. 2017) but a LULC impact on climate in more recent millennia appears more plausible. Model studies have shown that prescribed Holocene LULC changes had detectable impacts on regional temperature and precipitation and even had a significant effect beyond the major agricultural regions (e.g. Smith et al. 2016). However, reconstructions of pre-industrial LULC change (Klein Goldewijk et al. 2011; Kaplan et al. 2011; Klein Goldewijk et al. 2017) are based on estimates of past population and the timing of first agriculture, and simple assumptions about the cropland and pasture area required per person, derived from relatively well-documented regions and extrapolated to the rest of the world. Large uncertainties in all of these factors translate into widely different land-use reconstructions (Gaillard et al. 2010). Hence, confidence in inferred LULC-related climate impacts is low.
LULC changes: Minimum requirements for paleoclimate modeling
The vegetation module of Earth System Models (ESMs) predicts the natural vegetation response to changes in simulated climate and CO2. LULC changes are treated as external forcing and used to modify the simulated natural vegetation distribution by specifying the area of each grid cell at each time occupied by crop or pasture plant functional types. Changes in cropland and pasture area involve a redistribution of carbon, nitrogen and water mass between these different areas (or “tiles”) and between product pools within the grid cell. This, and prescribed management (e.g. soil cultivation, implemented by enhancing soil organic matter decomposition rates; removal of material from cropland and pasture (harvest), implemented by diverting a fraction of aboveground biomass into respiration) determine the carbon balance of each grid cell. Typically, cropland management has a stronger impact on reducing soil carbon storage than grazing. The treatment of pasture, and particularly whether pasture expansion results from conversion of forests or naturally open vegetation, varies between ESMs, and has strong effects on simulated LULC CO2 emissions.
 |
|
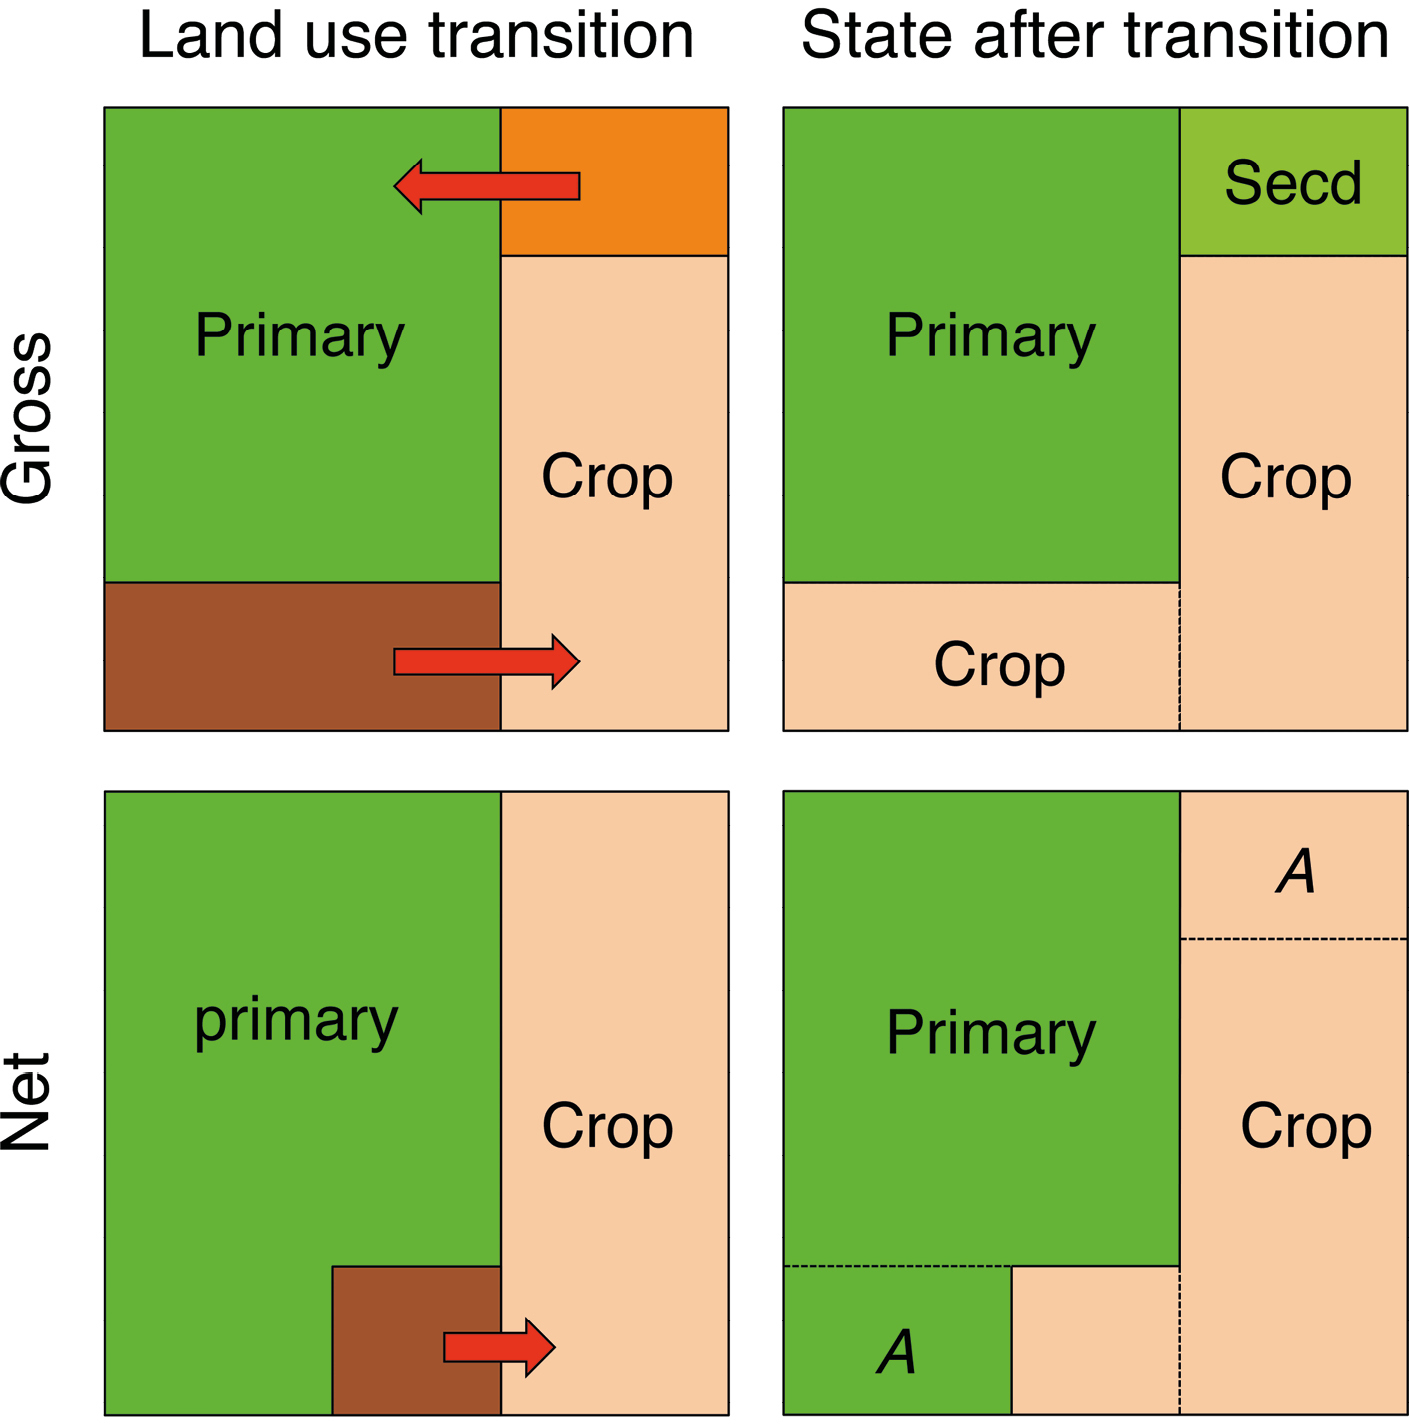
Figure 2: Schematic illustration of simulating gross (top row) versus net (bottom row) LULC change within one grid cell (modified from Stocker et al. 2014). The orange area represents abandonment of cropland and the brown area represents conversion of forest to cropland. In the scheme for gross LULC, abandoned cropland is treated as a separate land unit for secondary land (“secd”). In the scheme for net LULC, only the net land-use change (conversion of primary minus abandonment of cropland) is accounted for and no area of secondary regrowth is created. Note that A denotes equal areas. As a result, a smaller grid-cell-area fraction is affected by LULC in the net scheme compared to the gross scheme and biomass stocks are on average smaller in the gross scheme due to younger vegetation on secondary land. |
LULC changes are bi-directional: land can go from natural vegetation to crop or pasture, but cropland and pasture can also be abandoned and revert to natural vegetation (Fig. 2). This secondary growth (whether forest or openland) does not necessarily have the same characteristics and carbon balance as undisturbed natural vegetation. Accounting for these total (or “gross”) LULC changes (e.g. Shevliakova et al. 2009) is particularly important in regions of shifting cultivation and has been shown to increase CO2 emissions over the past 150 years by ca 10-40% (Arneth et al. 2017). However, accounting for gross LULC changes requires additional information about land turnover rates and the time-varying extent of shifting cultivation.
The productivity of natural vegetation can be affected by management, most importantly wood harvesting for construction or fuel. Wood harvesting further inflates total CO2 emissions from LULC changes, with effects during the historical period similar in magnitude as those of shifting cultivation (Arneth et al. 2017). Implementation in models requires additional information on either the area affected by, for example, clear cutting or the amount of biomass removed by grid cell.
Thus, technically, the minimum set of information required to be able to model the impact of LULC changes in paleoclimate experiments is:
- - Cropland areal fraction;
- - Pasture areal fraction;
- - Whether pasture has been converted from natural forest or from open vegetation;
- - The fraction of biomass removed each year by crop harvest;
- - The fraction of aboveground biomass removed each year by livestock on pastures;
- - Land turnover rate under shifting cultivation;
- - Time-varying extent of shifting cultivation;
- - The amount of biomass removed or area affected each year by wood harvesting.
The PMIP4-CMIP6 experiments
The evaluation of paleoclimate simulations provides an out-of-sample test of the models used to project the future, and paleoclimate experiments are therefore included as part of the suite of simulations in the current phase of CMIP6. The contribution of the Palaeoclimate Modelling Intercomparison Project (PMIP) to CMIP6 (PMIP4-CMIP6) will focus on a limited number of paleoclimate experiments. One of these simulations, the Last Millennium simulation (past1000, 850-1850 CE; Jungclaus et al. 2017), will include prescribed time-varying LULC changes thus ensuring that the LULC forcing will mesh continuously with the LULC forcing being used for the 20th century. The baseline mid-Holocene simulation (midHolocene, 6000 year BP; Otto-Bliesner et al. 2017) will not include prescribed changes in vegetation cover or LULC, although some modeling groups will be running with interactive vegetation and thus will be able to examine the feedbacks associated with climate-induced changes in natural vegetation. Additional sensitivity experiments are planned to investigate the likely impact of both climate-induced vegetation changes and LULC changes on the mid-Holocene climate. Robust evidence-based reconstructions of vegetation and LULC changes are therefore an important contribution to the PMIP4-CMIP6 exercise. The challenge for the PAGES LandCover6k Working Group (http://pastglobalchanges.org/landcover6k) is to translate the still somewhat patchy observational records into a global gridded dataset in a timely way so that these sensitivity tests are more realistic than previous attempts to investigate LULC changes during the Holocene.
affiliations
1School of Archaeology, Geography and Environmental Science, Reading University, UK
2Ecological and Forestry Applications Research Centre, Cerdanyola del Vallès, Spain
3Copernicus Institute of Sustainable Development, Utrecht University, The Netherlands
4Max Planck Institute for the Science of Human History, Jena, Germany
5School of Geography and the Environment, University of Oxford, UK
6Laboratoire des Sciences du Climat et de l’Environnement, Gif-sur-Yvette, France
contact
Sandy P. Harrison: s.p.harrisonreading.ac.uk
references
Arneth A et al. (2017) Nature Geosci 10: 79-84
EPICA Community Members (2004) Nature 429: 623-628
Gaillard M-J et al. (2010) Clim Past 6: 483-499
Jungclaus J et al. (2017) Geosci Model Dev 10: 4005-4033
Kaplan JO et al (2011) Holocene 21: 775-791
Klein Goldewijk K et al. (2011) Global Ecol Biogeogr 20: 73-86
Klein Goldewijk K et al (2017) Earth Syst Sci Data 9: 927-953
Otto-Bliesner B et al. (2017) Geosci Model Dev 10: 3979-4003
Ruddiman WF (2003) Clim Change 61: 261-293
Shevliakova E et al. (2009) Glob Biogeochem Cycles 23: GB2022
Smith MC et al. (2016) Clim Past 12: 923-941
Stocker BD et al. (2014) Tellus B 66: 23188
Marie-José Gaillard1, K.D. Morrison2, M. Madella3 and N. Whitehouse4
 |
|
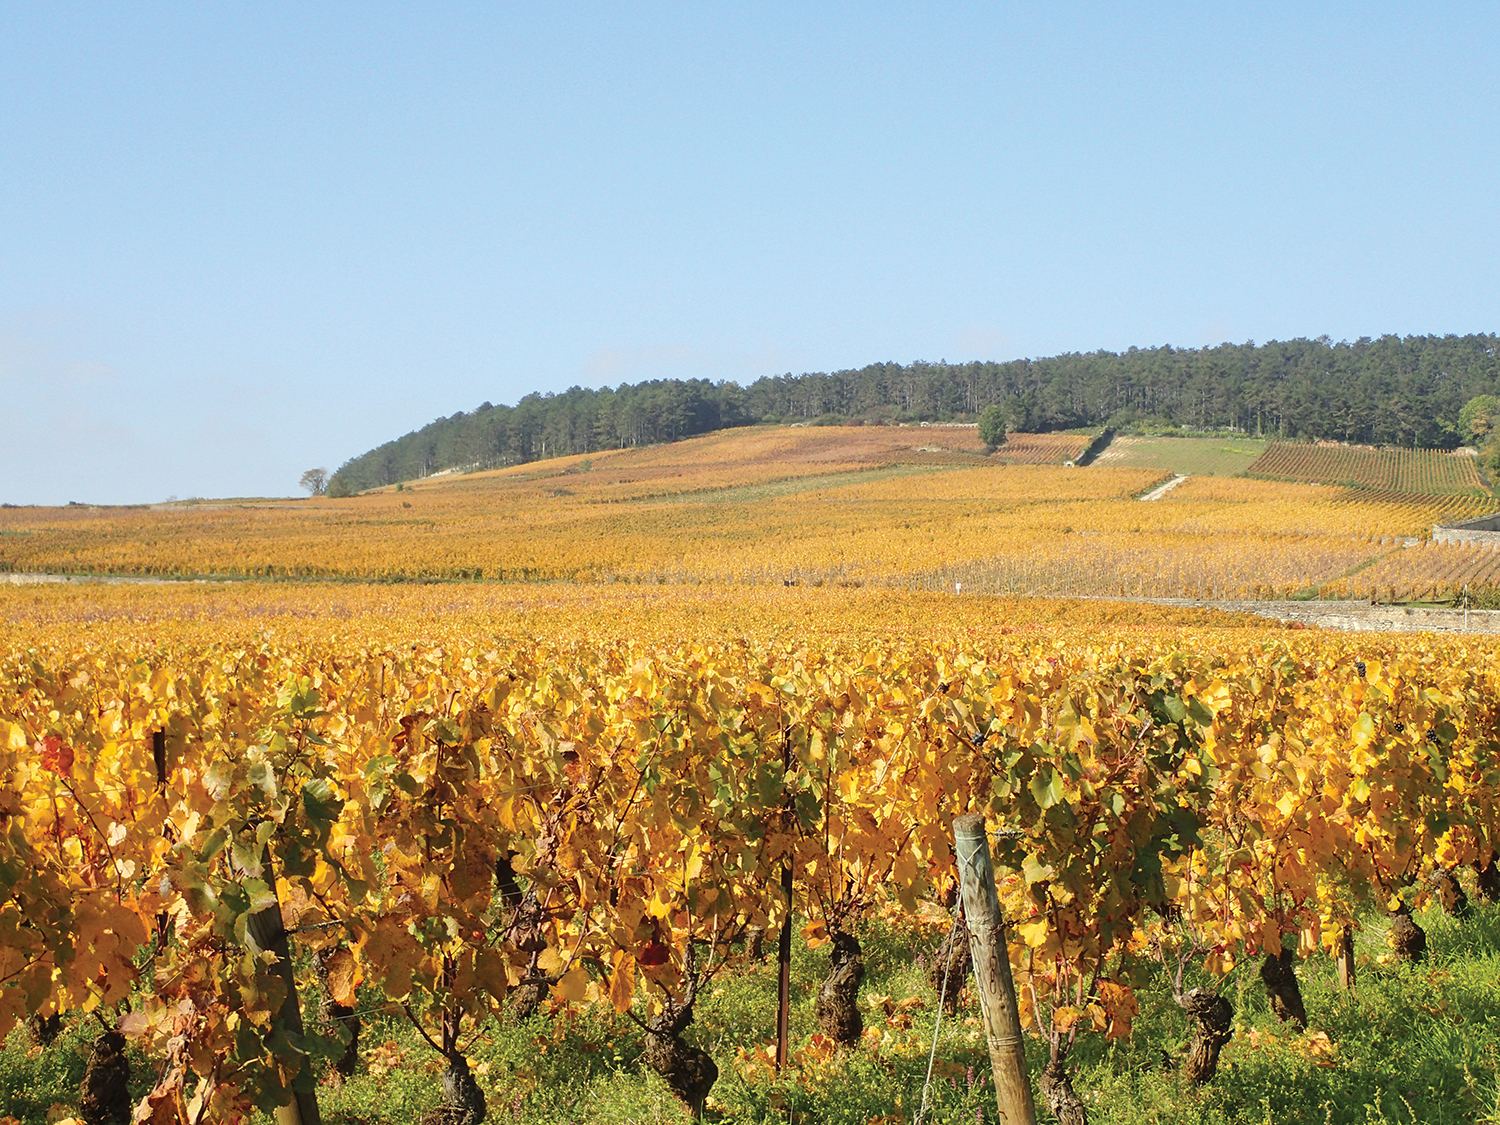
If the effects of past land use on environmental and societal processes and climate are to be quantified, the reconstructions of past land use and related land-cover change have to be more realistic than the model scenarios previously used. Vineyards in Pommard, Burgundy, France. Image credit: M.-J. Gaillard. |
Land-use change has influenced, and influences, many aspects of the environment such as pedogenesis, soil erosion, hydrology, vegetation, lakes’ and rivers’ nutrient status, microclimate and, last – but not least – regional and global climate. It is still a challenge, however, to quantify land-use change in the past and its effect on past environment through time and across space. Such knowledge is necessary for the development of sustainable landscape management and land-use strategies in line with the challenge of climate warming mitigation.
It is widely accepted that plant cover on Earth is part of the climate system and anthropogenic land-cover change (as a consequence of land-use change) may imply a complex combination of biogeochemical and biogeophysical processes. The size and sign (warming or cooling) of the net effect of anthropogenic land-cover change on global and regional climate is, however, still a matter of debate (Strandberg et al. 2014; Gaillard et al. 2015). The first coordinated database of land-cover (basically deforestation) maps, at 50-year intervals, since 1700 CE for climate modeling studies was led by Leemans and collaborators, and discussed for the first time at a workshop organized by PAGES Biome 300 (Leemans et al. 2000). The latter was part of the PAGES HITE working group initiated by Frank Oldfield (Oldfield et al. 2000), the first PAGES activity dealing with the human dimension of climate change. It resulted in the now well-known HYDE Database (History Database of the Global Environment) of past land use and land cover (Klein Goldewijk 2001). Since then, HYDE has been updated and improved regularly to the latest version (3.2; Klein Goldewijk et al. 2017) and has been the most-used database on land use by climate modelers. HYDE’s and other scenarios of past land use, however, tend to overlook socio-cultural effects such as technology or diet, which are as important as the physical environment in determining land-use strategies. Improving the records of socio-cultural characteristics behind the diverse approaches of past societies to environmental exploitation will augment our understanding of past, present and future dynamics of our planet.
In this issue, we have gathered contributions that illustrate the challenge of reconstructing past land use and land cover at different spatial scales (from local to global). The PAGES LandCover6k working group’s primary goal is to use pollen, archaeological (both material culture and biological remains) and historical data to provide quantitative information on past land cover and land use to evaluate and improve Anthropogenic Land-Cover Change (ALCC) scenarios for paleoclimate modeling. Archaeology and history-based land-use maps with quantifiable attributes at the global scale, plus pollen-based reconstructions of past land cover at a subcontinental and continental scale using the REVEALS model (Sugita 2007) or alternative methods, are major products of the working group. In addition to the need for global modeling studies of the Earth system over past millennia, there is also scope for improved interregional comparisons of land-use history and for data syntheses that will allow better understanding of the interconnected histories of land use and social transformations over time.
The issue opens with papers on the need for realistic reconstructions of past anthropogenic land-use and land-cover change to develop a complete understanding of the Earth system over time (Harrison et al. p.4; Stocker et al. p.6). These are followed by presentations of methods to achieve such reconstructions and their potential in the evaluation of model outputs (Morrison et al. p.8; Woodbridge et al. p.10; Marquer et al. p.12). Eight contributions on various aspects of land-use reconstructions based on archaeological and historical data, and the challenge of upscaling the information to global scale, follow. Lombardo et al. (p.14) provide an example of application of the LandCover6k global land-use classification in Latin America. Case studies from Africa (Boles et al. p.16), Japan (Bell et al. p.22) and Europe (Whitehouse et al. p.24) combine archaeology-based, land-use reconstructions with pollen-based estimates of land cover. Biagetti et al. (p.20) discuss past rain-fed agriculture in hyper-dry regions, and Widgren (p.18) presents maps of past land use in Africa. Antolín et al. (p.26) apply paleoecological and archaeological methods to reconstruct agricultural decision making in western Europe, Kolář et al. (p.30) use archaeological evidence to reconstruct past population dynamics and land use in central Europe, and Vander Linden et al. (p.28) discuss diffusion of early farming across Europe. The issue closes with examples of transient pollen-based REVEALS reconstructions of land-cover change in eastern China compared with archaeological data (Li et al. p.32), and the first synthesis of REVEALS-based reconstructions for the Northern Hemisphere (Dawson et al. p.34).
We hope this special issue will motivate more palynologists, archaeologists and historians to join the exciting opportunity of synthesizing the wealth of existing information on past land use and land cover in formats that are useful for the wider communities of social, environmental and Earth-system scientists.
affiliations
1Department of Biology and Environmental Science, Linnaeus University, Kalmar, Sweden
2University Museum of Archaeology & Anthropology, University of Pennsylvania, Philadelphia, USA
3Department of Humanities (CaSEs, ICREA), University Pompeu Fabra, Barcelona, Spain
4School of Geography, Earth and Environmental Sciences, Plymouth University, UK
contact
Marie-José Gaillard: marie-jose.gaillard-lemdahllnu.se
references
Klein Goldewijk K (2001) Glob Biogeochem Cy 15: 417-433
Klein Goldewijk K et al. (2017) Earth Syst Sci Data 9: 927-953
Leemans R et al. (2000) PAGES news 8(3): 21-23
Oldfield F et al. (2000) PAGES news 8(3): 32
Liang Emlyn Yang1, J. Wiesehöfer2, H.-R. Bork3 and M. Hoo1,2
Kiel, Germany, 28-29 September 2017
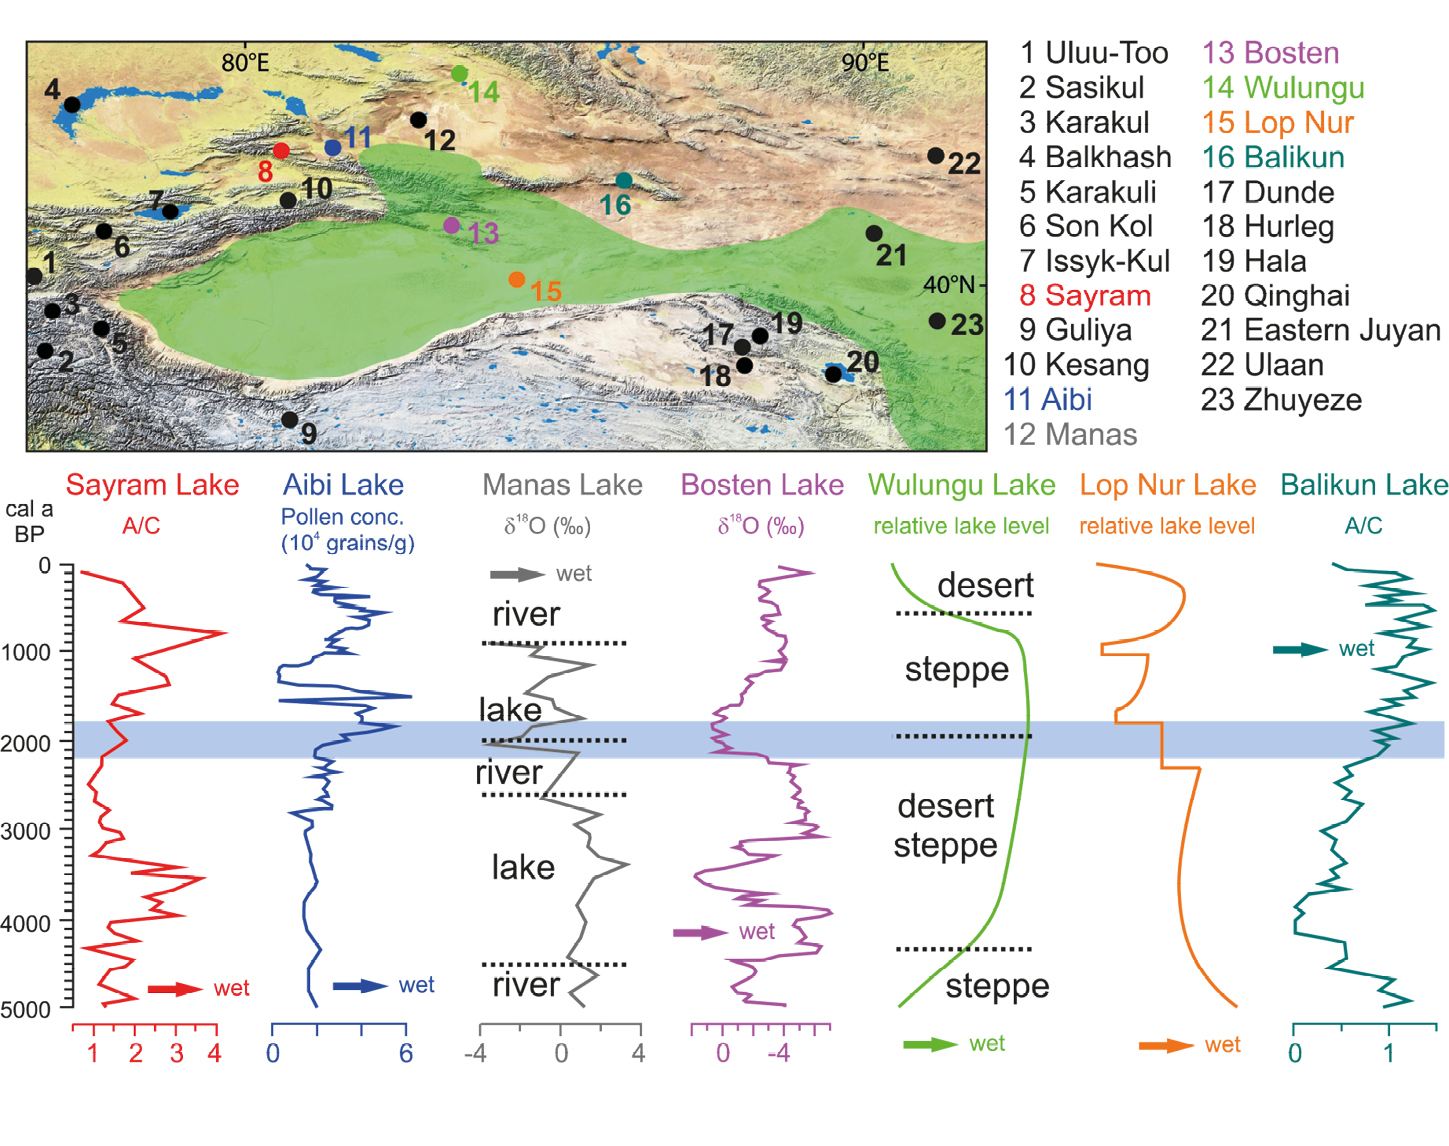
The Silk Road is a modern concept for an ancient network of trade routes that for centuries facilitated and intensified processes of cultural interaction and goods exchange between West China, Central Asia, the Middle East, and the Mediterranean (Elisseeff 2001). The Silk Road flourished when the Han dynasty explored Central Asia around 139 BCE and thrived throughout the Middle Ages and eventually declined under the Islamic and Mongol Empires. There is increasing discussion that climatic and environmental factors may have played a role in fostering economic and socio-cultural changes along the Silk Road and in a broader area (Zhang et al. 2011). Coherent patterns and synchronous events in history suggest possible links between social upheaval, resource utilization, and climate or environment forces (Clarke et al. 2016; Mischke et al. 2017). Such links between climatic, environmental, economic, social, and cultural changes would have manifested themselves differently according to place and time; however, it often remains unclear if and how exactly they affected socio-cultural situations on the ground.
 |
|
Figure 1: Proxy- and literature-based climate records suggesting massive human-induced landscape changes. The selected curves below the map illustrate wet conditions in specific regions. The green area on the map represents the extent of the Han Dynasty in today’s Western China and the blue bar in the graphs refer to its period of occurrence (206 BCE – 220 CE). The Han dynasty is considered as the "golden age" of Chinese history and helped establish the Silk Road. A/C refers to the Artemisia to Chenopodiaceae pollen ratio which is used to differentiate between desert and steppe vegetation. Provided by Steffen Mischke and edited by Liang E. Yang. |
The international workshop “The Rise and Fall: Environmental Factors in the Socio-Cultural Changes of the Ancient Silk Road Area” was held at Kiel University. The Silk Road served as the geographical scope and inspirational concept for the workshop. Nineteen researchers from 12 countries presented topics on the expansion of Ancient China to the west; Central Asia as the key node area of the Silk Road; historical water and agriculture systems; climate and environment disasters in the past; climate links to social evolution; and changes of lake and sea regions from ancient to recent periods. The presentations investigated both perspectives of socio-environmental interactions; it became clear, for instance, that climate change provided better hydrological resources for the golden era of Silk Road trade, and that water withdrawn for human activities resulted in dramatic landscape changes including the near and complete desiccation of large lakes in the arid western part of today’s China (Fig. 1). These topics were approached from various disciplinary angles and perspectives, ranging from archaeology, climate change, antiquity, historical geography, agriculture, carving art and literacy. Contributions focused on the middle to late Holocene and covered specific areas along the ancient Silk Road regions.
The workshop also held a lunch seminar, which discussed joint publication and potential research cooperation. A proceeding book volume, with a proposed title "Socio-Environmental Dynamics along the Historical Silk Road", will be published by Springer. Eighteen full papers from participants have been received for peer review. To share information and to provide an opportunity to those interested in the topic but unable to attend the workshop, additional papers are invited from research groups and experts in the field.
The workshop increased our understanding of the role played by the environment in socio-cultural changes that occurred in the territories along the ancient Silk Roads, and initiated a network of both young and senior researchers to facilitate international connectivity and multidisciplinary cooperation. Moreover, participants expressed great interest in organizing a follow-up meeting and proposed ideas for cooperation in the near future, for instance, nomadic responses to water conditions at the front regions of the Tianshan Mountain.
Acknowledgements
The workshop was jointly supported by the Graduate School Human Development in Landscapes at the Kiel University and PAGES.
affiliationS
1Graduate School Human Development in Landscapes, Kiel University, Germany
2Institute of Classical Antiquity, Kiel University, Germany
3Institute for Ecosystem Research, Kiel University, Germany
contact
Liang Emlyn Yang: lyanggshdl.uni-kiel.de
references
Clarke J et al. (2016) Quat Sci Rev 136: 96-121
Elisseeff V (2001) The Silk Roads: Highways of Culture and Commerce. Berghahn Books, 352 pp
Kathleen R. Johnson1 and Jay Banner2
Austin, USA, 21-24 May 2017
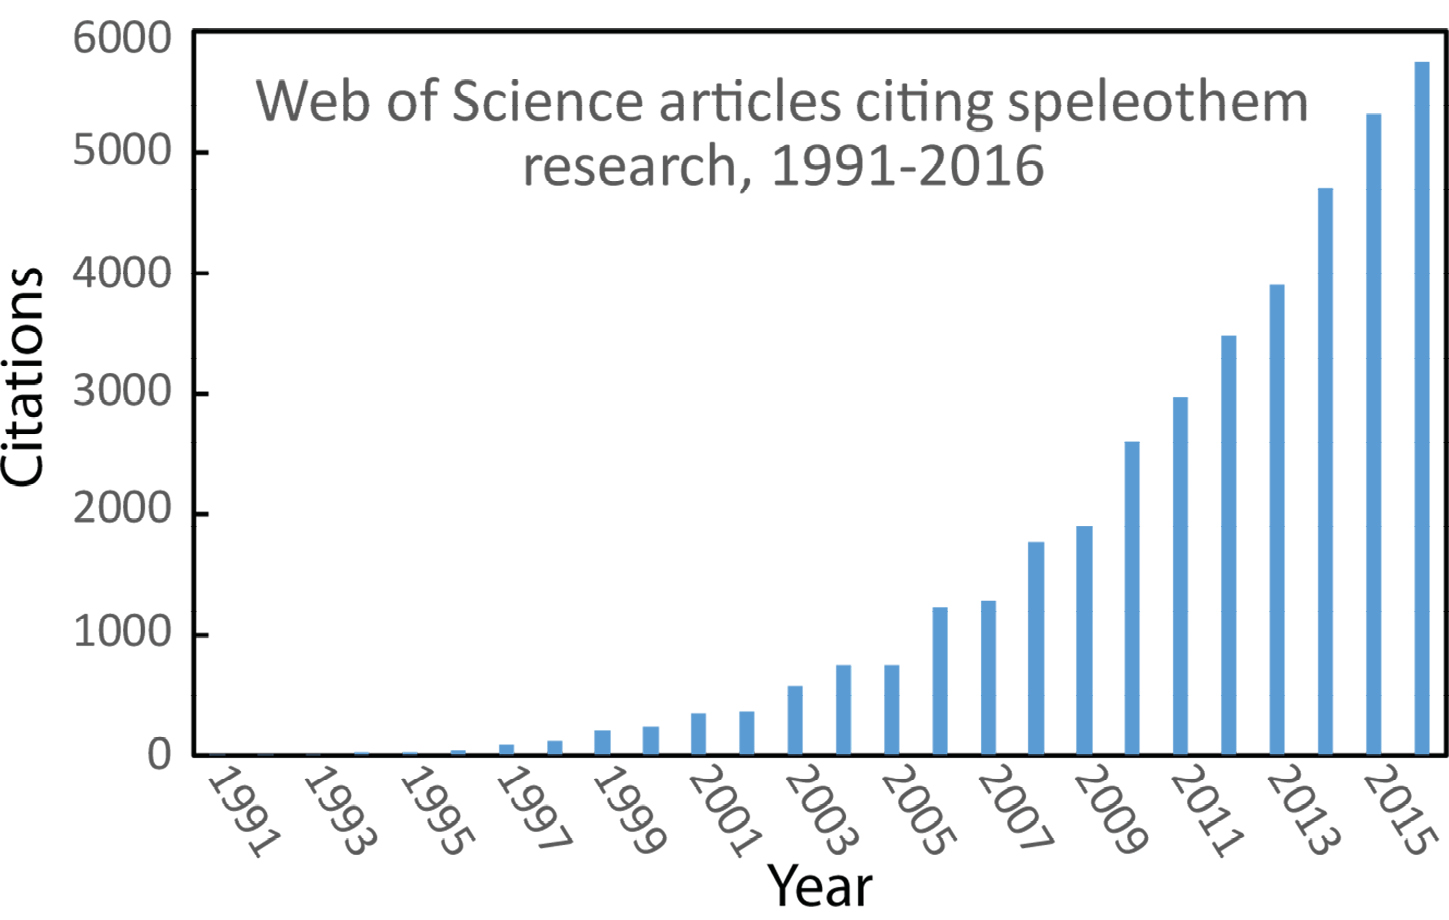
In recent decades, speleothems have become increasingly used as paleoclimate archives due to their suitability for precise U-series dating, their fast and continuous growth, their broad geographic distribution, and the fact that they contain multiple proxies which are sensitive to environmental change. The rapid development of speleothem science (Fig. 1) has led, in particular, to major advances in our understanding of past hydroclimate variability. For instance, speleothems have provided detailed records of monsoon variability in Asia and South America, and have improved characterization of global teleconnections in response to orbital- and millennial-scale climate change (e.g. Cheng et al. 2009; Cruz et al. 2005; Wang et al. 2001). However, speleothem geochemical and physical properties reflect a complex, integrated signal of processes in the atmosphere, soil, epikarst, and caves (Fairchild et al. 2006). Robust interpretation of speleothem data, therefore, requires monitoring studies in active cave systems, often in combination with theory and modeling of speleothem processes.
 |
|
Figure 1: Web of Science search results showing the exponential increase in citations per year for articles that include the topics "speleothem" or "stalagmite" and "paleoclimate". This search returns a total of 1,483 articles that have been cited over 41,000 times. |
The latest in speleothem-based paleoclimate records, cave monitoring, proxy-development, and modeling studies were presented at the 8th International "Climate Change: The Karst Record (KR8)" conference, which took place at the Jackson School of Geosciences, University of Texas at Austin. The conference, which has been the premier gathering of speleothem scientists since the initial meeting (KR1) in Bergen, Norway, in 1996, brought together 115 scientists from 18 countries for three days of oral and poster presentations (abstracts available at http://sites.uci.edu/kr8conference/scientific-sessions), workshops and field trips. PAGES funding provided travel support for eight early-career scientists, including three from developing countries. The conference was organized around six themes: (1) Cave monitoring and climate proxy development, (2) High-resolution speleothem records, (3) Speleothem records of orbital to millennial scale climate variability, (4) Novel techniques, proxies, and unconventional archives, (5) Modeling in speleothem science, and (6) Speleothem proxy records in an Earth system context. Meeting attendees could choose to attend mid-conference workshops on: (1) Connecting climate models and paleo records, (2) Speleothem petrography, (3) Forward modeling of speleothem isotopes, and (4) Speleothem age modeling. Participants could also select from a variety of field trips to several central Texas cave locations studied by researchers from UT Austin (Banner et al. 2007; Feng et al. 2014; Meyer et al. 2014).
A pre-conference workshop, led by Amy Frappier (Skidmore College), on "Best Practices in Speleothem Science" was attended by 30 scientists. Discussion topics included trends and maturation of speleothem science, strategies for enhancing diversity within the field, and increasing public awareness of speleothem science. Significant discussion focused on strategies for minimizing impacts on cave environments and fostering strong and reciprocal relationships with cave managers and other stakeholders. One sentiment widely shared by attendees is the need for a coordinated effort to create a cave-sample database and archive. Obtaining funding and buy-in from the speleothem community will be necessary to achieve this goal. Finally, there was some discussion of data archiving and speleothem metadata, including participation in community initiatives such as SISAL (pastglobalchanges.org/science/wg/sisal/intro) and LinkedEarth (http://linked.earth). The key outcomes and recommendations stemming from this workshop will be the focus of a forthcoming white paper.
The KR8 conference continued the tradition of previous meetings in providing a forum for the presentation of cutting-edge speleothem-based paleoclimate research, including presentations of new records, detailed cave-monitoring studies, application of new methods and technologies to speleothem science, and strategies for improving interpretation of speleothem records through modeling studies. Furthermore, the meeting provided an excellent opportunity for networking and professional development of young researchers in the highly supportive and collaborative speleothem community. We look forward to the ninth "Climate Change: The Karst Record" meeting (KR9) which will be held at the University of Innsbruck, Austria, in 2020.
affiliations
1Department of Earth System Science, University of California, Irvine, USA
2Jackson School of Geosciences, University of Texas at Austin, USA
contact
Kathleen R. Johnson: kathleen.johnsonuci.edu
references
Banner JL et al. (2007) J Sediment Res 77: 615-622
Cheng H et al. (2009) Science 326: 248-252
Cruz FW et al. (2005) Nature 434: 63-66
Fairchild IJ et al. (2006) Earth-Sci Rev 75: 105-153
Feng W et al. (2014) Geochim Cosmochim Acta 127: 233-250
Elaine Kennedy Sutherland1, P. Brewer2 and W. Gross3
Woodland Park, USA, 10-14 September 2017
 |
|
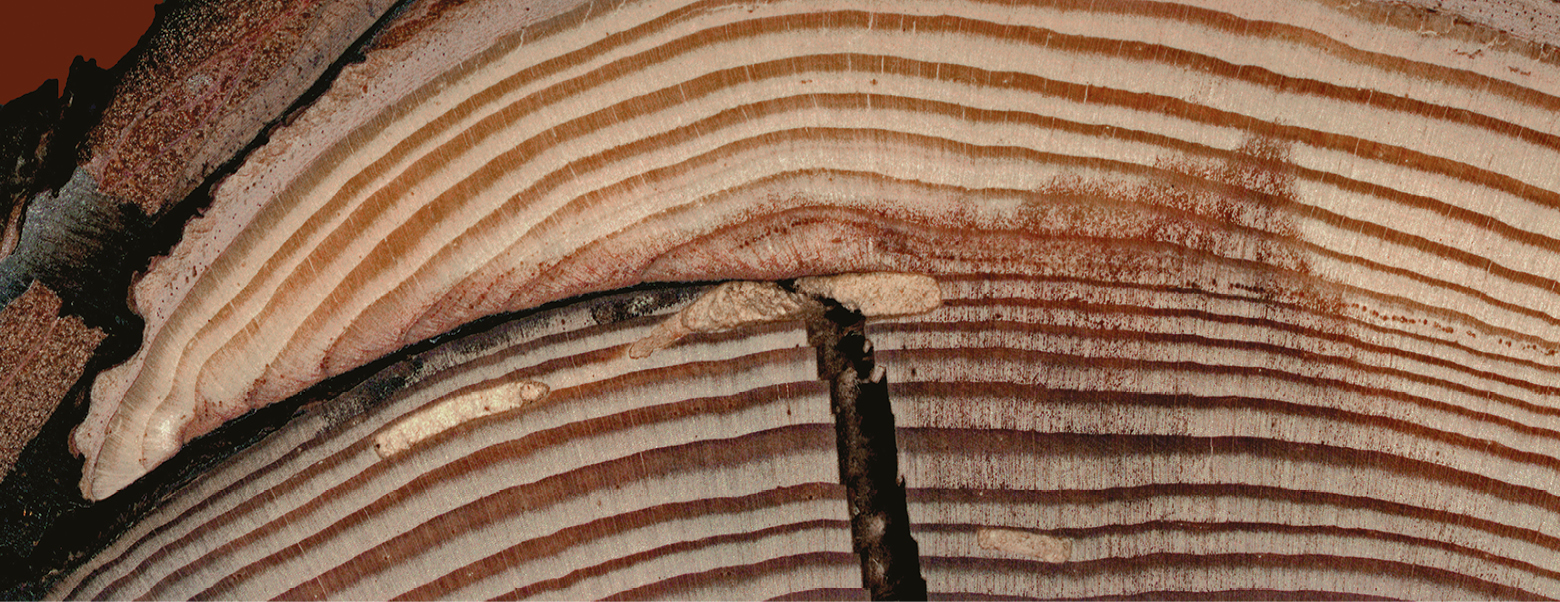
Figure 1: A Larix occidentalis tree, from western Montana, USA, injured by a 2003 wildfire. Indicators of injury include killed cambium, presence of traumatic resin ducts, resin flooding around the injury, and woundwood rib and scar formation (Smith et al. 2016). Photo courtesy of K.T. Smith; sample prepared and photo taken by K.R. Dudzik, both of USDA Forest Service Northern Research Station, Durham, USA. |
Extreme environmental events, such as storm winds, landslides, insect infestations, and wildfire, cause loss of life, resources, and human infrastructure. Disaster risk-reduction analysis can be improved with information about past frequency, intensity, and spatial patterns of extreme events. Tree-ring analyses can provide such information: tree rings reflect events as anatomical anomalies or changed growth patterns at an annual- or even sub-annual resolution (Fig. 1). These centuries-long times series of paleo-events are far longer than historical records.
Dendrochronologists embraced information technology in the 1970s and, over time, developed specialized software using data in formatted, plain-text files. Analytical approaches developed in the 80s and 90s for fire-history analysis (Grissino-Mayer 2001) continue to be used and provide a context to analyze other paleo-events; for example, insect infestations (Speer et al. 2010). The early data structures developed for use in these specialty tools became entrenched and continue to be used today, with some awkwardness and significant limitations. They are inadequate to manage event-related tree-ring data that integrate the disciplines of paleoclimatology, ecology, hydrology, and geomorphology.
With PAGES’ support, 15 dendrochronologists1 from five nations attended a workshop addressing PAGES’ Data Stewardship Integrative Activity2. The goal was to highlight the commonalities and differences among event indicators and to develop a general data model for dendrochronological-event data. After discussing the commonalities and differences among indicators, we agreed to utilize and expand the Tree Ring Data Standard, TRiDaS (Jansma et al. 2010) as a data and metadata structure to promote best practices of data stewardship. We concurred that a common data management framework would facilitate analysis without dictating software usage.
We summarized event indicators observable in wood anatomy, chemistry, and size variation, and the metadata necessary to describe them. We developed a preliminary list of event types, indicators, and new metadata for TRiDaS, agreeing to adopt existing, vetted metadata definitions (in particular the Forest Inventory and Analysis - FIA3) rather than developing new ones. We acknowledged that interoperability with NOAA Paleo, the LiPD format, and LinkedEarth data model (McKay and Emile-Geay 2016) is essential. We agreed to contribute to and to expand the LinkedEarth ontology through the "Trees Working Group" and the NOAA WDS-Paleo ontology, to describe paleo-events, provide a catalogue of current practices, and a list of needed analytical and graphical capabilities. Following these agreements we were easily able to develop a list of products, activities, and outreach efforts that can promote the adoption of these data standards.
In closing, participants agreed that there is sufficient need to merit further development of these concepts with a larger and broader international group. We will seek funding to engage the community in collective crowdsourcing and for the scientific effort needed to create the data framework. In adopting common data standards, this effort can serve the needs of land management and disaster risk-reduction analysis to great societal benefit.
links
1http://fhaes.org
2pastglobalchanges.org/science/int-act/data-stewardship
3www.fia.fs.fed.us
affiliations
1USDA Forest Service, Rocky Mountain Research Station, Missoula, USA
2Laboratory of Tree-Ring Research, University of Arizona, Tucson, USA
3NOAA National Centers for Environmental Information's World Data Service for Paleoclimatology, Boulder, USA
contact
Elaine Kennedy Sutherland: esutherlandfs.fed.us
references
McKay NP, Emile-Geay J (2016) Clim Past 12: 1093-1100
Grissino-Mayer H (2001) Tree-Ring Res 57: 115-124
Jansma E et al. (2010) Dendrochronologia 28: 99-130
Julien Emile-Geay1, M.P. Erb2, G.J. Hakim3, E.J. Steig3,4 and D.C. Noone5
Boulder, USA, 2-4 October 2017
Paleoclimate data assimilation has emerged as a powerful approach to understand low-frequency climate variations. Paleo data assimilation blends paleoclimate observations with the dynamical constraints of climate models. The third workshop of the Last Millennium Reanalysis project (LMR; a partner project of PAGES 2k) gathered 40 scientists over three days to share the latest advances in data, methods and investigations of climate dynamics made possible by this framework. The workshop, hosted at the National Center for Atmospheric Research in Boulder, was sponsored by the US National Oceanographic and Atmospheric Administration, with support from PAGES.
Steady progress
Recent years have witnessed an explosion of paleo data assimilation approaches1. The workshop represented a milestone in moving beyond the inaugural LMR release (Hakim et al. 2016). The latest LMR product has benefitted from the greatly expanded coverage of the PAGES2k Consortium (2017) database, as well as proxy system models that take into account multivariate and seasonal dependencies, particularly for tree rings. Additional gains are enabled by efficient predictive models (Perkins and Hakim 2017). A concerted push by the observational community to develop more widely available water isotope datasets (e.g. Iso2k2) offers fresh opportunities to leverage this new technical capability. Paleo data assimilation is agnostic to interpretation, enabling researchers to take advantage of a wider array of paleoclimate observations. The PAGES community is encouraged to continue high-quality syntheses with extensive and standardized metadata annotations, without restricting them to single-variable interpretations (such as whether they are correlated with temperature).
 |
|
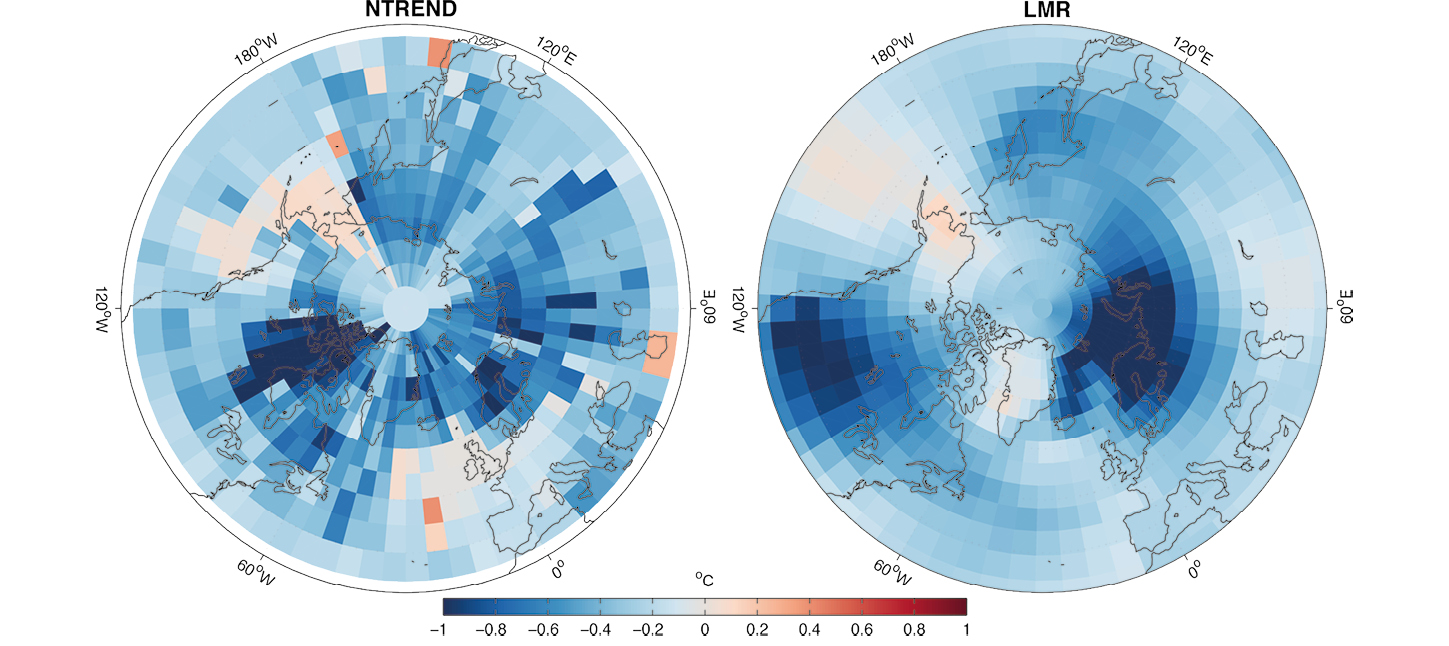
Figure 1: Temperature response to explosive volcanism in two independent temperature field reconstructions, N-TREND (left) and LMR (right). N-TREND (Anchukaitis et al. 2017) reconstructs boreal summer (May-August) mean temperatures using a Point-by-Point regression approach on a temperature sensitive network of 54 tree-ring chronologies across the Northern Hemisphere. Plots show the mean post-eruption temperature anomaly, normalized by the average of the three-year prior to the eruption at each grid point. The 20 eruptions considered here are those equal to or larger than Krakatoa (1883 CE) in the magnitude of maximum global radiative forcing since 750 CE. |
Workshop presentations showed that LMR both reproduces well-established results for the last millennium, such as the hemisphere-average pattern of temperature change, or the thermal response to explosive volcanism (Fig. 1), and provides the opportunity to address new questions. For example, LMR makes it possible to validate dynamical hypotheses for the causes of megadroughts (e.g. Coats et al. 2016), taking advantage of the simultaneous reconstruction of sea-surface temperature, drought indices and geopotential height fields. LMR also provides richer constraints on the climate impacts of volcanic eruptions, assessments of historical drought risk, the dynamics of the Atlantic Multidecadal Oscillation, long-term changes in the Hadley and Walker circulations, and the impact of multidecadal tropical ocean temperature fluctuations on tropical cyclone activity.
A path forward
Discussions at the workshop highlighted several key challenges; addressing them outlines a clear path for further progress. First, while paleo data assimilation enables the reconstruction of nearly any field output by a General Circulation Model, not all can be equally well-constrained or validated. A critical limitation for validation is the lack of homogenous, long-term datasets of the full three-dimensional state of the atmosphere and ocean. Second, there is a need to integrate low-resolution proxy records into paleo data assimilation efforts like LMR, which currently relies almost exclusively on annually resolved records. Blending proxies of monthly to centennial resolution is a new research frontier; the theoretical framework exists (Steiger and Hakim 2016), but urgently needs to be operationalized. Initial reconstructions of the last deglaciation using only marine sediments unveiled promising advances in this regard. Third, proxy system models are key to maximizing the usefulness of paleoclimate observations, but their use still hinges on the availability of high-quality modern observations. Finally, because paleo data assimilation calculations inherit biases from the numerical models they use, purely statistical approaches remain an important complement to the use of dynamical climate models within the assimilation framework.
Building capacity
Beyond the delivery of a multivariate climate field reconstruction, a goal of the LMR project is the release of the underlying assimilation tools. The last day of the workshop featured a "hackathon" designed to enable investigators to run the LMR code (which is open source) and exploit its rich output for their own research. The event helped demystify the "black box" aspects of paleo data assimilation. This exemplified the open-science research model embodied by LMR, and is expected to lead to more stringent validation by a much wider community, as well as unlocking the potential for research applications beyond those considered by the LMR team so far.
links
1pastglobalchanges.org/daps
2pastglobalchanges.org/science/wg/2k-network/projects/iso2k
affiliations
1Department of Earth Science, University of Southern California, Los Angeles, USA
2School of Earth Sciences and Environmental Sustainability, Northern Arizona University, Flagstaff, USA
3Department of Atmospheric Sciences, University of Washington, Seattle, USA
4Department of Earth and Space Sciences, University of Washington, Seattle, USA
5College of Earth, Ocean, and Atmospheric Sciences, Oregon State University, Corvallis, USA
contact
Julien Emile-Geay: julienegusc.edu
references
Anchukaitis KJ et al. (2017) Quat Sci Rev 163: 1-22
Coats S et al (2016) Geophys Res Lett 43: 9886-9894
Hakim GJ et al. (2016) JGR Atmos 121: 6745-6764
PAGES2K Consortium (2017) Sci Data 4: 170088
Basil Davis
Caux, Switzerland, 12-15 June 2017
Fossil pollen provide one of the most widely available sources of proxy climate data for the Quaternary period. Quantitative climate reconstructions from pollen data were first pioneered over 70 years ago (Iversen 1944) and since then the number of different methods has expanded greatly. The PC-MIP workshop was organized with a view to improving collaboration and coordination within the pollen-climate community, to compare and review the main methods currently in use, and to make recommendations for best practice and future development. The first PC-MIP cross-community workshop was attended by 28 researchers from 15 countries, including 14 early-career scientists.
The workshop comes at a time of new methodological innovations such as Bayesian statistics, and the rapidly increasing availability of fossil and modern pollen datasets through public pollen databases such as neotomadb.org. At the same time, we are also increasingly asking more from pollen data such as reconstructions from new regions and earlier time periods, seasonally resolved reconstructions, and always better assessment of uncertainties and potential errors.
The workshop
The first half of the workshop focused on general issues related to all or most methods. Background was provided by invited speakers on the history of pollen–climate transfer functions, common criticisms and problems, and alternative perspectives from non-pollen proxies in the marine and terrestrial domains.
This was then followed by breakout groups looking at a variety of issues, including questions related to which climate variables can be reconstructed, non-analogue vegetation and climate problems, modern calibration data, multi-model and multi-proxy approaches, spatial autocorrelation, pollen productivity and long-distance transport. The uniformitarianism assumption was also discussed in relation to novel climates (such as low CO2 during glacial periods) and the changing influence of human activity, as well as other taphonomic, laboratory and sampling issues.
 |
|
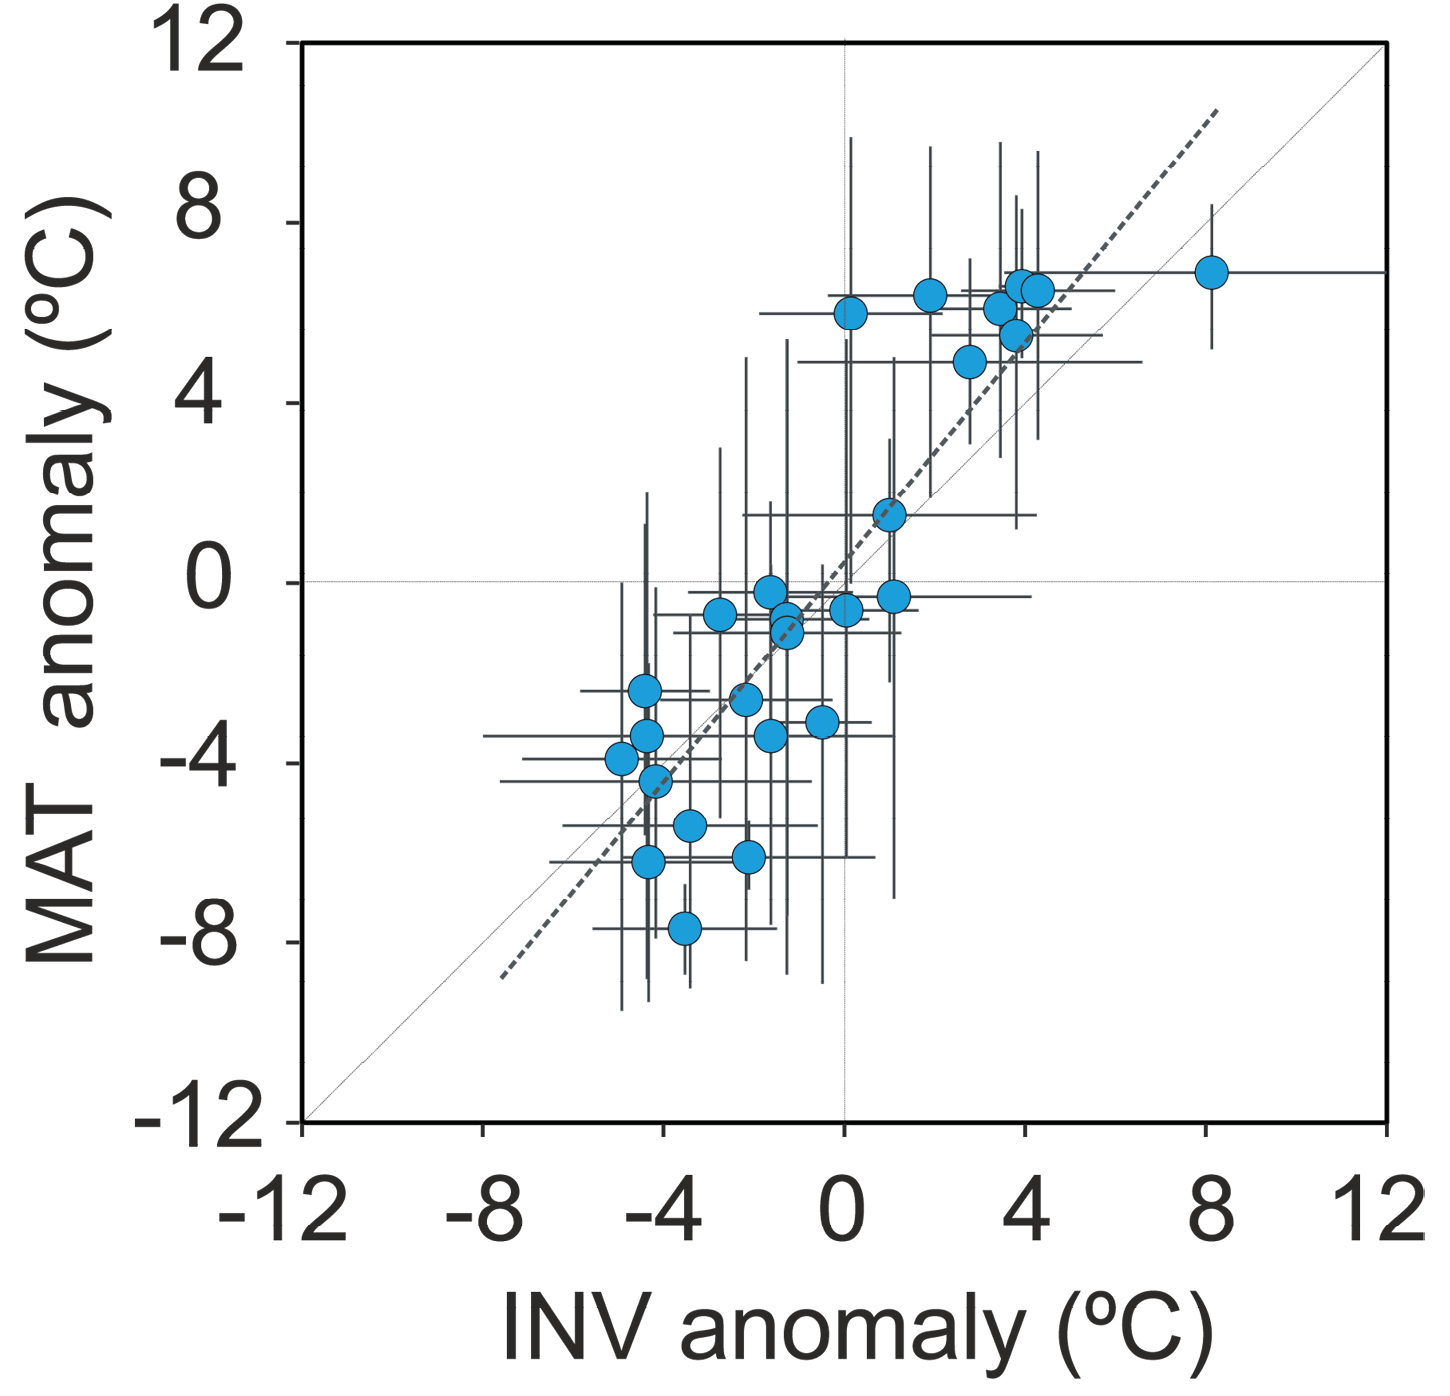
Figure 1: The use of the Modern Analogue Technique (MAT) in the Mediterranean region has been criticized because of potential bias caused by human impact and the possible dominance of precipitation over temperature as a control on vegetation. The Inverse Modeling (INV) method uses a process-based vegetation model to reconstruct the most likely climate to explain a fossil pollen assemblage, independent of the proposed sources of error with MAT. The figure shows a comparison of MAT and INV methods on the same mid-Holocene samples in the region (data from Davis et al. 2003 and Wu et al. 2007). The close agreement between the methods indicates little of the proposed bias in the MAT. |
The second half of the workshop focused on issues specific to certain methods or families of methods. Background was provided by talks on Regression Methods (WA, WA-PLS), Assemblage Methods (MAT, ANN, Response Surfaces), Inverse Modeling, Indicator Methods (PDF, MCR) and Bayesian frameworks (see also Fig. 1). This was then followed by breakout groups to review the various strengths and weaknesses of each method, current and future developments and potential improvements, and the availability of training sets, software and other resources for each method.
Final discussions included development of standardized fossil and modern pollen datasets that will allow a direct "bench-test" comparison between current methods, as well as providing reference datasets to evaluate future methodological improvements. Datasets have already begun to be selected from different time periods and locations, with a particular emphasis on datasets that can be compared with other proxies.
Future plans
The results of the workshop are currently being condensed into a co-authored manuscript that will be submitted in early 2018. A dedicated PC-MIP website will be online soon to provide a guide to current resources for anyone interested in pollen-climate reconstructions. Further smaller, follow-up workshops are planned to complete the standardized test datasets and bench-test evaluation of current methods.
acknowledgements
The workshop was supported by the Swiss National Science Foundation, PAGES, INQUA and the University of Lausanne.
affiliationS
Institute of Earth Surface Dynamics (IDYST), University of Lausanne, Switzerland
contact
Basil Davis: basil.davisunil.ch
references
Davis B et al. (2003) Quat Sci Rev 22: 1701-1716
Qiong Zhang1, J.C. Hargreaves2, P. Braconnot3 and M. Kageyama3
1st PMIP4 conference, Stockholm, Sweden, 25-29 September 2017
The scientific focus of the Paleoclimate Modelling Intercomparison Project (PMIP) is to understand the response of the climate system to different forcings that have occurred at various periods prior to the historical instrumental record. Climate models are primarily constructed to understand modern climate and predict future climate evolution. These models are developed based on scientific understanding gained from studying the climate of the recent past. Past periods when the climate was radically different provide a useful test of model performance. The quantity of observational information on past climate, based on physical, chemical and biological records, is also increasing, providing more opportunities for quantitative evaluation of models.
 |
|
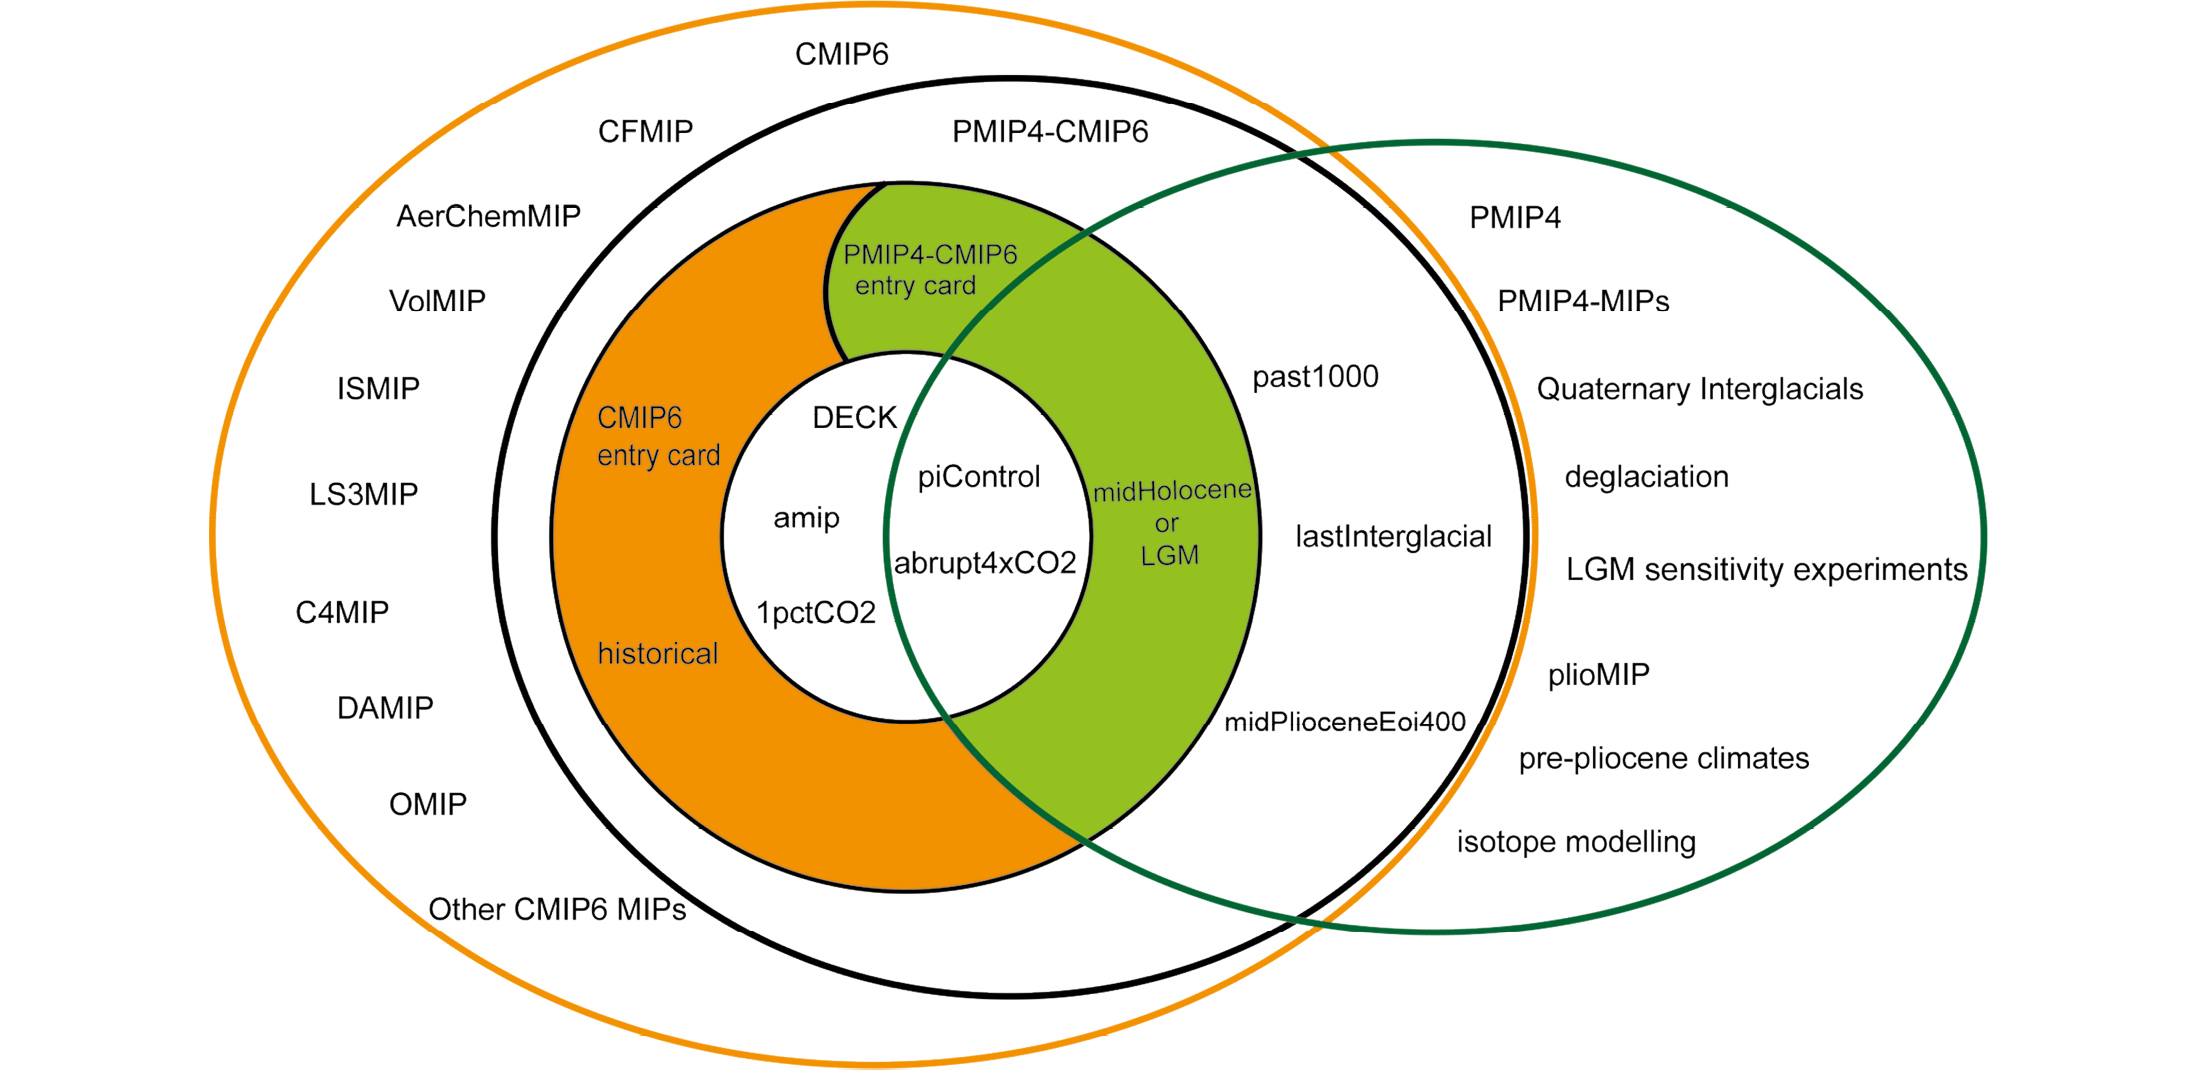
Figure 1: The PMIP4/CMIP6 experiments in the framework of CMIP6, link with other MIPs, and in the framework of PMIP4, with its working groups (Kageyama et al. 2016). The overview and overarching analyses plan for PMIP4 experiments are documented in Kageyama et al. (2016), the series of PMIP4 protocol documents on scientific objectives and experiment design include the two interglacials (Otto-Bliesner et al. 2017), the Last Millennium (Jungclaus et al. 2017), the Last Glacial Maximum (Kageyama et al. 2017), and mid-Pliocene (Haywood et al. 2016). |
PMIP is now in its fourth phase. Five of the PMIP4 experiments are included within the Coupled Model Intercomparison Project Phase 6 (CMIP6), and a number of the PMIP4 working groups are organizing additional experiments covering a broader range of topics (Fig. 1). The results from all of the experiments will provide a substantial contribution to the Intergovernmental Panel on Climate Change Sixth Assessment Report (IPCC AR6). New analyses will focus on climate sensitivity, changes in the hydrological cycle, physical and biogeochemical feedbacks, climate variability, and the credibility of the climate models which are used for future climate projections.
This first PMIP4 conference brought together 160 researchers from 24 countries. New, in-depth analyses from PMIP3 were presented as well as some first results from the new PMIP4 simulations. All participants gave a short oral presentation so that attendees gained an overview of all the ongoing activities, and to focus discussions at the subsequent poster sessions. A number of new initiatives in data synthesis are underway, and these were given slightly longer oral presentations. Eight speakers from outside the PMIP community gave stimulating, perspective talks. The last day of the conference was devoted to the connection of PMIP4 to CMIP6 and IPCC AR6. For the IPCC AR6, paleoclimate science will be included throughout the report rather than being an isolated chapter. Discussions considered how the key foci of PMIP4 could contribute to the different AR6 chapters where paleoclimate is relevant.
The conference provided opportunities for early-career scientists to develop networks within PMIP. Several of them led activities and discussions, and proposed to (1) have more synergy and interaction between PMIP and PAGES; (2) bring water isotope modeling into PMIP experiments, and make it a standard output; (3) use proxy system models (e.g. PRYSM) for all model-proxy comparisons using PMIP data; and (4) develop a standard approach to synthesize the model and proxy data in the PMIP community, to ensure scientists outside of each respective community can use the data in an appropriate way.
acknowledgements
The PMIP4 conference was co-sponsored by PAGES, Swedish Research Council and the Bolin Centre for Climate Research at Stockholm University.
affiliations
1Department of Physical Geography and Bolin Centre for Climate Research, Stockholm University, Sweden
2BlueSkiesResearch, Settle, UK
3LSCE/IPSL, CEA-CNRS-UVSQ, Université Paris-Saclay, France
contact
Qiong Zhang: qiong.zhangnatgeo.su.se
references
Haywood A et al. (2016) Clim Past 12: 663-675
Jungclaus J et al. (2017) Geosci Model Dev 10: 4005-4033
Kageyama M et al. (2016) Geosci Model Dev Discuss
Kageyama M et al. (2017) Geosci Model Dev 10: 4035-4055
Otto-Bliesner B et al. (2017) Geosci Model Dev 10: 3979-4003
David W. Beilman1, I. Lawson2 and Z. Yu3
Honolulu, USA, 7-9 June 2017
 |
|
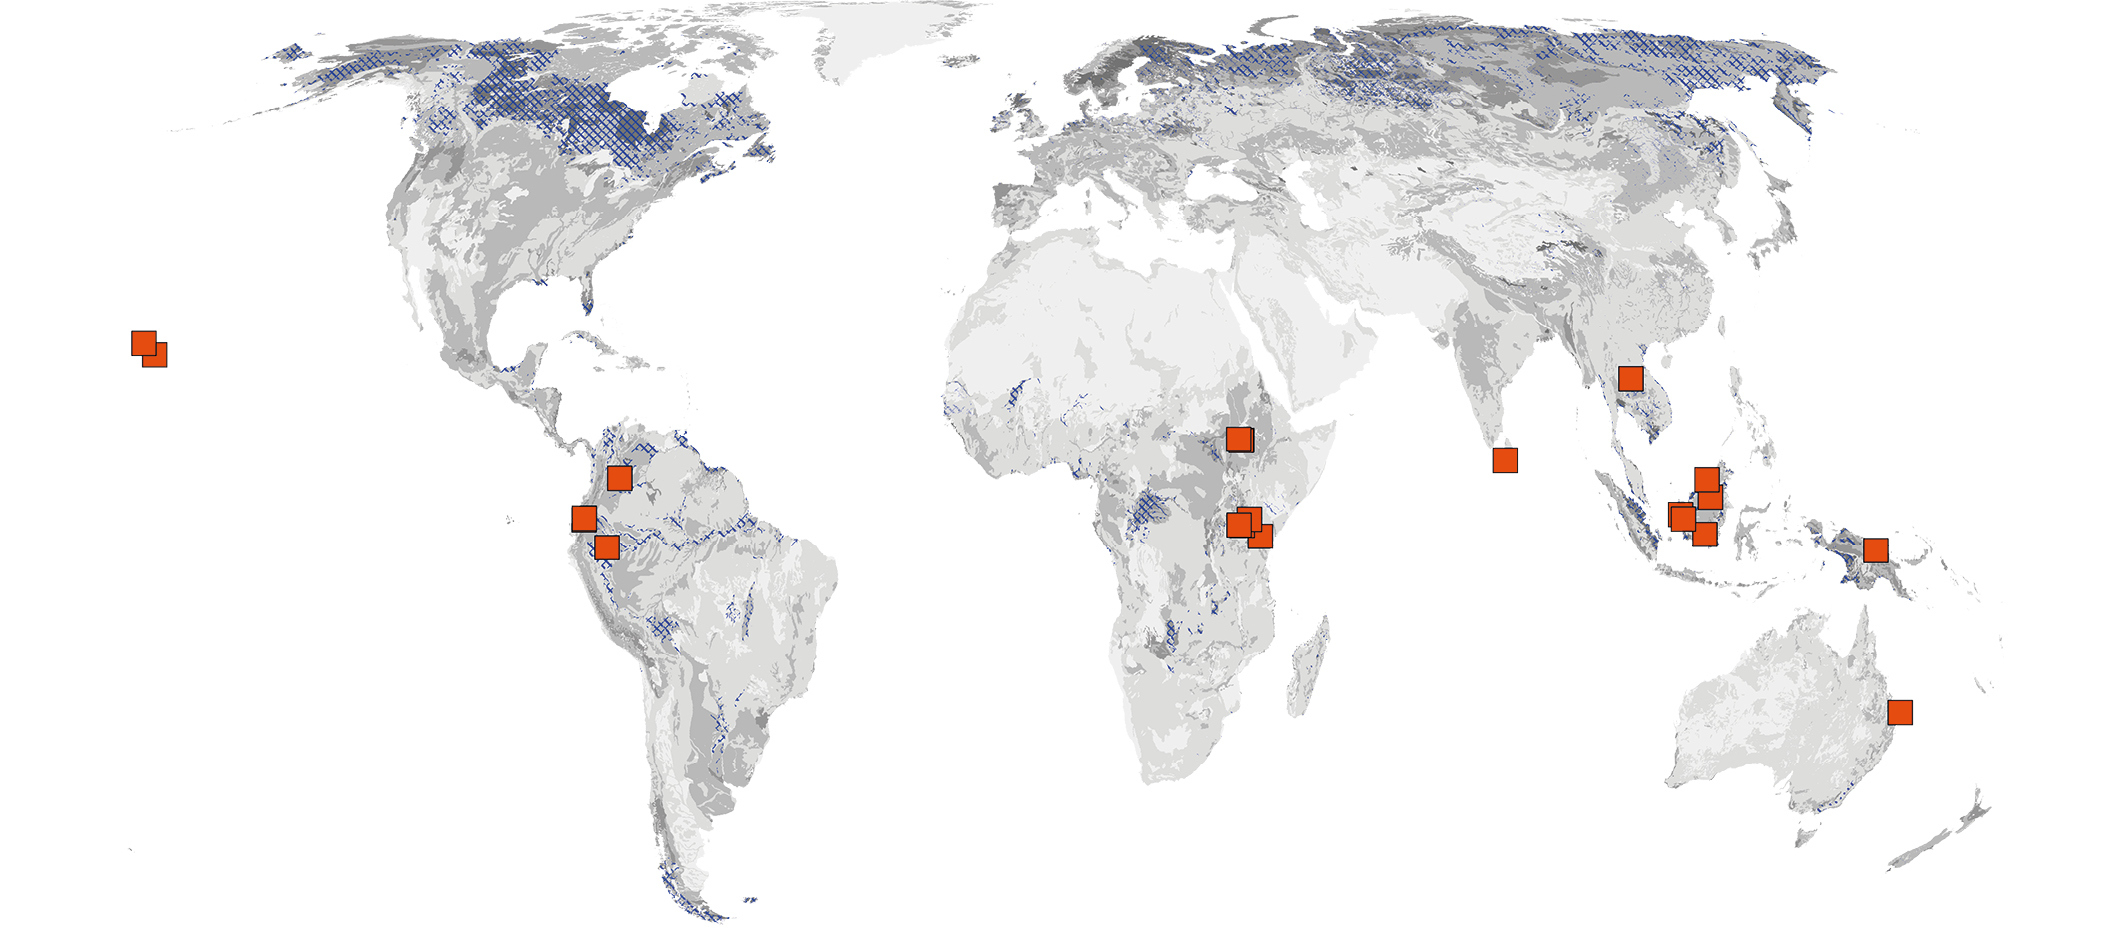
Figure 1: Location of study sites and regions with research results discussed at the TropPEAT workshop (red squares) along with peatland distributions in blue hatching (Yu et al. 2010) and global soil carbon density (<5, 6-10, 11-20, 21-40, >41 kg C m-2; IGBP-DIS) in gray shades. |
Carbon in peat is one of Earth’s single largest, organic, carbon pools. Recent improvements in estimates suggest that low-latitude, carbon-rich peatlands cover 387-657 thousand km2, hold more than 100 gigatonnes of sequestered carbon (Page et al. 2011; Dargie et al. 2017) concentrated in regional hotspots, and have been the largest component of natural wetland methane emissions globally since the pre-Industrial period (Paudel et al. 2016). Significant strides in research have been made recently (Dargie et al. 2017; Dommain et al. 2014; Sjorgersten et al. 2014), but peatlands globally, and tropical peatlands specifically, remain poorly understood compared to other terrestrial ecosystems.
The C-PEAT working group (see: pastglobalchanges.org/c-peat), launched in 2014, identified several key subtopics related to global peat carbon including low-latitude peatlands. As part of C-PEAT’s Phase 1, 20 experts and working group members came together in early June. Half of the participants were early-career or scientists from developing countries with expertise in understudied tropical regions. Our primary goals were to identify data and knowledge gaps in understanding low-latitude, peat-forming systems and to facilitate new collaborations and studies across geographies and career stages. From the many discussions at the meeting, two main research topics emerged.
Where and how old are low-latitude, peat-forming ecosystems?
A complete and accurate map of tropical peatland distribution remains elusive (Yu et al. 2010) owing to limitations in data, methodology and logistics. As a near-term goal, key regions were identified where high-quality data exists or can be derived for low-latitude wetland distributions. With regional expert input from workshop participants, these are being compiled in a format to serve as validation data for Earth system model simulations (Kleinen et al. 2012).
What are the controls on low-latitude peat carbon formation?
In contrast to cold, high-latitude soils with inherently limited microbial decomposition, tropical peatlands have different organic matter stabilization mechanisms with different vulnerabilities. Discussions of peat formation processes focused on the critical roles of topography (slopes, floodplains), hydroclimatic variability (orographic effects, fog inputs, monsoon climates), the rate and geography of human activities (logging, palm oil, traditional land use), and interactions with other disturbances (flooding, fire) over timescales longer than polar peat carbon (through the Last Glacial Maximum and MIS3). A special issue publication is being planned as a venue for the discussed ideas and research conducted by participants.
A meeting took place at the AGU Fall 2017 Annual Meeting in New Orleans. C-PEAT Phase 2, currently in the planning and proposal stage, would continue activities in low-latitude peatland science.
affiliations
1Department of Geography, University of Hawaii at Manoa, Honolulu, USA
2School of Geography and Sustainable Development, University of St. Andrews, UK
3Earth and Environmental Sciences Lehigh University, Bethlehem, USA
contact
Dave Beilman: beilmanhawaii.edu
references
Dargie GC et al. (2017) Nature 542: 86-90
Dommain R et al. (2014) Quat Sci Rev 97: 1-32
Kleinen T et al. (2012) Biogeosci 9: 235-248
Page SE et al. (2011) Glob Change Biol 17: 798-818
Paudel R et al. (2016) Env Res Lett 11: 034020
Sjorgersten S et al. (2014) Glob Biogeochem Cycles 28: 1371-1386