PAGES Magazine articles
Amy Myrbo1, S. Loeffler1, A.L.C. Shinneman2 and R. McEwan3
Open-data-based geovisualizations including Flyover Country can engage students and the general public with science. Mobile technology allows data and visualizations to be brought into the field, facilitating discovery while users explore the natural world in real life.
Software tools that harness open-paleodata resources are opening new frontiers for education, public outreach, and citizen science. The ability to easily and seamlessly map and visualize disparate proxy datasets from multiple databases enables not only new research insights into past Earth system dynamics, but new opportunities for formal and informal education. The free, National Science Foundation (NSF)-funded Flyover Country mobile app (flyovercountry.io) takes such an approach; displaying the current location engages the user with place-based, on-demand access to real data and to ongoing scientific research. Bringing students and the general public science about the places they love – sometimes literally in their own backyard – supports place-based education (Semken 2005; Apple et al. 2014) and outreach, thereby acting as gateways for new audiences into science and scientific ways of thinking, as well as interaction with publicly funded scientific research. The ability to easily cache data to a mobile device means that users can take advantage of scientific data even while offline, outdoors, in remote settings. Here, we briefly summarize how the intersection of open scientific databases and mobile platforms is creating new opportunities for traditional classroom teaching, self-directed field trips by undergraduates or casual travelers, and citizen science.
Classroom-oriented resources increasingly use content from open, community-curated scientific data resources (CCDRs) as foundations for students to explore past global changes. For example, as of July 2018, SERC (the Science Education Resource Center at Carleton College, USA) hosted over 30 classroom activities using either the Neotoma Database (Williams et al. 2018) or the Paleobiology Database (PBDB; Uhen et al. 2013). The ability to overlay multiple datasets in a single visualization – floral and faunal records; ice-sheet and sea-level positions; tectonic plate paleolocations, etc. – is available directly in some CCDRs’ online resources (e.g. Neotoma Explorer, PBDB Navigator, GeoMapApp), so they are readily adapted to support classroom lessons.
 |
|
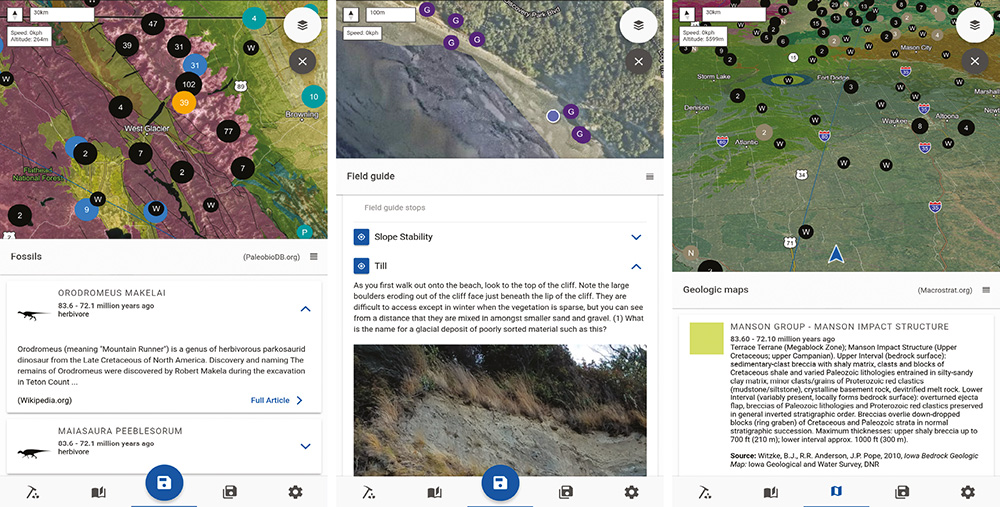
Figure 1: Examples of the Flyover Country mobile app interface. Left: Dots locating fossil localities from PBDB (teal and orange [currently selected]), Wikipedia articles (black), and continental sediment cores (blue), overlain on a satellite image and geologic map. Wikipedia articles on the dinosaur taxa found near the orange dot are shown below. Center: An instructor-submitted field-trip guide showing field trip stops (purple dots) and the user’s current location (blue dot with white outline). Field-trip content and photo are shown below. Right: Navigation mode changes the frame of reference to match direction of travel. Gray dots are fossil localities from Neotoma, black dots from Wikipedia. Geologic map unit information from Macrostrat is shown below. |
Mobile apps such as Flyover Country (Fig. 1) and Rockd (Schott 2017) extend this functionality to the outdoors. Students can use these apps to access data about a location while in the classroom or field, supporting place-based education (Semken et al. 2005; Apple et al. 2014), which uses the “hook” of a learner’s hometown or homeland to communicate the relevance and excitement of the sciences. Place-based education is an especially effective approach to engaging and entraining students into the geosciences, especially members of groups who strongly identify with places, such as many Indigenous people, recent immigrants, and members of rural communities. Whether the setting is a remote landscape or a concrete-covered city, geoscience plays a fundamental role (e.g. Sanderson 2009; Broad 2018): the location, layout, economy, population structure, human history, and amenities of a place are strongly influenced by the underlying geology, climate, ecology, and geomorphology.
 |
|
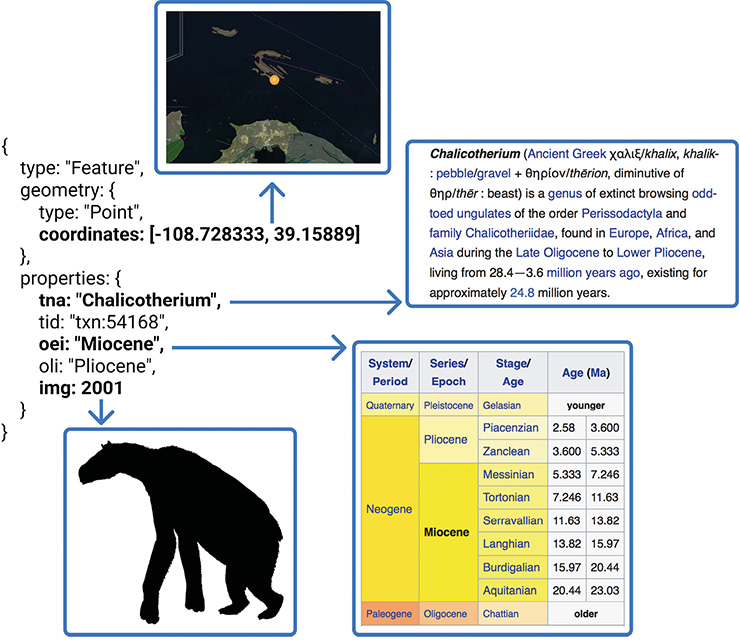
Figure 2: Flyover Country enriches sparse data by using text returned from PBDB to call to other data resources: in addition to plotting the coordinates of the fossil locality on the map, the taxon (Chalicotherium) and age (Miocene) are used to obtain the relevant Wikipedia articles, and the PhyloPic ID is used to obtain a silhouette of the extinct organism. |
Flyover Country fills a need for travelers, delivering interesting information about the landscape as seen out the airplane, train, or car window. The app calls data from Macrostrat (Peters et al. 2018), Neotoma, PBDB, Wikipedia, and OpenCoreData (opencoredata.org). Information in the app has global coverage, with data density dependent upon content in the databases. Flyover Country also links and enriches sparse datasets: for instance, taxon name and age for a fossil specimen returned from PBDB are used to call to other resources, including PhyloPic (phylopic.org) for a silhouette of the taxon reconstructed and Wikipedia for the articles about that taxon and geologic time period (Fig. 2). Because maps are readily understood by people of all languages and countries, Flyover Country is appealing to users worldwide. The app’s large userbase (240,000 downloads as of August 2018), reflecting a high level of interest from the general public in paleodata and related scientific information, promotes a virtuous cycle that encourages additional data resources to expose their data through Flyover Country. New data sources being added include datasets from IEDA databases (iedadata.org), state and federal geological surveys, additional paleobiological resources, tectonic plate reconstructions from GPlates (gplates.org), physiographic regions from Natural Earth Data (naturalearthdata.com), and articles from other languages’ Wikipedia databases.
Mobile tools like Flyover Country also create exciting new opportunities to enrich field experiences for undergraduates and the undergraduate geoscience curriculum. Field experiences at the introductory level have been shown to improve student satisfaction and likelihood to select and persist in the geosciences (Karabinos et al. 1992; Wilson 2018; Wolfe 2018). However, logistical challenges at institutions (Bursztyn et al. 2017), as well as work, family duties, and financial hardship particularly common to students from groups underrepresented in the geosciences (Bueno Watts et al. 2014) can restrict students’ ability to participate in class field trips. Faculty may provide alternative activities that are classroom- or homework-based, but these miss the opportunity to get students out into the field, making observations, developing questions, seeing real rocks and organisms, and connecting course content with the world they experience. Using mobile devices to present instructor-developed field-trip content and the user’s GPS location allows students to take independent field trips that fit their own schedules. Such an approach can engage students in ways similar to instructor-led trips, which could broaden participation in the field component of undergraduate courses, and thus help broaden participation in the geosciences overall.
Mobile apps can also access and help disseminate narrative- and location-based resources, such as field-trip guides from conference guidebooks and undergraduate courses. For example, a database of georeferenced field-trip guides sourced mainly from Geological Society of America guidebooks has been developed as part of Flyover Country and is available for use in any software tool. This database is open for new contributions at z.umn.edu/fcfg. Furthermore, these field trips are spatially discoverable, so users can find them without prior knowledge or possession of the guidebooks or course material.
Mobile apps can also be used to generate data, not just disseminate it, by encouraging citizen science (e.g. Bonney et al. 2014). For example, the Rockd app crowdsources images of outcrops that can ultimately be aggregated and used in scientific studies, and Flyover Country is connecting to NASA’s GLOBE Observer app to crowdsource ground-cover photographs to improve remote sensing information. As in well-established biodiversity and conservation-oriented citizen-science projects such as eBird (ebird.org) and iNaturalist (inaturalist.org), upload of new data to the project database can be facilitated through apps, and the user can see their data visualized on the map in the app in near-real time alongside data from both citizen scientists and professionals.
The future opportunities for development of education and outreach using open paleodata are equally exciting. App development is well within the capacity of small research/outreach teams with both scientific and software development skills; many materials supporting self-taught coding are available online (e.g. edx.org, which hosts courses from many institutions). Augmented reality offers new ways of overlaying data onto outcrops and landscapes viewed by the mobile device's camera (similar to star-map apps for the night sky, or the PeakFinder mobile app, peakfinder.org), further helping students and the public understand the geoscientific way of seeing. Similarly, inclusion of new high-quality narrative and visual content such as Esri Story Maps (storymaps.arcgis.com) and additional professional and crowdsourced field-trip guides bring decades of research to these new audiences. The developing field of semi-automated “text leveling” (e.g. newsela.com) when combined with geoscience semantics and ontologies, could help “translate” large volumes of content written for experts into material suitable for the general public. The availability of paleo and geoscience data in integrated travel systems (e.g. inflight entertainment, passenger trains and buses, self-driving cars) can bring the excitement of discovery, closely embedded in a sense of place, to new audiences worldwide.
acknowledgements
Flyover Country is supported by eight NSF awards, including 1338322, 1462297, 1541800, 1550913, and 1643277.
affiliations
1CSDCO/LacCore and Department of Earth Sciences, University of Minnesota, Minneapolis, USA
2Interdisciplinary Arts and Sciences, University of Washington – Bothell, USA
3Academic Health Center - Information Systems, University of Minnesota, Minneapolis, USA
contact
Amy Myrbo: amyrbo umn.edu (amyrbo[at]umn[dot]edu)
references
Apple J et al. (2014) J Geosci Edu 62: 1-4
Bonney R et al. (2014) Science 343: 1436-1437
Bursztyn N et al. (2017) GSA Today 27: 4-11
Broad WJ (2018) How the ice age shaped New York.” New York Times, accessed 22 August 2018
Karabinos P et al. (1992) J Geol Edu 40: 302-305
Peters SE et al. (2018) Geochem Geophys Geosys 19: 1393-1409
Sanderson E (2009) Mannahatta: A Natural History of New York City. Abrams, 352 pp
Schott R (2017) Bulletin 67: 1-4
Semken S (2005) J Geosci Edu 53: 149-157
Uhen MD et al. (2013) J Vert Paleontol 33: 13-28
Williams JW et al. (2018) Quat Res 89: 156–177
Wilson C (2018) Status of recent geoscience graduates 2017. American Geosciences Institute, 49 pp
Gregory Hakim1, S. Dee2, J. Emile-Geay3, N. McKay4 and K. Rehfeld5
 |
|
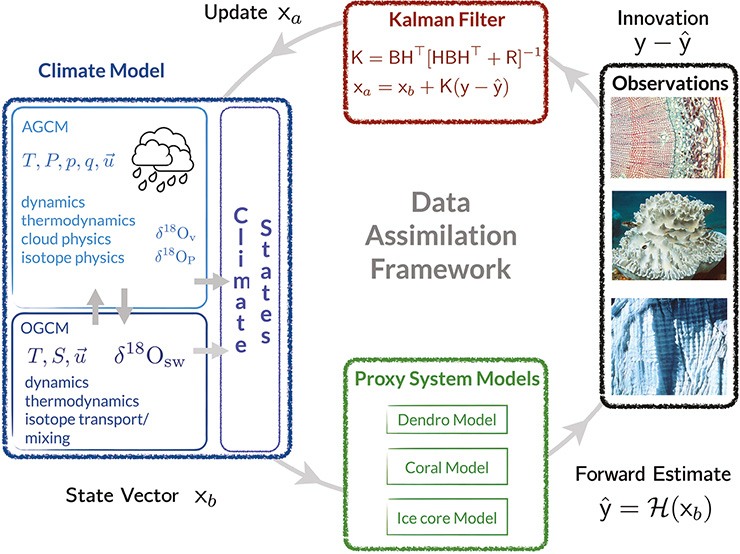
Figure 1: DA uses climate variables to estimate proxy values using PSMs, which can then be compared with the actual proxy values. The difference between these values (new information about the climate state) is weighted (“K”) by the error in the proxies relative to the estimate from the climate model; most important, DA also spreads this information in space and to other climate variables. From Hakim et al. (2016). |
Weather prediction has undergone a “quiet revolution” in recent decades (Bauer et al. 2015), fueled by increasing observations and the capability to assimilate them into increasingly sophisticated numerical models. Paleoclimatology today is at the cusp of such a revolution, moving away from a focus on single-site studies to the assimilation of global, multiproxy data streams into climate models (e.g. Brönnimann et al. 2013; Goosse 2016; Hakim et al. 2016; Franke et al. 2017) thanks to (1) advances in data assimilation (DA) methodology; (2) open, standardized paleoclimate datasets; and (3) proxy system models (PSMs). A critical element of DA that allows this synthesis involves mapping information from climate models to proxy measurements through PSMs (e.g. Dee et al. 2015). DA weighs the information from proxies against a climate-model simulation of the proxy value, and spreads that information in space and to other climate variables (Fig. 1). Future progress depends strongly on openness and standardization of paleoclimate proxy data, so we describe here the dependence of DA on open paleoclimate data, emerging standards, and ideas for accelerating progress.
Openness in data sharing and standardization
The currently highly heterogeneous nature of the proxy records is the main limitation to DA progress. Improvements involve three components common in data science: (1) data distribution, (2) data standardization, and (3) data-revision tracking.
Over the past two decades, distribution of paleoclimate proxy data has migrated from individual scientists sharing their data to centralized data centers, such as the World Data Service for Paleoclimatology, the International Tree Ring Databank, Neotoma, and Pangaea; however, large amounts of data have not yet been transferred to public repositories. Curated versions of paleoclimate data from these centers and from the literature, through quality control and screening, have proven critical to recent synthesis efforts (e.g. PAGES 2k Network projects). However, because these curated versions do not track uniquely from the original proxy data, future efforts either have to work with these “forks” from the source, or substantially duplicate effort by returning to the original data. Having the ability to track data from the source through the forks would allow for robust branching without returning to sources to begin anew.
Climate model output is available in standard format (NetCDF), with conventions for units and variable naming (cfconventions.org). Ongoing efforts combine PSMs in a standardized and open-source framework (e.g. PRYSM; Dee et al. 2015), but such standardization is just beginning for paleoclimate data. For example, the Linked Paleo Data (LiPD) format (McKay and Emile-Geay 2016 and this issue) provides a universal, flexible container for a wide range of paleoclimate data. Because LiPD’s structure and terminology are inspired by the PSM framework, it is a natural format for DA codes, since LiPD metadata can direct PSM selection for a particular dataset. Although the emergence of LiPD offers the potential for a large increase in efficiently using proxy data in DA applications, most proxy data remain to be converted to LiPD format.
Future directions
Data standardization is the area where the greatest immediate impact can be experienced. Widespread adoption of LiPD across proxy archives would greatly facilitate the reuse of proxy data and synthesis efforts, as would standardized revision histories. As much as revision tracking has transformed productivity in software development with distributed version control software such as Git, similar practices for proxy data are compelling.
One speculative future direction involves decentralized ledgers for proxy data. Cryptographically secure ledgers, such as Bitcoin’s blockchain, contain unalterable revision history that do not depend upon a central authority. For paleoclimate proxy data, this technology could be used to allow anyone to correct errors and, through a consensus algorithm, add revisions to the public ledger. One can imagine motivating public participation with micropayments of Bitcoin. A small amount of funding distributed in this way could offer rapid progress to cleaning the “bugs” from proxy data archives, with the added benefit of citizen scientist participation in paleoclimate research.
affiliations
1Department of Atmospheric Sciences, University of Washington, Seattle, USA
2University of Texas, Institute for Geophysics, Austin, USA
3University of Southern California, Los Angeles, USA
4Northern Arizona University, Flagstaff, USA
5Institute of Environmental Physics, Ruprecht-Karls-Universitaet Heidelberg, Germany
contact
Gregory Hakim: ghakimuw.edu (ghakim[at]uw[dot]edu)
references
Bauer P et al. (2015) Nature 525: 47-55
Brönniman S et al. (2013) PAGES news 21: 74-75
target="_blank">Dee S et al. (2015) J Adv Model Earth Sys 7: 1220-1247
Franke J et al. (2017) Sci data 4: 170076
Goosse H (2016) J Adv Model Earth Sys 8: 1501-1503
Elizabeth Bradley, T.H. Nelson and L. Rassbach de Vesine
 |
|
Figure 1: Screenshots of CSciBox building an age model for a marine-sediment core from the Gulf of Mexico (Xie et al. 2012). (A) raw 14C ages (•), (B) linear regression, (C) piecewise-linear interpolation, and (D) Bacon model. All plots are age in years BP vs. depth in meters. (◼︎) indicates an age point that has been corrected for reservoir age and undergone a CALIB-style calibration. |
Artificial intelligence (AI) provides major opportunities for scientific analysis. Automated reasoners can explore problem spaces quickly and alert practitioners to possibilities that they had not considered. As a case in point, we describe the CSciBox system. Working with data from a paleorecord, such as 14C dates from a sediment core (Fig. 1a) or 18O values from an ice core, CSciBox produces a set of age-depth models, plus a description of how each one was built and an assessment of its quality.
The AI field has two branches: symbolic methods capture human reasoning in closed form; statistical methods such as neural networks, aka “machine learning” (ML), fit sophisticated models to sets of labeled examples. Both have strengths and weaknesses. ML methods are powerful, but training them requires a large number of examples. This is problematic in the context of age-depth models, where there is rarely more than one published example for each core. The symbolic AI approach has its own challenges: human reasoning is remarkably difficult to capture in formalized, useful ways. However, an AI system seeded with that kind of knowledge can narrate its choices and explain its actions as it solves problems – an absolutely essential feature for a scientific assistant, and one that ML methods cannot provide.
CSciBox marries these two different types of approaches. Its toolbox includes a number of traditional data-analysis methods, along with a set of statistical methods that model the different underlying physical processes (e.g. sediment accumulation). A symbolic AI engine explores the search space of possible age-depth models: choosing among those methods, invoking them on the appropriate data fields with appropriate parameter values, analyzing the results, making appropriate modifications, and iterating until the results match the scientist’s physical understanding of the world.
There can be evidence and reasoning both in favor of and against any given age model. CSciBox uses one of the few AI techniques that handle this situation, “argumentation” (Bench-Capon and Dunne 2007), which involves constructing all arguments for and against each candidate age model and then weighing them against one another (Rassbach et al. 2011). In the case of the data in Figure 1(a), CSciBox reasons from the latitude and longitude of the core to choose the IntCal marine 13 curve (Reimer et al. 2013) and the reservoir-age correction (calib.org/marine), then searches for an age-depth model to fit the calibrated, corrected age points. It first tries linear regression but discards the resulting model because the argument against it (large observed residuals) is stronger than those in favor (consistent slope, no reversals). It then tries piecewise-linear interpolation, producing the age model shown in panel C of the figure, but finds that that, too, is a bad solution (low residuals but inconsistent slope and presence of reversals). CSciBox then builds and evaluates an age-depth model using Bacon (Blaauw and Christen 2011), constructing and balancing arguments about the consistency of the slope (good) and the size of the residuals (small) against the fact that Bacon does not converge to a single distribution – as is clear from Figure 1d – and that some of the age points are outside the error bounds.
Like many powerful tools, Bacon’s actions are guided by a number of free parameters. CSciBox encodes a number of rules that capture how experts tune those parameter values, which it uses to explore the parameter space and improve the Bacon model. This is a major advance; tools like Bacon are very powerful, but they can be difficult to use. At the end of the exploration process, CSciBox presents the strongest model to the user, together with a full narration of the process involved in building it. CSciBox uses LiPD (McKay and Emile-Geay 2016) to store all of this information (data and metadata), making the analyses completely documented and reproducible, as well as smoothly interoperable with any other LiPD-enabled software. Like LiPD, CSciBox is open-source; see Bradley et al. (2018) for code and documentation.
acknowledgements
This material is based upon work sponsored by the National Science Foundation (#1245947).
affiliations
Department of Computer Science, University of Colorado at Boulder, USA
contact
Elizabeth Bradley: lizbcs.colorado.edu
references
Bench-Capon T, Dunne PE (2007) Artif Intell 171: 619-641
Blaauw M, Christen JA (2011) Bayesian Anal 6: 457-474
Bradley E et al. (2018) CSciBox - building age models of paleorecords. Zenodo
McKay NP, Emile-Geay J (2016) Clim Past 12: 1093-1100
Rassbach L et al. (2011) AI Mag 32: 69-78
Nicholas P. McKay1 and Julien Emile-Geay2
Paleoclimatology is a remarkably diverse field of research, revolving around hard-won and complex datasets that typically represent hundreds of hours of field work, laboratory analyses and nuanced interpretation. Integrating those diverse datasets to piece together a spatio-temporal understanding of how, when and why climate has changed in the past is a grand challenge of paleoclimatology; one that requires careful handling of these data and their interpretations. Researchers often spend up to 80% of their time collecting, organizing and formatting data, before they can even begin addressing the questions they set out to tackle (Dasu and Johnson 2003). This was certainly our experience, and is why we developed the Linked Paleo Data (LiPD) framework. As the number of records relevant to paleoclimate research continues to grow, and the methodologies for investigating datasets and data networks become more complex, our community cannot afford to continue wasting time on data wrangling when there’s so much science to be done!
The linked paleodata solution
The technical details of LiPD are presented in McKay and Emile Geay (2016), but the concept is simple: LiPD provides a flexible structure that contains and describes any paleoclimatic or paleoenvironmental dataset, the metadata that describe the details and complexity of the data (at any level from observations to collections), as well as models that accompany the data and their output, such as age models and their ensemble output. This powers efficient, 21st century scientific workflows, and enables open science and reproducible research.
This is why LiPD has been used by multiple data-intensive PAGES working groups, including the 2k Network Temperature Database (PAGES 2k Consortium 2017), and Iso2k1. Being able to rely on consistently structured data with rich metadata has greatly reduced the “time to science” for projects relying on the PAGES 2k database, such as the forthcoming global temperature reconstruction intercomparison2, and the Last Millennium Reanalysis project.
Having structured and standardized data also enables efficient access to state-of-the-art analysis tools. One example is age-uncertain data analysis using the GeoChronR package3. GeoChronR relies on LiPD’s capacity to contain and describe age-model ensembles to simplify quantifying the effects of age uncertainty on paleoclimate analysis. For example, quantifying and visualizing the impact of age uncertainty on a calibration-in-time with temperature, both on the regression model and the reconstruction back in time, is greatly simplified with LiPD and GeoChronR4.
A growing LiPD “ecosystem”
 |
|
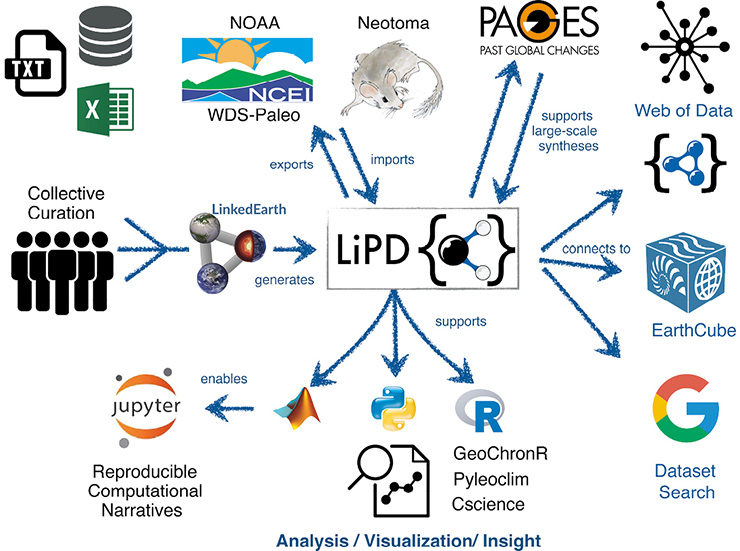
Figure 1: The LiPD ecosystem: a growing network of scientific communities, data repositories, and analysis tools connected and enabled by LiPD. |
Data standards and formats are only as useful as the breadth of their adoption. Thankfully, a LiPD “ecosystem” of datasets, standards, and tools is emerging (Fig. 1).
Datasets: More than 3000 datasets have now been formatted as LiPD files, largely as part of PAGES working group efforts. These data are archived at WDS-Paleo and LinkedEarth (Gil et al. 2017). LiPD is also well suited to serve as an “interchange format”, facilitating the transfer of datasets from researchers to repositories and tools. As LiPD is not tied to any particular repository, initial connectivity with WDS-Paleo and Neotoma has been developed, and two-way interoperability with other repositories, including LacCore, and Open Core Data is forthcoming as part of the Throughput project5.
Standards: From the outset, LiPD was designed to support “Linked Open Data”, an international effort to connect data and concepts and make them broadly accessible through the semantic web6. As part of the LinkedEarth project, we created the “LiPD Ontology”, the first ontology for paleoclimatology7. LiPD also enables community-developed data standards (Emile-Geay and McKay 2016; Emile-Geay et al., this issue), including WDS-Paleo’s controlled vocabulary8.
Tools: A wide range of tools that “speak” LiPD have been developed. This includes the LiPD Utilities, which provide basic functionality for reading, writing and querying LiPD data in R, Matlab and Python, and provides the base-level functionality for more sophisticated packages, including GeoChronR9 and Pyleoclim10. A rich set of interactive, graphical, web-based tools for creating and modifying LiPD files has been created at lipd.net. CScience, an AI-powered tool for age modeling uses LiPD as an input and output format (Bradley et al., this issue).
LiPD has always been collaborative and open-source, and we look forward to the continued expansion and evolution of these data, standards and tools by the community. To learn more about LiPD, how to use if for your research, and upcoming training opportunities, please visit lipd.net
affiliations
1School of Earth & Sustainability, Northern Arizona University, Flagstaff, USA
2Department of Earth Sciences, University of Southern California, Los Angeles, USA
contact
Nicholas P. McKay: Nicholas.McKaynau.edu
references
Dasu T, Johnson T (2003) Exploratory Data Mining and Data Cleaning. Wiley, 212 pp
Emile-Geay J, McKay NP (2016) PAGES Mag 24: 47
Gil Y et al. (2017) The Semantic Web – ISWC 2017: 231-246
McKay NP, Emile-Geay J (2016) Clim Past 12: 1093-1100
PAGES 2k Consortium (2017) Sci Data 4: 170088
Links
1pastglobalchanges.org/science/wg/2k-network/projects/iso2k
2pastglobalchanges.org/science/wg/2k-network/projects/gmst-recon-2k
3>nickmckay.github.io/LinkedEarth-Neotoma-P418/LE-Neo_UseCase.html
6w3.org/DesignIssues/LinkedData.html
8ncdc.noaa.gov/data-access/paleoclimatology-data/contributing
Jeremiah Marsicek1, S.J. Goring2, S.A. Marcott1, S.R. Meyers1, S.E. Peters1, I.A. Ross3, B.S. Singer1 and J.W. Williams2
Although open data resources are growing, most scientific data remain "dark" (Heidorn 2008), available only in peer-reviewed literature, where the volume and lack of structure for these data resources presents challenges to data retrieval. GeoDeepDive is an expanding digital library with toolkits that allow automated acquisition and management of published and unpublished documents, supporting large-scale text and data mining of published, peer-reviewed journal articles (Peters et al. 2014; geodeepdive.org). Initial projects have demonstrated the utility of GeoDeepDive's large-scale synthetic geoscientific research (Peters et al. 2017), with new efforts underway.
GeoDeepDive provides a corpus of documents that contain a set of user-prescribed keywords (e.g. ‘IRD’ and ‘Pliocene’ or ‘Pleistocene’ or ‘Holocene’). Users develop a set of rules to define the kinds of data they wish to retrieve (coordinates, measurements, etc.) from a subset of the matching publications, and write a test application. The application is deployed against the full GeoDeepDive corpus once a user has developed and tested their workflow on the data subset.
 |
|
Figure 1: GeoDeepDive workflow used to build a corpus of documents that mention “ice-rafted debris” (IRD), screen a vetted set of the documents, and summarize the documents and relevant information (github.com/EarthcubeGeochron/geodiveR). ‘Cleaning’ = removing instances of IRD in the affiliations and references sections; regex = regular expression; nlp = natural language processing; glos. = glossary; Checker = a step to ensure sentences contain relevant IRD information; gddid = GeoDeepDive identification key. |
Initial work with GeoDeepDive – studying the dynamics of Northern and Southern Hemisphere ice sheets during the Quaternary – has allowed us to leverage publications focusing on ice-rafted debris (IRD). Assembling information from publications documenting IRD at marine drilling sites is a non-trivial task that has traditionally involved painstaking literature compilation (Hemming 2004). GeoDeepDive allowed us to discover and extract information by searching through 7.5 million publications across a range of publishers using an R workflow based on regular expressions and natural language-processing utilities. This work also allows us to develop a general workflow for GeoDeepDive, supporting others who might use it in their future research (Fig. 1).
Future directions
Our GeoDeepDive workflow allows us to extract and plot reliable latitude-longitude pairs from publications reporting IRD events (Fig. 1). We are building a spatial database of IRD events and beginning to extract event ages from the papers. Extracting temporal information from the unstructured peer-reviewed literature is a non-trivial but tractable task using regular expressions and string matching. We are also differentiating primary, original sources from secondary studies that include previously published data, and building a GitHub repository for open code development and sharing (github.com/EarthCubeGeoChron). Next steps include building summary maps of the location, finding specific named IRD events or the timing of IRD deposits found in cores, and continuing development of an R package (github.com/EarthcubeGeochron/geodiveR). The project will result in an IRD database that can provide a better characterization of Northern and Southern Hemisphere ice sheets over the last 5.3 million years. The R package that results from this work will consist of a general set of tools for querying space and time information from GeoDeepDive, allowing other researchers to simply import their own data using their own search logic and output coordinates and subsets of the text relevant to a researcher’s particular questions.
An ongoing question in this broad-scale, data-mining project is to determine the appropriate points for human intervention and interpretation, one of many questions discussed at a recent GeoDeepDive user workshop in Madison, USA (geodeepdive.org/workshop2018). These points should be minimized for reasons of scalability, but some features may not be readily automated. Future advances will likely be powered by "centaur" systems combining the relative strengths of human- and machine-learning approaches, which will then provide the basis for new applications of machine-learning methods. We view the GitHub Repository and the R package as building blocks that will serve researchers across the geosciences and allied disciplines.
affiliations
1Department of Geoscience, University of Wisconsin-Madison, USA
2Department of Geography, University of Wisconsin-Madison, USA
3Department of Computer Sciences, University of Wisconsin-Madison, USA
contact
Jeremiah Marsicek: jmarsicekwisc.edu (jmarsicek[at]wisc[dot]edu)
references
Heidorn PB (2008) Library Trends 57: 280-299
Hemming SR (2004) Rev Geophys 42: RG1005
Timothy A. Kohler1,2,3, P.I. Buckland4, K.W. Kintigh5, R.K. Bocinsky3,6,7, A. Brin8, A. Gillreath-Brown1, B. Ludäscher9,10, T.M. McPhillips9, R. Opitz11 and J. Terstriep10
Archaeology depends on, and generates, proxy paleoclimatic and paleoenvironmental data. We review various initiatives, most quite recent, by which archaeologists seek to make these data more readily discoverable and useful, to facilitate the cumulation of research.
Since the birth of the discipline in the mid-19th century, archaeologists have recognized that climate variability has a role in explaining the locations, densities, and practices of human populations. The variability archaeologists could then recognize was the large and dramatic sort involving the ebb and flow of glaciations that altered coastlines and changed the areas people could access, and the distributions of plants and animals they depended on (e.g. Lartet 1861; Lubbock 1890).
Along with related advances in the Earth sciences, the development of palynology in the late 19th century, tree-ring dating and dendroclimatology ca. 1930, and radiometric dating in the mid-20th century greatly increased the scope and chronological precision of paleoclimatic proxies. By the mid-20th century, studying fauna, flora, sediments, and other residues from archaeological sites became recognized subdisciplines (e.g. zooarchaeology, paleoethnobotany, geoarchaeology) and standard archaeological practice. Archaeological prospection and excavation increasingly include investigation of bogs, lakes, or packrat middens to assess local environmental change. Today, many of the “grand challenges” facing archaeology involve understanding the range of human responses to climate change and human manipulation of the landscape at various scales (d’Alpoim Guedes et al. 2016; Kintigh et al. 2014).
Barriers to addressing these challenges include lack of access to and understanding of climate-change data relevant to studies of cultural change. Environmental data from archaeological sites yield an anthropocentric view of the past, since they result from human activities including resource harvesting, hunting, and exchange. Activities in and around sites are, however, always subject to external factors; occupants’ responses to changes in climate and environment will be reflected as changes in materials excavated from sediments of different ages. Indeed, the ensemble of excavated sites constitutes a “Distributed Observational Network of the Past” (DONOP; Hambrecht et al., in press) that provides the most direct evidence of our long-term interactions with our environments. As the Anthropocene debate has emphasized, human-nature interactions are not recent, simple, one-way, or local. People have been dramatically changing landscapes for over 10,000 years (Smith and Zeder 2013). Any study of paleoclimate, paleoenvironment, or paleobiodiversity, especially using broad-scale aggregated data, must evaluate the potential for human influences on proxy data used to infer natural change or variability (e.g. Li et al. 2014). As our only available line of evidence on past human and social responses to climatic variability, lessons from archaeology are critically important to forming future responses to climatic variability (Jackson et al. 2018). But just as archaeology studies climatic variability, climate change can destroy sites or their contents: we are rapidly losing archaeological data through erosion, rising sea levels, and thawing of permafrost (Hollesen et al. 2018). There is an urgent need for collecting and curating more data before key sediment archives are lost forever.
Major current efforts to curate open archaeological data
Although archaeologists have been using databases for decades, these were often project-oriented systems with short lifespans. Systematic initiatives to curate archaeological data have appeared in the last two decades, including Digital Antiquity (digitalantiquity.org) and its tDAR database (tdar.org), centered on, but not limited to, US heritage resources; Open Context (opencontext.org) (Wells et al. 2014); and the Archaeology Data Service (archaeologydataservice.ac.uk), the accredited digital repository in the UK for heritage data. Some national data services provide archaeological data, including DANS in the Netherlands (easy.dans.knaw.nl/ui) and the Swedish National Data Service (snd.gu.se/en). The Ariadne infrastructure (ariadne-infrastructure.eu) is working towards providing a single data-discovery service for all European resources. Although these archives are not specifically oriented towards paleoclimatic data, they contain much data important for understanding past environmental conditions and changes. As their interfaces are rarely designed with this in mind, considerable processing may be required to achieve paleoenvironmental insights. For example, using these data requires coping with the complexities of archaeological stratigraphy and possibly integrating archaeological dating with age-depth modeled reconstructions. Systems for standardized ontological mapping between datasets, such as tDAR’s data-integration framework (Kintigh et al. 2018), facilitate such processes.
Archaeological services emphasizing paleoenvironmental data
 |
|
Figure 1: Data-driven research process using archaeological resources. Stored grain pest or parasite occurrences are extracted from SEAD; further information linked through ‘agricultural buildings’ is extracted from sources identified using DataArc’s concept map; the results are visualized as environmental changes across a series of samples. |
Several new projects move beyond the scope of most archaeological archives to provide data and tools for exploring the relationships between archaeological and environmental data. The Strategic Environmental Archaeology Database (SEAD: sead.se; Buckland 2014; Uhen et al., this issue) is specifically designed to provide research-level open access to proxy environmental data. These include Quaternary fossil insects, plants, bones, soil parameters, dendrochronology, and geochemistry from mainly European archaeological research (currently, some 15,000 datasets). SEAD includes species traits and cultural/environmental classifications that allow searches for and reconstructions of inferred environments or activities and past species distributions. It provides data to Neotoma and the Earth Life Consortium (see this issue) and archaeological data portals including DataARC (data-arc.org). SEAD facilitates multi-proxy approaches, such as tracking the spread of pests and parasites with people, agriculture and climate change (Fig. 1; Panagiotakopulu and Buckland 2017).
DataARC is designed to go beyond multiproxy databases and suggest innovative links among resources. Essentially an advanced data-discovery tool, currently focused on the North Atlantic region, DataARC links diverse data types through space, time and concept – the latter using a semantic map to interlink higher-level concepts represented by different data or derived products. The suggested linkages not only expose data to users outside of core domains, but also promote novel research using less-obvious interdisciplinary relationships (Fig. 1). Thus DataARC goes further than past traditional archived data-retrieval platforms and federated systems, such as Ariadne, by providing more-advanced exploratory data-analysis tools to an expanded audience.
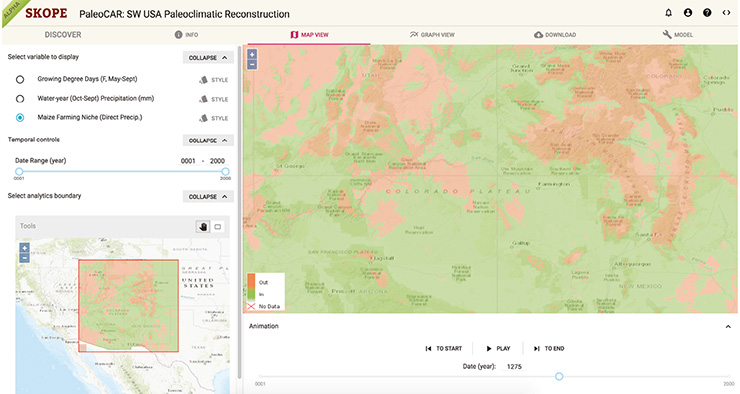
SKOPE (Synthesizing Knowledge of Past Environments; openskope.org) is designed to provide easy access to paleoenvironmental and paleoclimatic data that have been processed to be readily useful. Some of these datasets have been previously published; others are created through SKOPE. SKOPE focuses on delivering annual, gridded (raster) reconstructions centered on the US Southwest, including:
 |
|
Figure 2: The SKOPE tool depicting a PaleoCAR maize-farming-niche reconstruction. Users can specify region of interest, generate time-series graphs, and download data. Future functionality will include calculating summary statistics and smoothing the time series. |
• High-frequency temperature, precipitation, and maize-farming niche over the last 2000 years, reconstructed for the US Southwest from networks of tree-ring chronologies using the “PaleoCAR” method (Bocinsky and Kohler 2014) (Fig. 2);
• High-frequency Palmer Modified Drought Index over the last 2000 years, reconstructed from tree rings and available as the North American Drought Atlas;
• Elevation data from the Shuttle Radar Topography Mission (SRTM) dataset, available from NASA;
• Contemporary, monthly temperature and precipitation data for the contiguous United States, available from the PRISM Climate Group at Oregon State University.
We plan to add other existing and novel datasets in coming months, including:
• Low-frequency temperature reconstructed from a network of pollen samples available in Neotoma Paleoecology Database (neotomadb.org) using the modern analog technique (MAT; Overpeck et al. 1985), extending to the early Holocene;
• A new temperature reconstruction integrating the high-frequency signal from tree rings with the low-frequency signal from pollen (MAT) through wavelet modulation for Common Era;
• Past species and vegetation community distributions based on the temperature and precipitation fields available in SKOPE;
• Contemporary potential maize productivity fields for several Native American maize landraces.
We are interested in including other legacy paleoenvironmental data that would benefit from the enhanced access and analysis provided by SKOPE.
Conclusions
Archaeological data processed to reveal socio-ecological interactions are essential to understanding past human experience and how today’s world was shaped. Archaeological data that inform on paleoclimates or paleoenvironments are more available than many Quaternary scientists likely realize. The projects we describe enhance access to and facilitate use of paleoenvironmental and archaeological data. The authors welcome further collaboration with paleoclimatologists and paleoecologists to address human and climate interactions more comprehensively.
acknowledgements
This material is based in part upon work supported by the US NSF: DataArc, 1637076 and 1439389; Digital Antiquity/tDAR, BCS 17-24713, BCS 1153115, and IIS 0624341; and SKOPE, currently, SMA 1637189 (ASU), SMA 1637155 (UIUC), and SMA 1637171 (WSU) and previously, SMA 1439591 (ASU), SMA 1439603 (UCSD) and SMA 1439516 (WSU). SEAD has been supported by the Swedish Research Council (2007-7494 and 2010-5976), the Swedish Foundation for Humanities and Social Sciences (IN15-0231:1) and Umeå University.
affiliations
1Department of Anthropology, Washington State University, Pullman, USA
2Santa Fe Institute, USA
3Crow Canyon Archaeological Center, Cortez, USA
4Department of Historical, Philosophical and Religious Studies, Umeå University, Sweden
5School of Human Evolution and Social Change, Arizona State University, Tempe, USA
6Montana Climate Office, University of Montana, Missoula, USA
7Division of Earth and Ecosystem Sciences, Desert Research Institute, Reno, USA
8Center for Digital Antiquity, Arizona State University, Tempe, USA
9School of Information Sciences, University of Illinois at Urbana-Champaign, USA
10National Center for Supercomputing Applications, University of Illinois at Urbana-Champaign, USA
11School of Humanities, University of Glasgow, UK
contact
Timothy A. Kohler: takowsu.edu
references
Bocinsky RK, Kohler TA (2014) Nat Comm 5: 5618
d’Alpoim Guedes JA et al. (2016) PNAS 113: 14483-14491
Hambrecht G et al. (in press) Quat Int
Hollesen J et al. (2018) Antiquity 92: 573-586
Jackson RC et al. (2018) Glo Env Ch 52: 58-65
Kintigh KW et al. (2014) Am Antiq 79: 5-24
Kintigh KW et al. (2018) Adv Arch Prac 6: 30-41
Lartet É (1861) Nouvelles Recherches sur la Coexistence de l’Homme et des Grands Mammifères Fossiles Réputés Caractéristiques de la Dernière Période Géologique. Ann Sci nat 4e série, t. XV: 177-253
Li J et al. (2014) Quat Sci Rev 99: 112-121
Lubbock J (1890) [1971] Pre-Historic Times as Illustrated by Ancient Remains and the Manners and Customs of Modern Savages. 5th edition. Books for Libraries Press, 640 pp
Overpeck JT et al. (1985) Quat Res 23: 87-108
Panagiotakopulu E, Buckland PC (2017) Quat Sci Rev 156: 23-35
Barbara Stenni1 and Elizabeth R. Thomas2
We share our experience of compiling ice-core data for PAGES’ Antarctica 2k working group publications. Almost one third of the records were not publicly archived, despite appearing in peer-reviewed literature, highlighting the obstacles posed when performing synthesis studies.
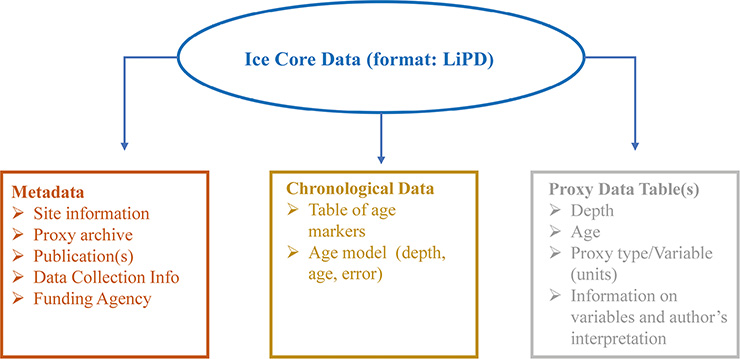
Paleoclimate research, and particularly ice-core research, is expanding, resulting in a welcome increase in scientific data. However, we need to ensure we are following best practices for archiving our data to achieve the maximum impact and sustained use of the data now and in the future (Kaufman and PAGES 2k special-issue editorial team 2018). Paleoclimate reconstruction is moving away from studies based on single locations to a more regional- and continental-scale approach (PAGES 2k Consortium 2013, 2017). Community efforts, such as PAGES, provide a platform to bring together researchers from a wide range of disciplines and scientific backgrounds to address key scientific questions. Journals are now taking the welcome step of requesting that published data be archived, and organizations such as PAGES have taken the initiative in proposing data standards for paleoclimate archives. McKay and Emile-Geay (2016) proposed the Linked Paleo Data (LiPD) format for data archiving that has been adopted by several PAGES projects, but some issues still arise when, for example, collating historical data for climate reconstructions. LiPD is a machine-readable data container, designed for paleoclimate data, that allows multiple levels of metadata as well as descriptions of proxy relations to climate variables (McKay and Emile-Geay 2016).
 |
|
Figure 1: Upper panel: locations and length of records for the recent PAGES Antarctica 2k water isotope (left, Stenni et al. 2017) and snow accumulation (right, Thomas et al. 2017) compilations. Lower panel: list of recognized ice-core data repositories and the numbers of records used in the Antarctica 2k database. |
As one of the PAGES 2k regional working groups, Antarctica 2k was tasked with compiling ice-core stable water isotopes (proxy for past local surface temperature) and snow accumulation (precipitation) records. Figure 1 (upper panels) shows the ice-core site locations for both compilations as well as the length of the records. The resulting reconstructions were published as part of the PAGES 2k special issue in Climate of the Past (Stenni et al. 2017; Thomas et al. 2017). The exercise highlighted the importance of data archiving. While collating ice-core records we also faced some difficulties that we want to share here. Moreover, we make some recommendations to the paleoclimate community to expand upon the data format proposed by McKay and Emile-Grey (2016) to facilitate future endeavors.
Experience collating ice-core data
For compiling the Antarctica 2k isotopic database, the records were identified by searching the literature and calling for data from the Antarctica 2k working group mailing list subscribers. A total of 112 records were collected but only 79 met the minimum requirement of having at least 30 years of data coverage since 1800 CE (Stenni et al. 2017). One of the selection criteria developed by the PAGES 2k Network (pastglobalchanges.org/ini/wg/2k-network/data) was that the data used in the compilation must be published, peer-reviewed and publicly available. However, about one-third of the records used in the syntheses were not previously available publicly, despite them having been described in peer-reviewed publications. Only 53 records were publicly available, distributed among four different data repositories, while 33% of the records had not been uploaded after publication (Fig. 1; lower panel). At this point a major effort was required to have all the data uploaded in a public repository. A request was sent to authors asking them to deliver the selected data to a public data center. These requests resulted in three different outcomes (1) the authors agreed and deposited their data, (2) they sent us the data, which we directly uploaded to NOAA-WDS Paleoclimatology, and (3) five records were made available in the article’s supplementary material through the journal’s website upon publication.
The task of collecting ice-core-based snow accumulation records proved more challenging than for water isotopes. Despite the existence of a large number of ice cores with annually dated stable isotope records, the number of published snow-accumulation records is limited. Just 79 snow accumulation records were available, compared to 112 for the stable water isotopes. Twenty-two of the ice-core records submitted to the isotope database did not have a corresponding snow accumulation record, either published or publicly archived, despite the evidence that an annual depth-age scale must exist. Snow accumulation (the sum of precipitation, sublimation, melt and erosion) is the distance between dated tie-points, such as annual layers used to produce age-depth scales. This distance is corrected for compaction, based on measured density, ice thinning and flow, which can be difficult to measure in low-accumulation areas. Another reason for the discrepancy in the number of records published may be that less scientific value is placed on snow accumulation compared to other proxies. If the additional 13 records from the East Antarctic plateau were made available, the spatial coverage in this region would have increased by 40%, while making the snow-accumulation records available for sites in the Antarctic Peninsula and Dronning Maud Land would have increased the temporal coverage in these regions from 200 to 500 years. Searching for the data was not straightforward. The 56 records that were publicly available were stored in four different archives (Fig. 1). The remaining 23 records were obtained by directly contacting original authors via email. In some cases, the ice cores were collected several decades ago and the original author was no longer working in the field. In those cases, the data were collected via third parties such as the authors of previous compilation studies or directly emailing current members of the research team. The majority of the data requested was made available, however the exercise was time-consuming, as often only the raw data was provided and all metadata (such as dating method, thinning functions) needed to be extracted from the original publication and submitted as a new entry in the database. In accordance with the PAGES 2k and Climate of the Past data policies, all records had to be archived at a recognized data repository with a unique digital identity (DOI or url) prior to publication. However, given the large number of records for which this was not possible (when the original author was not able or willing to submit the data to a data center themselves), the decision was made to publish all original records in a public archive together as a single compilation, with the metadata and data citations.
Final remarks
Despite the growing number of records in public repositories and the great efforts of promoting open data, our Antarctica 2k experience pointed out that much valuable data (new and old) have not yet been transferred to public data centers. Indeed, if we look at the spatial distribution of the records included in the two compilations (Fig. 1) these are not exactly overlapping. This mismatch suggests that many datasets are still missing from public repository.
 |
|
Figure 2: LiPD data container (McKay and Emile-Geay 2016) used in our regional isotopic and snow-accumulation reconstructions. This flexible framework can allocate unlimited number of climate proxy data types (sea ice, wind strengths, etc.), author interpretations and metadata fields. |
We suggest two simple actions, which are not limited to the Common Era but can be applied also to longer records. We encourage the international ice-core community to:
• archive not only new but also previously published ice-core datasets with a recognized data repository;
• adopt the flexible data container LiPD for storing multi-proxy datasets and rich metadata from ice cores (McKay and Emile-Geay, this issue) and described by the LinkedEarth ontology (Emile-Geay et al., this issue; Fig. 2).
The regional- and continental-scale temperature and snow-accumulation reconstructions carried out by the Antarctica 2k working group opened the possibility to address a longstanding question about the relationship between temperature and precipitation in Antarctica, which is one of the aims of the new CLIVASH 2k project (pastglobalchanges.org/ini/wg/2k-network/projects/clivash). However, a major effort is still needed for having properly compiled and accessible records of isotopes (surface temperature), snow-accumulation rates, as well as sea-ice proxies, from all Antarctic drilling sites. The lack of available data in public repositories together with the need to increase the spatial coverage of our observations, particularly in the coastal areas, are still hampering our understanding of the recent climate variability in Antarctica.
affiliations
1Department of Environmental Sciences, Informatics and Statistics, Ca’ Foscari University of Venice, Italy
2Ice Dynamics and Paleoclimate, British Antarctic Survey, Cambridge, UK
contact
Barbara Stenni: barbara.stenniunive.it
references
McKay NP, Emile-Geay J (2016) Clim Past 12: 1093-1100
Kaufman DS, PAGES 2k special-issue editorial team (2018) Clim Past 14: 593-600
PAGES 2k Consortium (2013) Nat Geo 6: 339-346
PAGES 2k Consortium (2017) Sci Data 4: 170088
Eric C. Grimm1, J.L. Blois2, T. Giesecke3, R.W. Graham4, A.J. Smith5 and J.W. Williams6
The Neotoma Paleoecological Database provides critical cyberinfrastructure for paleoenvironmental research. The database can accommodate virtually any type of fossil data or paleoenvironmental proxy, and is extensible to new data types.
Scientists have long harnessed paleodata to study ecosystem dynamics across time and space. For example, to reconstruct the postglacial expansion of tree species, von Post (1924) assembled fossil-pollen data from across Sweden; Szafer (1935) assembled data from Poland and neighboring areas and invented isopolls to summarize the data; while Firbas (1949) collected data from central Europe north of the Alps, which he summarized in various ways including with isopolls, which he called “Pollenniederschlagskarten” (pollen rain maps). These early investigators assembled, organized, and processed data. In other words, they created “databases”, although that term was not yet invented. Their work demonstrated the power of data collections to address emergent questions. With the advent of computers, this power was greatly amplified, for both data management and data analysis.
An early effort to harness computing power was the Cooperative Holocene Mapping Project (COHMAP Members 1988; Wright et al. 1993) in the 1970s, which developed an archive of pollen data as flat files. Many scientists contributed data to this project, which produced numerous publications and spinoff projects. Nevertheless, the data were not publicly available, accompanied by rich metadata, or stored in a relational database. That changed with the advent of the North American Pollen Database (NAPD) in the early 1990s, which was made available for public access by the National Geophysical Data Center of the U.S. National Oceanic and Atmospheric Administration. NAPD was first populated with data from COHMAP, then continued to acquire additional legacy and new data over about 15 years. The European Pollen Database (EPD) was developed simultaneously and in collaboration with NAPD, but the two databases remained separate. The FAUNMAP database, which included Quaternary data from the conterminous United States, was also launched in the early 1990s and made available on floppy disk included with its publication (FAUNMAP Working Group 1994). Following the success of these three databases, other databases were developed for other regions and data types, including the Latin America Pollen Database (LAPD), African Pollen Database, North American Plant Macrofossil Database, North American Non-Marine Ostracode Database (NANODe), Diatom Paleolimnology Data Cooperative, Northern Eurasian Palaeoecological Database, and others.
These database projects assembled large numbers of datasets, involved disciplinary experts, and supported and engendered scientific research. Nevertheless, they suffered from funding lapses and inability to cross-communicate. These issues and others led to the creation of the Neotoma Paleoecology Database (neotomadb.org) following a 2007 workshop at Pennsylvania State University (Williams et al. 2018). This database is named after the rodent genus Neotoma, prodigious collectors of diverse materials within their territories and which under the right conditions preserve a multiproxy record of environmental change.
Neotoma provides the underlying cyberinfrastructure for a variety of disciplinary database projects and can accommodate virtually any type of fossil data or paleoenvironmental proxy. All data in Neotoma are stored in a single centralized database but are conceptually organized into virtual constituent databases. These constituent databases, which may be organized according to data type or region, involve disciplinary specialists for data types and regions, thus providing domain scientists with quality control over their portions of the data. Neotoma is a curated resource with governance and control by disciplinary experts. “Curation” implies a high level of quality control. All data added to Neotoma are reviewed and uploaded by data stewards, who are appointed by the leaders of the various constituent databases.
 |
|
Figure 1: All data holdings in Neotoma: 22,012 datasets from 12,656 sites. |
Neotoma began by incorporating data from existing databases such as NAPD, EPD, and FAUNMAP. However, Neotoma’s design model is flexible and expandable, with many open pathways for participation by new members, data contributors, stewards, and research communities. The Neotoma data model supports, or can be extended to support, any kind of paleoecological or paleoenvironmental data from sedimentary archives (Williams et al. 2018). As of 30 June 2018, Neotoma held 22,012 datasets from 12,656 sites (Fig. 1). New datasets are added almost daily at an increasing rate over the past year (Fig. 2).
 |
|
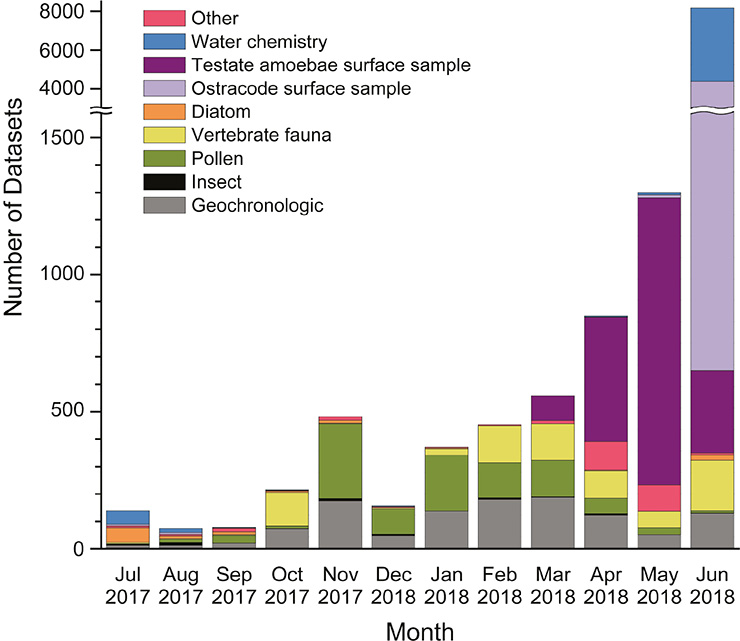
Figure 2: Recent dataset uploads to Neotoma by data type and month. |
Over the past year, there has been considerable push to upload surface samples for aquatic proxies, specifically testate amoebae, diatoms, and ostracodes. The latter two proxies include paired water samples, which comprise “calibration” datasets for quantitative calibration of water chemistry from diatom or ostracode assemblages. As of 30 June 2018, uploads include 1886 testate amoebae surface samples, 640 diatom surface samples, 4515 ostracode surface samples, and 5297 water chemistry samples. The ostracode surface samples have been ported from NANODe and from the Canadian Museum of Nature-Delorme Ostracoda-Surface Samples database. Most of the samples have been uploaded from the Delorme database: 3769 ostracode samples and 3776 water chemistry samples. Although these samples are from other databases, they are not ported en masse, but are subjected to the validation procedures to ensure data quality and compliance with Neotoma metadata standards.
Major efforts have been undertaken to upload data from the EPD (Giesecke et al. 2016) and FAUNMAP 2 (Uhen et al. 2013) databases and to inventory and upload pollen data from Latin America. EPD data contributed before 2007 were included in the Global Pollen Database (GPD), which was available from the World Data Center for Paleoclimatology at NOAA. Following a workshop in November 2017, EPD stewards have uploaded to Neotoma 881 new pollen datasets from 685 sites. After the new datasets are uploaded, the older EPD data ported to Neotoma from GPD will be replaced by the current EPD data, which include many updates and new age models. The original FAUNMAP database (FAUNMAP 1), was an initial compilation into Neotoma. The FAUNMAP 2 database, which includes Canada, Alaska, and the Pliocene (Blancan land mammal age), was compiled but never released nor fully vetted. Since November 2017, Allison Stegner and Mona Colburn have uploaded about a third (1009) of the FAUNMAP 2 datasets to Neotoma. For Latin America, Suzette Flantua and colleagues (Flantua et al. 2013, 2015, 2016) have inventoried pollen and associated geochronological data, and in 2017 over 50 new LAPD pollen datasets from Colombia were uploaded to Neotoma, including important, classic datasets from Thomas van der Hammen and Henry Hooghiemstra.
Another recent improvement particularly relevant for vertebrate fauna, but also other data types, is the ability to store data about individual specimens, including taxonomic and element identification, and museum catalog numbers. Other data can then be associated with these specimens, including radiocarbon dates, GenBank sequence identifiers, and isotopic measurements. In recent years, many high-quality AMS radiocarbon dates on purified collagen have been published (e.g. Widga et al. 2017), and many of these are from sites that are already in Neotoma. These new radiocarbon dates can now be added to existing or new geochronological datasets, and new age models can be built. AMS dates on identified plant macrofossils also comprise another valuable temporal record of taxon occurrences.
The flexible and expandable Neotoma data model has prompted the formation of cooperatives for data types that previously had no appropriate database. Two, in particular, are working groups for stable isotopes and organic biomarkers. The data model of Neotoma has been expanded to accommodate these proxies, and the input software has been modified to upload and validate them. Test datasets have been uploaded, and these holdings should increase during future data mobilization campaigns. We welcome inquiries from researchers interested in contributing data or launching new constituent databases. The continued growth of Neotoma in terms of data holdings and data types will increasingly enable and support paleoenvironmental reconstructions, building upon those first initiated by von Post, Szafer, Firbas, and their contemporaries in the pre-computer era.
affiliations
1Department of Earth Sciences, University of Minnesota, Minneapolis, USA
2School of Natural Sciences, University of California, Merced, USA
3Department of Palynology and Climate Dynamics, University of Göttingen, Germany
4Department of Geosciences, Pennsylvania State University, State College, USA
5Department of Geology, Kent State University, USA
6Department of Geography, University of Wisconsin—Madison, USA
contact
Eric C. Grimm: eric.c.grimmoutlook.com (eric[dot]c[dot]grimm[at]outlook[dot]com)
references
COHMAP Members (1988) Science 241: 1043-1052
FAUNMAP Working Group (1994) Illinois State Mus Sci Pap 25: 1-690
Firbas F (1949) Spät- und nacheiszeitliche Waldgeschichte Mitteleuropas nördlich der Alpen. G. Fischer, 480 pp
Flantua SGA et al. (2013) PAGES news 21: 88
Flantua SGA et al. (2015) Rev Palaeobot Palynol 223: 104-115
>Flantua SGA et al. (2016) Clim Past 12: 387-414
Giesecke T et al. (2016) PAGES Mag 24: 48
Szafer W (1935) Bulletin de l'Académie Polonaise des Sciences et des Lettres, Série B 1: 235-239
Uhen MD et al. (2013) J Vert Paleontol 33: 13-28
von Post L (1924) Geol Fören Förh 46: 83-128
Widga C et al. (2017) Boreas 46: 772-782
Julien Emile-Geay1, D. Khider1, N.P. McKay2, Y. Gil1,3, D. Garijo3 and V. Ratnakar3
Data science in the paleo sphere has been hindered by a lack of standards that limit interoperability and interdisciplinarity. Here we describe the LinkedEarth project, which lowered some of these barriers, and offers a blueprint for further erasing them.
 |
|
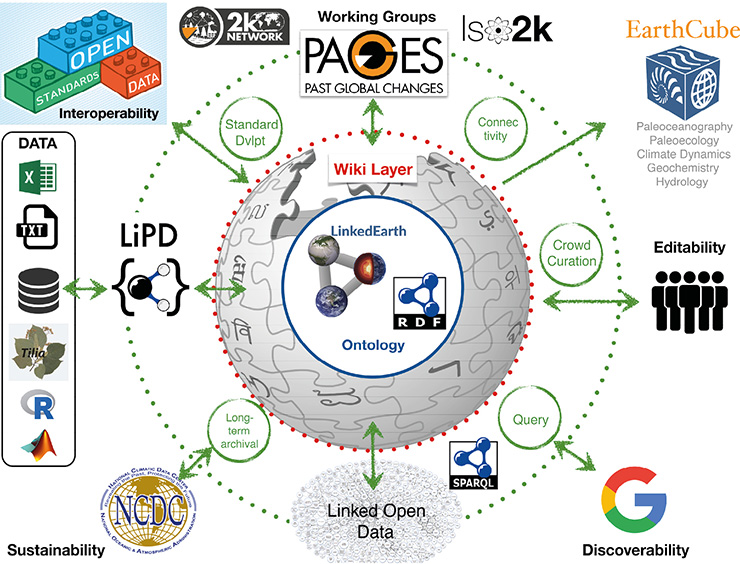
Figure 1: The LinkedEarth design (Gil et al. 2017) is structured around a semantic core (ontology), which can be easily interacted with thanks to a wiki. In addition, the framework supports import/export in LiPD, rich queries, the elaboration of community standards, the crowd-curation of datasets and a natural link to the Web of Data, ensuring discoverability. |
At present, scientists are asked to upload their data to various “silos” (loosely connected data centers like WDS-Paleo1, PANGAEA2, or Neotoma3), which use different formats and conventions, hampering interoperability. Further, there is sometimes little guidance on what information needs to be archived to provide long-lasting scientific value. While paleosciences offer a long-term perspective on environmental change, this cannot happen without a long-term perspective on environmental data stewardship. LinkedEarth4 (Fig. 1) was funded by the EarthCube program5 as a two-year “integrated activity”, with the twin aims of putting paleoclimate data stewardship in the hands of data generators, and developing standards that promote effective reuse. Here we review LinkedEarth’s successes and outstanding challenges, and take stock of its broader lessons for the PAGES community.
LinkedEarth has acted as a laboratory to advance the notion of decentralized paleo-data curation, allowing data generators to curate their own and others' data, via standards and technologies. The basic premise of LinkedEarth is that no-one understands data better than the people who generated them. Therefore, data generators should be the ones describing their data, but in a consistent way to make them interoperable. Having participated in several PAGES’ syntheses (e.g. PAGES 2k Consortium 2017), we also appreciate that publicly-archived datasets are nearly always incomplete, and may harbor errors - requiring collective curation and correction (that is, the ability for multiple actors to edit and annotate the same datasets). We thus set out to develop a platform that would enable paleoclimatologists to interact with data in an intuitive way, resulting in standardized datasets that are (by construction) extensible, interoperable, and discoverable.
Crowd-curation through standards
A data standard consists of three parts: (1) a standard terminology, to prevent ambiguity; (2) standard practices, which codify the information that is essential to long-term reuse and (3) a standard format for archival and exchange. The latter is emerging, in the form of Linked Paleo Data (LiPD6; McKay and Emile-Geay, this issue, 2016), so LinkedEarth only had to contend with the first two parts.
Standardizing terminology was accomplished by means of the LinkedEarth ontology7. An ontology is a formal representation of the knowledge common to a scholarly field. It allows unambiguous definitions of common terms describing a paleoclimate dataset, as well as the relationships among these terms (e.g. a proxy observation is measured on a proxy archive at a particular depth). Ontologies are necessary to organize information so machines can take advantage of digitally-archived data. Ontologies are inherently flexible, allowing to specify ecological properties such as habitat depth and seasonality to previously-archived foraminiferal-based records. Ontologies have had an enormous impact in biomedical research, ranging from genomics to drug discovery, and are beginning to permeate the geosciences8.
Ontologies need to be sufficiently rigid so that dependent applications can rely on their structure being stable over time, yet sufficiently flexible to accommodate growth and evolution. The ontology maps closely to the LiPD structure, which serves as its stable skeleton. Extensibility was achieved via a new technology, the LinkedEarth platform9. At its core, it is a semantic wiki, similar to other wikis like Wikipedia, but based on the LinkedEarth ontology. The LinkedEarth wiki tracks changes and attributes them to authenticated contributors (an ORCID is all that is required to join LinkedEarth). The wiki facilitates extensions by allowing users to edit the non-core aspects of the ontology: they can define new classes or properties, create or change definitions, start discussions with other users, or request modifications to the core ontology when sufficient consensus emerges. These user roles and interactions were defined in a formal charter10. The flexible structure will accommodate advances in techniques and interpretations, and allow users to deprecate outdated terms.
Because LinkedEarth datasets are based on LiPD, they can be uploaded or downloaded in a few clicks, and benefit from the entire LiPD research ecosystem (McKay and Emile-Geay, this issue). This makes LinkedEarth-hosted data inherently interoperable. In order to ensure the lasting utility of the data, LinkedEarth sparked the first international discussion on community-led data reporting standards11, to build consensus on the most important information that should be reported in paleoclimate datasets. This consensus-building enterprise was facilitated by the LinkedEarth platform, including working groups, discussions, and polling (Gil et al. 2017).
Lastly, the semantic part of LinkedEarth means that datasets are broadcast to the web using standard schemas12, which make them discoverable by various search engines, including Google. Because of this outward-facing design, LinkedEarth datasets were the first to be integrated into EarthCube’s Project 41813 (P418), an EarthCube initiative to demonstrate common publishing approaches for data holdings using such standard schemas.
Towards Interoperable Paleo Data
 |
|
Figure 2: (A) Chronology for Basin Pond sediment core using the BACON software; (B) Basin Pond temperature reconstruction placed on an ensemble of age models (red line). The bold black line represents the median. The grey areas represent the 1σ (dark) and 2σ (light) uncertainty bands on calendar age. For details, see nickmckay.github.io/LinkedEarth-Neotoma-P418/LE-Neo_UseCase.html |
Discovering data pertinent to a scientific question is critical, but what to do once you find them? Imagine a user interested in the impact of time uncertainty on a pollen-based temperature reconstruction at Basin Pond, Massachusetts, USA. After a quick search through the P418 interface, our user realizes that the temperature reconstruction is hosted on LinkedEarth while the geochronological information is stored on Neotoma. Using the P418 service, they can find and download the datasets of interest. The GeoChronR software package (McKay et al. 2018) can then facilitate their analysis. GeoChronR was built around LiPD, which has been mapped to the Neotoma data model (that is, Neotoma datasets can be read by any LiPD-based code). This enables fast integration between the LinkedEarth-hosted temperature reconstruction and the Neotoma-hosted chronological data. Within the GeoChronR framework, our user has access to a variety of age-modeling tools, including Bacon (Blaauw and Christen 2011). They can then readily visualize the new age model (Fig. 2a) and assess the impact of age uncertainty on the temperature evolution (Fig 2b). Such is the promise of holistic data stewardship: more than putting data online, it’s about drastically simplifying their reuse.
Beyond LinkedEarth
In a short two years, LinkedEarth has brought to life a functional platform for the crowd-curation of paleoclimate data and an emerging data standard. Along the way, it provided a nucleus for interoperability via synergistic software (GeoChronR, Pyleoclim14).
Despite these accomplishments, the vision still faces notable challenges. First, it has proven difficult to elicit broad participation: only 100 paleoclimatologists have answered our survey on paleoclimate data standards so far. We have found that overburdened scientists have little inclination to participate in such activities unless there are clear incentives. We argue that only publishers and funding agencies can provide these incentives, but have yet to do so. We do not envision meaningful progress until they do. Another issue concerns adoption: despite a non-trivial investment of resources (funding, personal time for participants), very few scientists are actively using LinkedEarth. PAGES is playing a leading role in incentivizing a new generation of paleoscientists to curate high-quality data compilations and take advantage of the LiPD-based research ecosystem, which was built for them. PAGES 2k15 is a case in point, having motivated the birth of LiPD, the need for crowd-curation, and many of the ontologies’ categories. One persistent obstacle to adoption is the perceived redundancy with data repositories. LinkedEarth is a framework, and works in tandem with repositories. It has strong links to WDS-Paleo, which now accepts LiPD as a submission format, and can ensure long-term archival. Because of LiPD’s structured nature, LinkedEarth also integrates well with Neotoma; links to other repositories are in the works. The success of LinkedEarth will be measured over time by adoption and extension of its various tools and standards. We look forward to many more PAGES compilations being generated, discussed, and published on LinkedEarth. Every new PAGES working group brings with it new requirements; so far, LinkedEarth’s intrinsic flexibility has enabled it to accommodate them all, and likely will for the foreseeable future.
affiliations
1Department of Earth Sciences, University of Southern California, Los Angeles, USA
2School of Earth and Sustainability, Northern Arizona University, Flagstaff, USA
3Information Sciences Institute, University of Southern California, Marina Del Rey, USA
contact
Julien Emile-Geay: julienegusc.edu
references
Blaauw M, Christen JA (2011) Bayesian Anal 6: 457-474
Gil Y et al. (2017) The Semantic Web - ISWC 2017: 231-246
McKay NP, Emile-Geay J (2016) Clim Past 12: 1093-1100
McKay NP et al. (2018) GeoChronR (Version 1.0.0). Zenodo
PAGES 2k Consortium (2017) Sci Data 4: 170088
links
1ncdc.noaa.gov/data-access/paleoclimatology-data
7climdyn.usc.edu/publication/leo
8geoscienceontology.org/about.html
10linked.earth/aboutus/governance/charter
11wiki.linked.earth/Paleoclimate_Data_Standards
13earthcube.org/group/project-418
Jean-Yves Peterschmitt, P. Braconnot and M. Kageyama
Open paleo data from both observations and models underlies the success of the Paleoclimate Modelling Intercomparison Project. We present how the project has evolved from a stand-alone database to an active member of a distributed international infrastructure following community standards.
Climate models are improved iteratively, as scientific knowledge, along with computing and storage technology progress. Sharing and comparing models and their output to paleo reconstructions is an essential part of this process. This can be done by sharing data directly between individuals, but is more efficient when formally organized as a MIP (Model Intercomparison Project), where all contributors and users adopt the same standards. The Paleoclimate Modelling Intercomparison Project (PMIP), started in 1990 (Joussaume and Taylor 1995), was one of the early MIPs, following the AMIP example (Gates et al. 1998).
PMIP has been successful in terms of participation, publications, and contributions to successive IPCC Working Group 1 reports, and is now in its fourth phase, with 20 modeling groups/models from 14 countries (Kageyama et al. 2018; Kageyama et al. 2016 [PMIP4 special issue]). The first studied periods were the mid-Holocene and the Last Glacial Maximum, with the pre-industrial period used as a control run. PMIP4 now includes five additional experiments: the last millennium, the Last Interglacial, the mid-Pliocene Warm Period, the last deglaciation and DeepMIP. Thanks to improvements in model complexity, resolution, and length of the simulations, the different phases of PMIP have targeted key scientific questions on climate sensitivity, the hydrological cycle, and abrupt event and inter-annual to multi-decadal variability.
For PMIP4, experimental protocols were co-designed by the modeling and data communities (Kageyama et al. 2018). They require that the same model version be used for PMIP4-CMIP6 experiments and future climate projections so that rigorous analyses of climate processes, including both physical and biogeochemical interactions, can be performed across the range of past and future climate. This is done in collaboration with other CMIP6 MIPs (Eyring et al. 2016).
PMIP simulations address the key CMIP6 overarching questions:
- • How does the Earth system respond to forcing?
- • What are the origins and consequences of systematic model biases?
- • How can we assess future climate changes given climate variability, predictability and uncertainties in scenarios?
Current work places a particular emphasis on the assessment of the different sources of uncertainties resulting from, for example, model formulation, reconstructions of forcing, and internal model noise. Model-data comparisons are key in this process (Braconnot et al. 2012; Harrison et al. 2015).
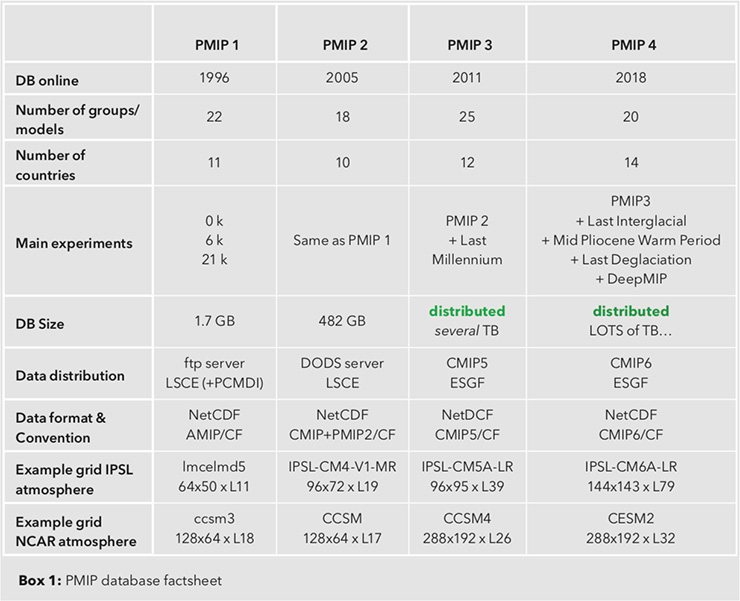 |
|
Box 1: PMIP database factsheet |
The PMIP model database has progressed from almost 2 GB for PMIP1 (~14,500 files) to a frightening (and unknown!) number of terabytes for PMIP4 (Box 1). Standards and good data-distribution tools are the key to dealing with the massive amount of data generated, along with good communication tools (mailing lists and websites), and invaluable help from the Earth System Grid Federation (ESGF; Balaji et al. 2018) community that maintains the CMIP database.
Using standards
The database of model output is too large to be accessed by ordinary database queries. Nevertheless, users need to easily access the subset of the data they need for their analyses, regardless of which research group generated it. In PMIP, this is achieved through the use of community standards. Standards are sometimes viewed as a hindrance to data production, but they are necessary to avoid chaos when working with multi-model data – the essence of a MIP. Data that is consistent across all the models and experiments eases reuse by users, and is required to automatically process numerous files, easily ingest new files, and to reprocess files when a bug is found. Such standardization also generally makes any analyses more reproducible.
Standardization is a key aspect of the long history of PMIP in international collaborations. PMIP currently follows the CMIP6 standards for file format (NetCDF format) and metadata (Climate and Forecast conventions, CMIP6 Data Reference Syntax, Controlled Vocabulary and Data Request). The NetCDF binary format has many advantages: self-describing, easily and efficiently writable/readable by programs, capacity to hold several gigabytes of data, and suitable for long-term archiving. Thanks to these choices it is still possible to access the content of PMIP1 files created more than 20 years ago. It is not easy for the modeling groups to meet the CMIP6 requirements, but the Climate Model Output Rewriter (CMOR3) library and project-specific configuration tables facilitate the creation of CMIP-compliant files.
Accessing model data
Once the data files are available in the standard format, the next goal is to ensure they move as smoothly as possible from the data provider to the data user. This is accomplished through a number of developments:
- • Model-output data providers need an automatic service to answer user requests.
- • Users want to determine easily if the required data is available, and then to easily access the files. Given the size of the database (Box 1) there are ongoing developments to provide computation and analysis services directly on the servers holding the data.
- • Users need a good documentation of the models and how the PMIP experiments were run. For PMIP4-CMIP6, this information will be centralized on the Earth System Documentation (es-doc) site.
For CMIP5-6 (PMIP3-4), the data files are sent by the modeling groups to the closest ESGF Data Node and, after review ranging from a basic validation to an exhaustive quality control, they can be searched and downloaded from any other node of the federation. This distributed repository is scalable and is the only practical way to handle the 10-50 petabytes of data expected for CMIP6 (including PMIP4 data). ESGF also offers a fast web-search interface and bulk data-download tools. This infrastructure is powerful, but it requires substantial manpower for customized software development and local node administration, as well as sufficient storage and computing resources.
In addition to standardization, the PMIP data policy has evolved over time. For PMIP1, the full database was initially available only for the groups which had submitted data during an embargo period, prior to public release. For PMIP2, the database was also available for people proposing an analysis project. PMIP3-4 followed the CMIP5-6 data policy, which allows anyone to use the data from modeling groups, with some restrictions for commercial applications. In turn, the results of the study that uses the model output must be shared with the same open policy, without forgetting to credit the producers.
Using PMIP data
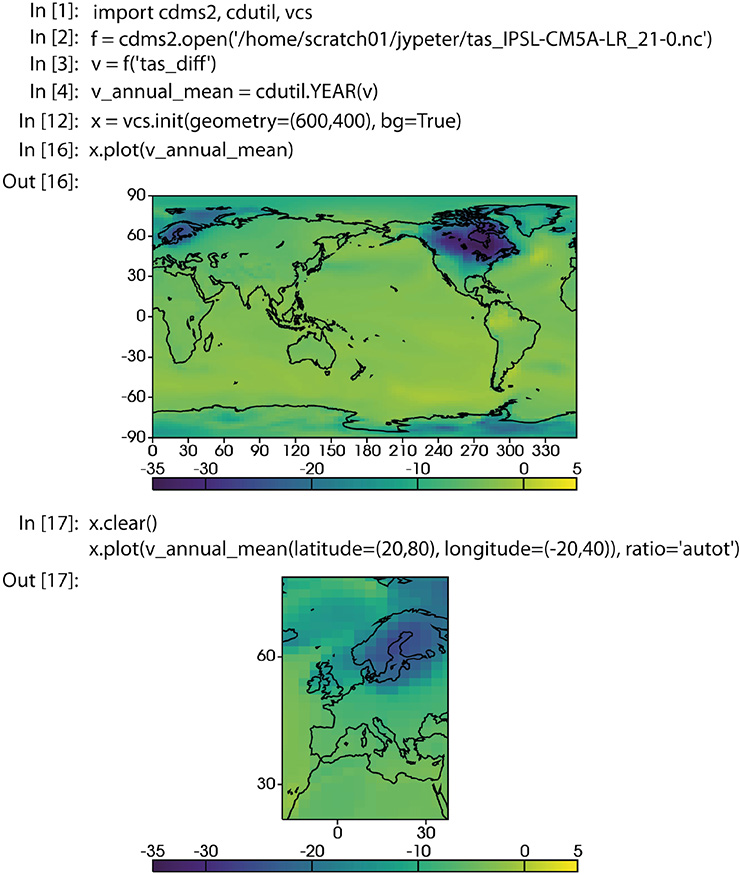 |
|
Figure 1: An example of a script using the CDAT climate-oriented Python distribution in a notebook to read PMIP3 data from a NetCDF file (surface temperature, anomaly for the Last Glacial Maximum minus the pre-industrial control, for the IPSL-CM5A-LR model), compute the annual mean and plot it on a global grid and a smaller region. |
There are many ways to use PMIP model data, depending on the analyses to be done. The data complexity (number of available variables and file size) has increased substantially since the beginning of PMIP, but the programing complexity has decreased. It is now much easier to use a high-level scripting language (Fig. 1) than it was to use Fortran programs. Users can also process PMIP data with the Graphical User Interfaces provided by some programs (e.g. GIS programs such as QGIS), but they may be quickly limited by data size and available operations. There is also an ongoing effort by the PMIP community to provide some higher-level web interface; this will receive more attention in the coming years.
Conclusion
PMIP has benefited from CMIP5-6 and the ESGF infrastructure, which has eased the comparison between past and future climate simulations. One of the next challenges is to make using the data easier for non-modelers, especially experts in paleoclimate reconstructions. This will require the deployment of specific web servers similar to the ones used for impact studies, but customized for paleoclimate needs. Another challenge will be to deal with the long, transient climate simulations (thousands of years of model data) generated by the PMIP4 experiments (deglaciation, the Eemian and the Holocene) when performing model-model and model-data comparisons.
resources
PMIP: pmip.lsce.ipsl.fr
AMIP and CMIPn: pcmdi.llnl.gov/mips
PMIP3 publications: citeulike.org/user/jypeter/order/year
NetCDF: unidata.ucar.edu/software/netcdf
CF conventions: cfconventions.org
CMIP6 DRS: goo.gl/v1drZl
CMIP6 DR: earthsystemcog.org/projects/wip/CMIP6DataRequest
CMIP6 CV: github.com/WCRP-CMIP/CMIP6_CVs
CMOR3 library: cmor.llnl.gov
es-doc: search.es-doc.org
CDAT: cdat.llnl.gov
QGIS: qgis.org
DeepMIP: deepmip.org
affiliationS
Laboratoire des Sciences du Climat et de l'Environnement (LSCE/IPSL, CEA-CNRS-UVSQ), Université Paris-Saclay, Gif-sur-Yvette, France
contact
Jean-Yves Peterschmitt: Jean-Yves.Peterschmittlsce.ipsl.fr
references
Balaji V et al. (2018) Geosci Mod Dev 11: 3659-3680
Braconnot P et al. (2012) Nat Clim Change 2: 417-424
Eyring V et al. (2016) Geosci Mod Dev 9: 1937-1958
Gates WL et al. (1998) BAMS 73: 1962-1970
Harrisson SP et al. (2015) Nat Clim Change 5: 735-743