PAGES Magazine articles
Ferran Antolín, S. Häberle, A. Jesus, H. Martínez-Grau, G. Prats, M. Schäfer and B.L. Steiner
Early farmers were resilient thanks to a small-scale, household-based farming strategy that coped well with climate variability. The AgriChange project is compiling data on crops, local climate variability and risk-reducing strategies to reconstruct agricultural and land-use change in the Neolithic.
 |
|
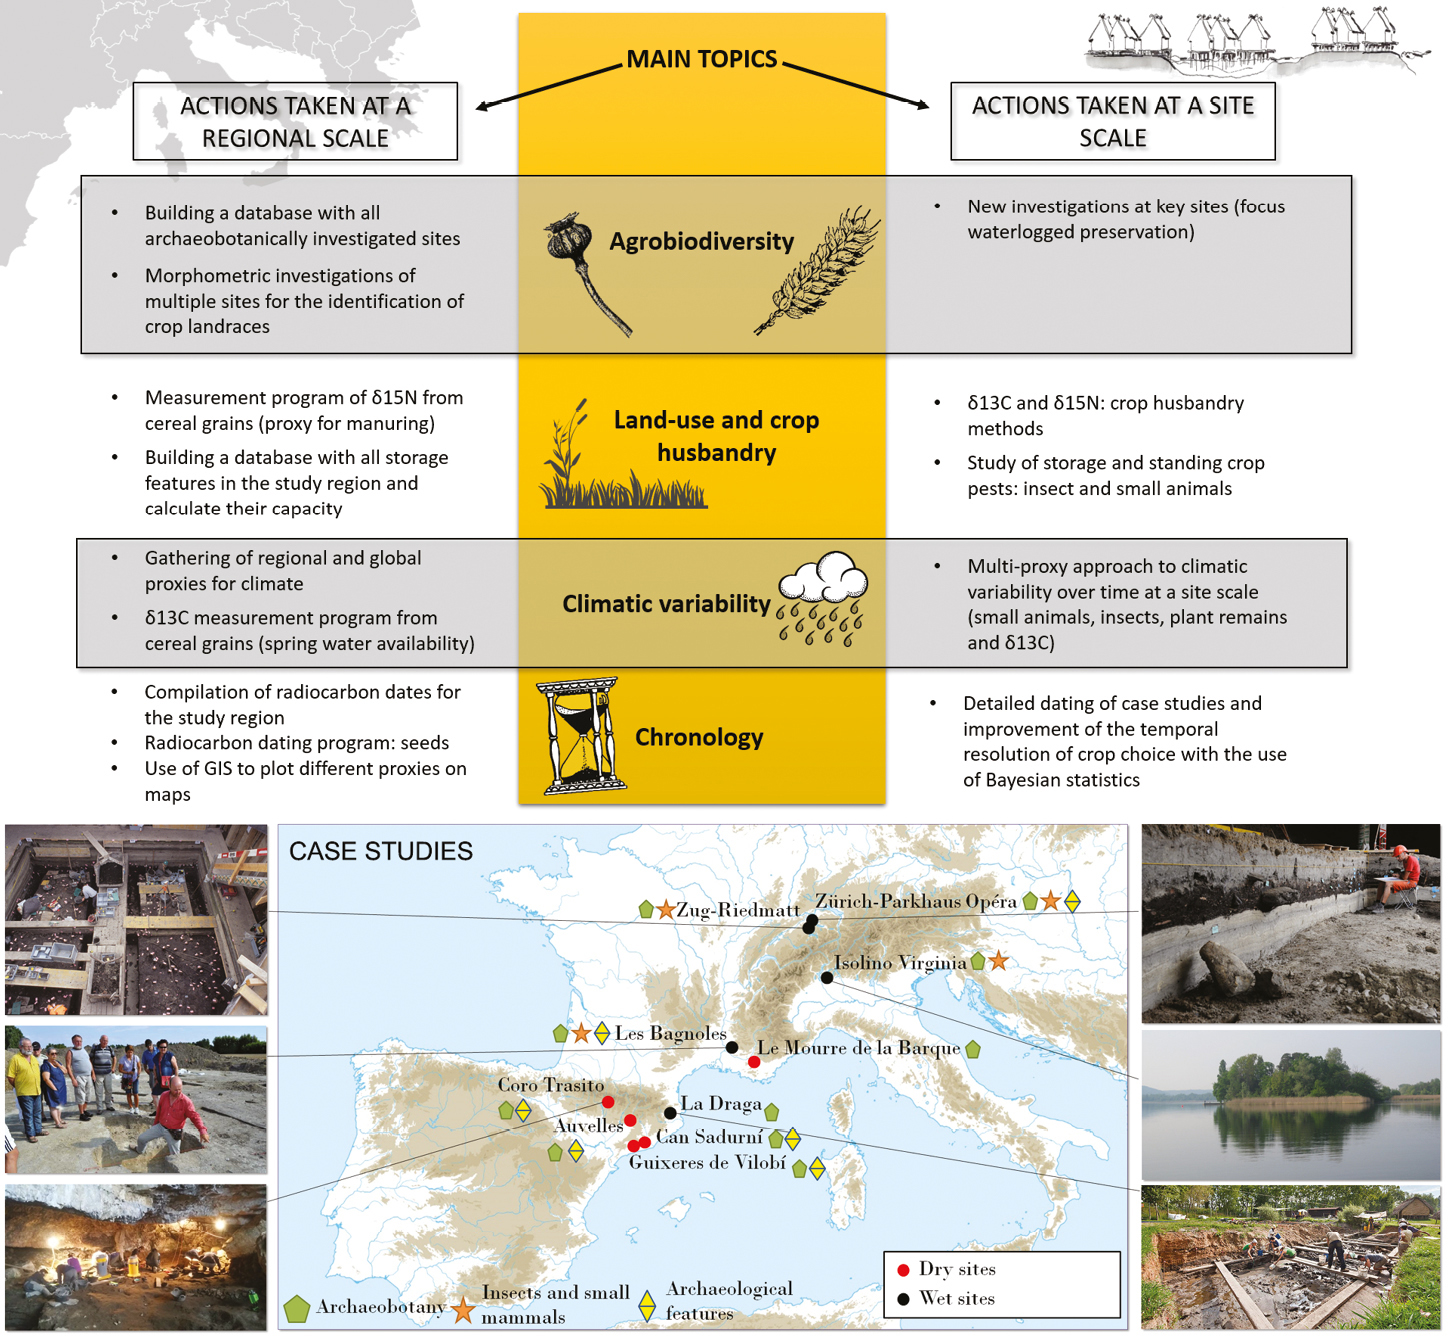
Figure 1: Scheme of the local-to-regional-scale analyses performed in the AgriChange project, and location of case studies. |
Research carried out during the last decades has brought to light a wealth of information on agriculture and wild-plant gathering in Western Europe during the Neolithic period, between 5700 and 2300 BCE (7.65-4.25 cal ka BP). As a result, broad-scale changes in crop types and agricultural practices have been outlined. These changes have the potential to provide insights on the factors that may have influenced agricultural decision making in the past, such as climate change, or land-use change related to technological developments (e.g. the introduction of the plough or new irrigation practices). So far, these aspects have not been assessed in an integrative way and at a large spatial scale. The latter is the main aim of the Swiss National Science Foundation AgriChange project (2018-2021). The geographic focus of the project is the Northwest Mediterranean region up to the Alpine Foreland (Fig. 1). This area witnessed contacts between different farming traditions (the central European one and the Mediterranean one) from the beginning of the Neolithic onwards and is therefore an ideal case study area. The project will thus contribute key data to LandCover6k for a first comprehensive detailed-scale reconstruction of land-use for the study area.
Decision making among smallholders is a complex issue that involves their global socio-economic and spiritual sphere. For this reason, a multi-proxy approach is pertinent. This includes proxies that allow the study of resource diversity over time in the past, spatial variability, exchange, and storage. In addition to this, proxies for paleoclimatic conditions at an adequate temporal resolution are necessary. Data from the northeast of the Iberian Peninsula serves as a useful example of potentials and pitfalls of the project’s approach.
The example of the Iberian Peninsula
 |
|
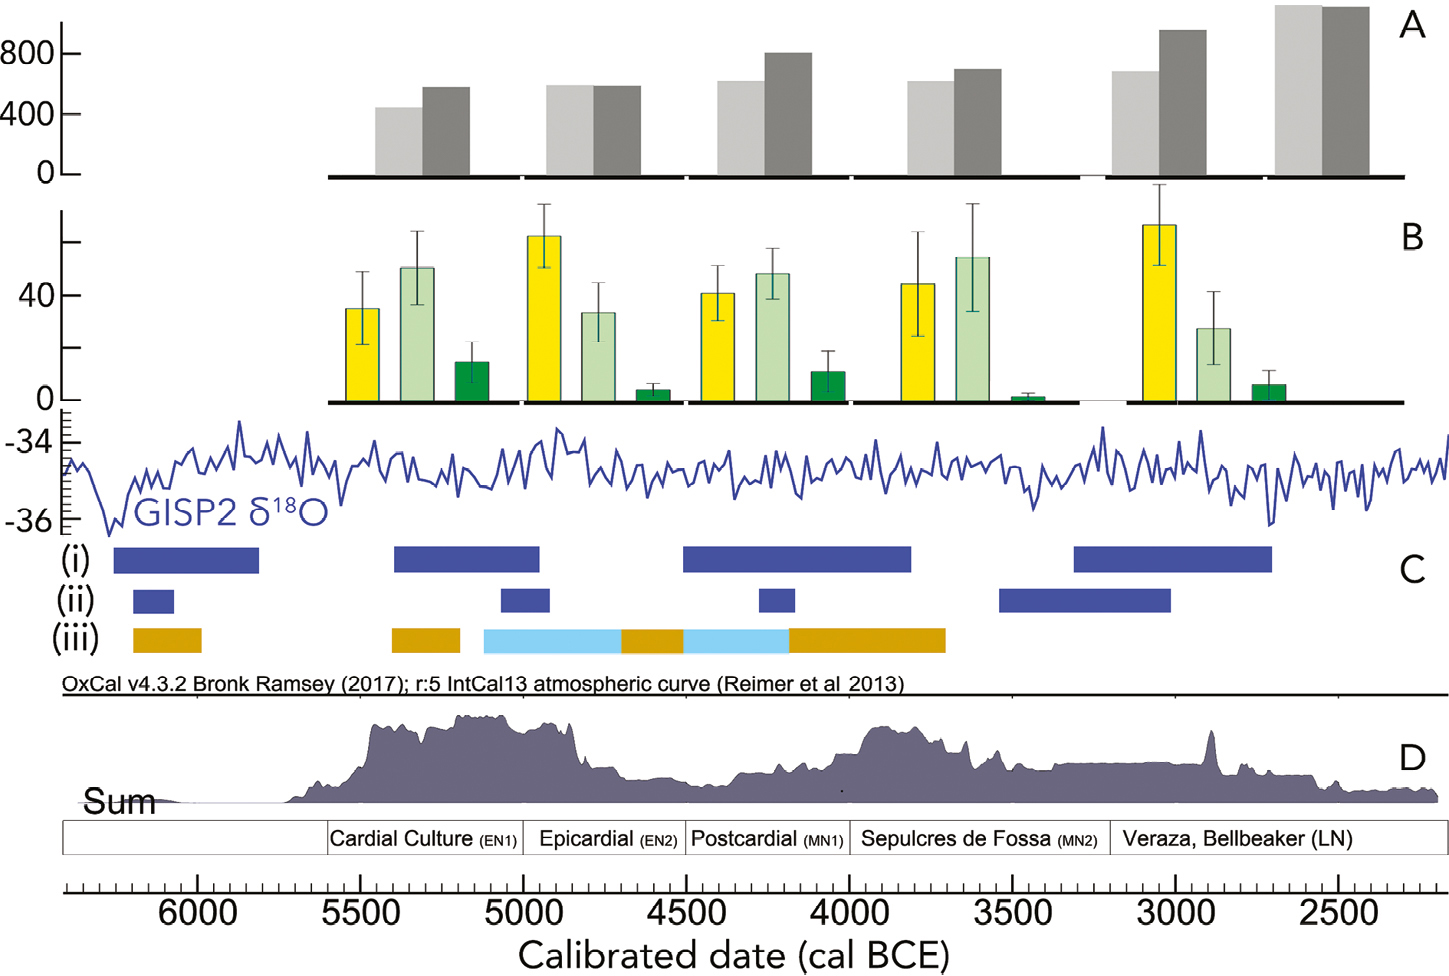
Figure 2: Multi-proxy analysis of agricultural changes during the Neolithic in the northeast of the Iberian Peninsula. (A) Storage capacity in liters: Median in light grey, mean in dark grey, temporal resolution marked below the graphs with a thicker black line (Prats 2017); (B) Mean percentage of each crop, sites grouped for time slices (Antolín 2016): Barley in yellow, naked wheat in pale green, glume wheats in dark green; (C) Paleoclimatic proxies: GISP2 δ18O (i) Minorca events (cold phases; Frigola et al. 2007); (ii) Alboran Sea cold events (Cacho et al. 2001); (iii) Sedimentary karst records (arid phases in brown, humid phases in light blue; Bergadà et al. 2017); (D) SRPD based on the dates from Morell B (PhD in progress, Autonomous University of Barcelona, Spain). |
The northeastern part of the Iberian Peninsula has seen the greatest advances in research during the last few decades and provides a detailed multi-proxy dataset that includes underground storage capacity, crop types, climate, and summed radiocarbon probability distributions (SRPD) as a proxy for population dynamics (Fig. 2 A-D, respectively). We can see there are two phases with a higher density of SRPD: 5.5-5.0 and 4.0-3.5 ka BCE. These coincide with arid phases and end with a cold and humid phase, respectively.
Naked (free-threshing) wheat tends to prevail during arid phases (5.4-5.2 and 4.2-3.7 ka BCE), while naked barley increased in the latter phase (4.0-3.5 ka BCE). The mean capacity of storage features increased in this phase, but not the median (therefore some larger storage pits were produced, probably as a response to uncertainty, while keeping the regular sizes in most cases). These changes might have enabled the social developments (population increase, higher settlement nucleation, social stratification and development of regular exchange networks of prestige objects) of the “Sepulcres de Fossa” period (equivalent to other Middle Neolithic cultures in Europe). In contrast, hulled wheats are poorly represented, being mostly found in the arid phases. In the last period (3.2-2.3 ka BCE), hulled barley seems to partly replace naked barley (not separated in Fig. 2), maybe due to higher aridity (hulled barley tolerates drought better than other cereals). During this period, storage features tend to become significantly larger, perhaps to help cope with risk and uncertainty and revealing a focus on increased yields over productivity per land area (i.e. extensification of agricultural land instead of continuing with more small-scale, intensively managed plots).
These results suggest that naked wheat might have been the preferred crop choice over other taxa except during wet phases, when naked barley perhaps was more successful. In response to a progressive climatic aridification during the youngest phases (3.2-2.3 ka BCE), hulled barley might have been a safe choice. This seems to be connected to a change in land use towards more extensive farming systems.
How will the AgriChange project lead us a step further?
Despite recent improvements in the datasets and the novelty of the multi-proxy approach, there are still some important limitations that need to be tackled. These include the restricted number of studied contexts, the poor chronological resolution of the observed agricultural changes, the existing limitations for the identification of the adoption of new landraces (beyond the main crop types), the scarcity of isotopic analyses that help to reconstruct land use changes (Fig. 1), and lack of knowledge on the short-term, local-scale climatic variability.
AgriChange will perform new research in a selected number of key sites and focuses on waterlogged deposits containing cultural layers (Fig. 1). Wetland sites can provide important insights for three reasons: (i) they offer precisely dated contexts, thanks to the preservation of wood remains datable to a calendar-year scale through dendrochronology, (ii) the cultural layers often present a stratification produced during short periods of time (20-40 years) that may reflect changes during the settlement occupation, and (iii) waterlogged deposits are generally characterized by good preservation conditions of plant and animal remains, which translates into more diverse environmental proxy data than those obtained in most dryland sites. The oldest lakeshore site of the Alpine area, Isolino di Varese (Varese, Italy) is one of the key sites studied in the project. It is a UNESCO World Heritage Site with an initial occupation dated to ca. 5.3 ka BCE with subsequent occupations in younger periods. AgriChange also includes dryland sites both for methodological and ecological reasons, since the distribution of sites with waterlogged deposits is quite restricted (often near lakes).
The project integrates several disciplines and multiple scales of analysis (Fig. 1). Archaeobotanical analyses form the basis of the interpretation and construction of the discourse, since they inform us about what was grown and where. Digital image analysis is used to identify crop types (see Ros et al. 2014; Bonhomme et al. 2017). Single seeds are individually radiocarbon dated (ca. 500 measurements) to identify crop changes over time in each region. AgriChange also uses carbon and nitrogen stable isotopes from cereal grains to infer land-use changes over time (extensive vs. intensive farming methods; Fraser et al. 2013). Carbon stable isotopes are also a valuable on-site proxy for crop water availability in spring (Araus et al. 2003; Fiorentino et al. 2008) and therefore might reveal short-term climatic changes, otherwise difficult to detect.
Additional proxies (storage features, insect and small animal remains) are investigated to reconstruct and understand crop storage practices and infer storage capacity and crop pests. Although underground storage pits are one of the most common archaeological features found in dry sites, and despite the fact that storage is recognized to be an essential aspect of farming societies (Sigaut 1988), inefficient recording methods and the lack of regional or supra-regional archaeological databases have not yet allowed the study of storage and productivity over time. Recording changes in storage capacity and identification of crop pests in the study area will bring important insights into food security and risk management in the past. Climatic variability is considered at a large spatial scale using global proxies, as well as local to regional scale by compiling several climate proxies such as plant macroremains, insect and small-animal remains and δ13C records from cereal remains.
AgriChange integrates multiple proxies to understand long-term agricultural decision making in the past, which will provide valuable lessons for current planning of resilient systems of smallholders in the face of today’s multiple challenges such as globalization, liberalization of agricultural land and climate change.
acknowledgements
The Swiss National Science Foundation funds the project “Small seeds for large purposes: an integrated approach to agricultural change and climate during the Neolithic in Western Europe” (grant number: PP00P1_170515).
affiliation
Integrated Prehistory and Archaeological Science (IPAS), Department of Environmental Science, University of Basel, Switzerland.
contact
Ferran Antolín: ferran.antolin unibas.ch
references
Araus JL et al. (2003) Crop Sci 43: 170-180
Bergadà MM et al. (2017) Quat Sci Rev 184: 26-46
Bonhomme V et al. (2017) J Arch Sci 86: 60-67
Bronk Ramsey C (2017) Radiocarbon 59: 1809-1833
Cacho I et al. (2001) Paleoceanography 16: 40e52
Fiorentino G et al. (2008) Palaeogeo Palaeoclim Palaeoecol 266: 51-58
Fraser R et al. (2013) World Archaeol 45: 492-517
Frigola J et al. (2007) Paleoceanography 22: PA2209
Reimer P et al. (2013) Radiocarbon 55: 1869-1887
Ros J et al. (2014) J Arch Sci 41: 568-575
Sigaut F (1988) Tools Tillage VI: 3-32
Nicki J. Whitehouse1, M. J. Bunting2, M. McClatchie3, P. Barratt1, R. McLaughlin4, R. Schulting5 and A. Bogaard5
Land cover and use are compared for Neolithic Ireland, revealing complex inter-relationships between land cover and the archaeological record. Land-cover data can be misinterpreted when isolated from the land-use activities that help shape them, while land-cover data complements land-use datasets.
Land-use and land-cover changes have shaped our landscapes and ecological communities. We summarize land-use and land-cover changes for the period 6-4.2 ka BP (4000-2200 cal BCE; the Neolithic period for Ireland) as represented by cereal remains, pollen data, and limited zooarchaeological data (McClatchie et al. 2014, 2016; Whitehouse et al. 2014; McLaughlin et al. 2016). The earliest Neolithic in Ireland is dated to ca. 4000 cal BCE (~6 ka BP), but much of the demonstrably “Neolithic” archaeology dates from about 3750 cal BCE, when we see an abundance of rectangular houses and the first appearance of domesticated animals and plants. Neolithic archaeological material before 3750 cal BCE is limited – although not completely absent (McLaughlin et al. 2016; Schulting et al. 2017) – while the profusion of sites after this date indicates a radical transformation of human society and its associated cultural landscape.
The Neolithic is divided into:
Early Neolithic I (ENI) 4000-3750 cal BCE
Early Neolithic II (ENII) 3750-3600 cal BCE
Middle Neolithic I (MNI) 3600-3400 cal BCE
Middle Neolithic II (MNII) 3400-3000 cal BCE
Late Neolithic (LN) 3000-2500 cal BCE (Whitehouse et al. 2014).
Land use
 |
|
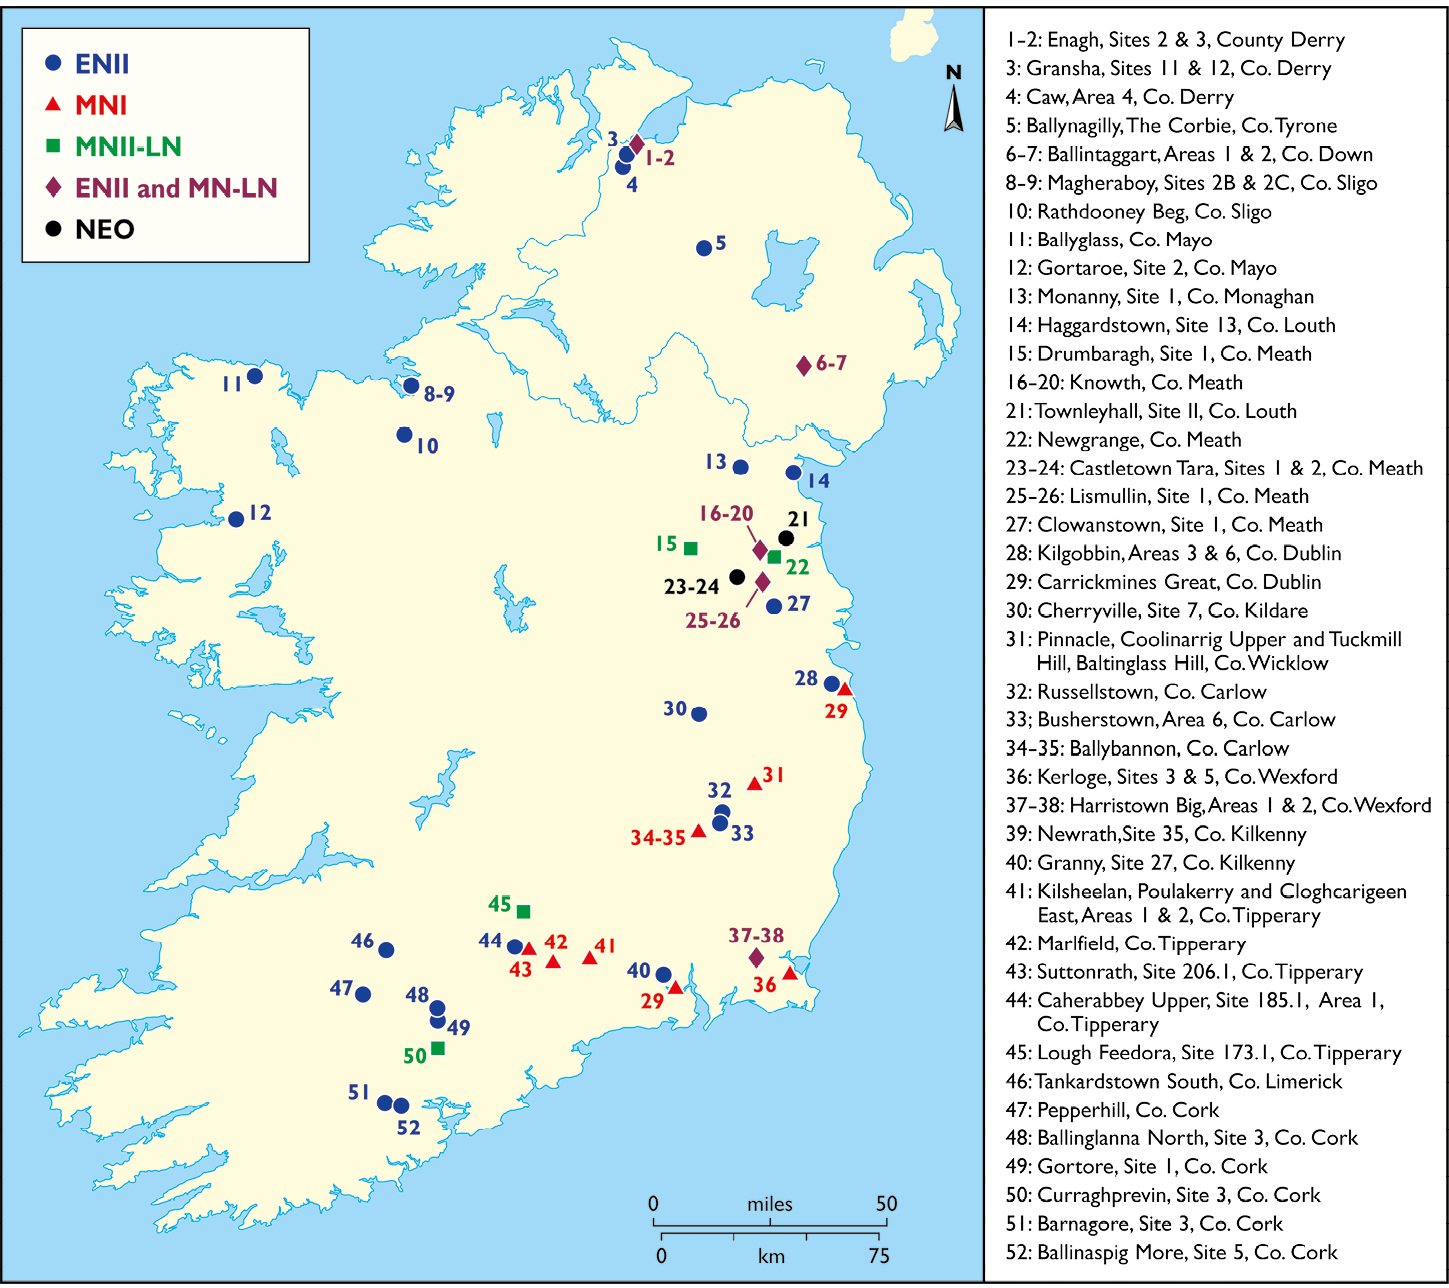
Figure 1: Distribution of archaeobotanical sites by time slice (note: some periods have been merged due to limited datasets. NEO: indeterminate Neolithic period). Sites follow Whitehouse et al. (2014). |
Archaeobotanical data derive from 52 sites (Fig. 1) assigned to the above time periods, using Bayesian site chronologies (McClatchie et al. 2014). Wheat and barley were being cultivated at many sites by 3750-3600 cal BCE (ENII), including emmer wheat (Triticum dicoccum Schübl.), possible einkorn wheat (Triticum monococcum L.), naked wheat (Triticum aestivum/durum/turgidum L.), naked barley (Hordeum vulgare L. var. nudum) and hulled barley (Hordeum vulgare L.). Flax (Linum usitatissimum L.) was also cultivated. Emmer wheat was the dominant cereal, most notably during the ENII and MNI periods. Cereals were present at only a small number of MNII–LN sites and included emmer wheat, naked wheat and indeterminate barley, with increased occurrences of the latter. From 3400 cal BCE (MNII), there is a reduction in archaeobotanical data and reduced human settlement evidence (McLaughlin et al. 2016).
Communities were also making use of locally available wild resources. Most assemblages contained a range of gathered foods, especially hazelnuts but also apple, bramble and sloe. Hazelnut shell fragments are present at 70-90% of sites, with decreasing levels in the MNII-LN. Fruit remains (e.g. crabapple, bramble) occur at a significant minority of sites, rising to 36% of MNII–LN sites. The regular occurrence of potential wild foodstuffs, as well as cereals, indicates a land use that included many different types of plant resources (McClatchie et al. 2014). Thus, areas devoted to cereal cultivation would have been present alongside the use and potential management of wild resources.
Management of agricultural plots was investigated by analyzing the ecological characteristics of potential arable weeds (Ellenberg et al. 1992; Bogaard 2002). Plants of disturbed places and annuals dominate the arable weeds, and likely indicate highly disturbed, permanently tilled cultivation plots and that people were not using shifting cultivation practices (McClatchie et al. 2014). This implies intensive management and investment of plots most akin to intensive garden cultivation and cultivation of plots under permanent agriculture.
EN II-MNI sites are distributed on the eastern and southern coastal regions of the island, along many of the river valleys, on prime agricultural soils (Whitehouse, unpublished data), with cultivation fields likely located close to settlements. Pockets of activity are present in the north and west; almost certainly vestiges of wider activities in these areas. There is little evidence for cultivation occurring in central areas of Ireland, today covered by extensive wetlands. During MNII-LN, sites are largely restricted to easterly areas; however, the paucity of evidence may be a reflection of taphonomic biases (McLaughlin et al. 2016).
Land cover
Pollen land-cover modeling was undertaken using the REVEALS model (Sugita 2007; Woodbridge et al., this issue). Pollen-count data were used covering the archaeological periods of interest; records originated from a single large site (lakes, bogs) or from a minimum of three smaller sites located close together (smaller lakes, mire sites). Age models for the selected sites were developed so we could group results into the relevant archaeological periods. Forest hollows were excluded because of their strong local pollen signal. The spatial scale of REVEALS reconstructions is ~100 x 100 km (Hellman et al. 2008; Trondman et al. 2016).
 |
|
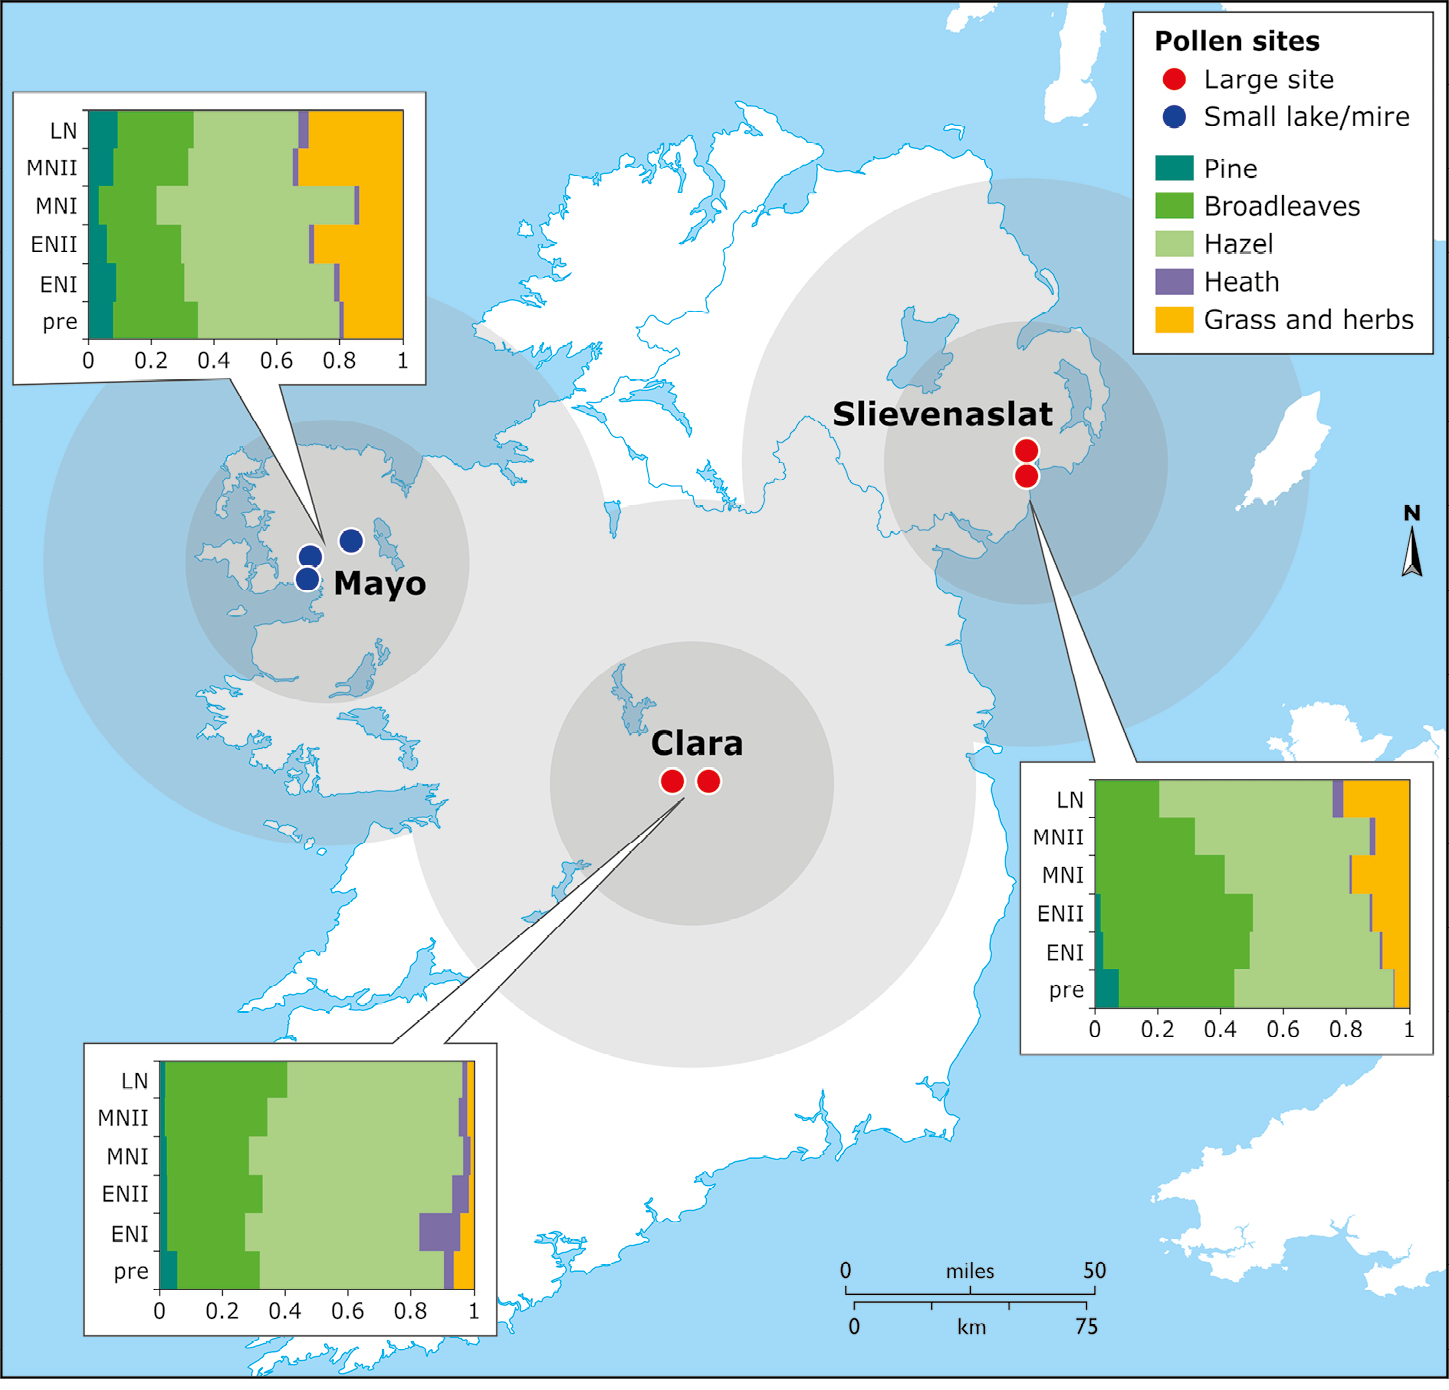
Figure 2: REVEALS reconstructions of land cover for Neolithic Ireland in the six time slices (see text), with oldest at the bottom of the y-axis and most recent at the top. Values on the x-axis represent the proportions of the assigned land-cover type. Circles represent the approximate catchment represented by the REVEALS reconstructions. |
The reconstruction (Fig. 2) indicates woodland represents 80-90% of land cover, primarily consisting of broadleaf trees, with more pine represented in the west (County Mayo) than in the east. In the east, woodland cover represented ~80-95% of land cover over the Neolithic; on the west coast it declined from 80% to 70%, indicating more open areas than easterly locations. Central locations were almost 100% woodland cover; this actually increased during the Neolithic. This suggests Neolithic people did not generally infiltrate the central districts of the Midlands of Ireland at this time (Whitehouse et al. 2014; Fig. 1).
Hazel was an important component of woodland, making up ~40% of land cover. Although this shows an overall decline over the course of the Neolithic, hazel land cover increased by about ~10% in the east and west during MNI and MNII, before decreasing again to roughly similar levels. This represents either re-afforestation by hazel or increased hazel pollen production at this time. There is limited heathland and mire cover, despite its importance in the landscape today.
We see a general trend of increasing openness: ~5-30% of the landscape, likely reflecting some regional differences in land-use activities and settlement patterns and subtle differences in vegetation composition. There is, however, no marked clearance event, but rather a gradual process of opening of the landscape. In the west, open values were considerably higher than elsewhere. Early farmers may have taken advantage of already open habitats and increased areas of open land through pastoralism.
Integrating land use and land cover
Land-use data inform us about the archaeological activities at the local spatial scale, while estimated land-cover data provides an understanding at the regional spatial scale. Land cover in ENI and ENII indicates that between 10-20% of land was open in character, likely linked to land use from settlements, cereal cultivation, and animal grazing as well as some naturally open areas. While this is already in evidence during ENI, when open land-cover changes are modest, during ENII these effects became more pronounced, with clearance of an additional ~5-10% open land.
Land-cover modeling provides important insights into the re-afforestation phase in MNI (in the east) and MNII (in the west), consisting of increases in hazel wood coverage. Several possibilities could explain this: (i) a change in land use due to land abandonment and secondary succession by hazel into previously open areas (e.g. due to population decline), or people becoming more dispersed in the landscape or changing the location of their activities; (ii) increased hazel flower and pollen production due to coppicing for nut production, fencing and hurdle production (Waller et al. 2012) and (iii) post-recovery succession of hazel following burning of woodland to facilitate woodland grazing, as suggested for Neolithic Central Europe (Jacomet et al. 2016). This episode represents a change in land use that is likely associated with human behaviors. Possible climatic changes are unlikely to explain the increases seen in hazel pollen directly because of the uneven responses across the island, although climate may have indirectly driven aspects of land-use change (Whitehouse et al. 2014).
The combination of land-use and land-cover data allows a much fuller and meaningful interpretation of the datasets; both land-use and land-cover interpretations are enriched when combined.
acknowledgements
Aspects of this work were funded by the Heritage Council, Republic of Ireland INSTAR Research Programme for 'Cultivating Societies: Assessing the Evidence for Agriculture in Neolithic Ireland’ (Ref: 16682).
affiliations
1School of Geography, Earth and Environmental Sciences, Plymouth University, UK
2School of Environmental Sciences, University of Hull, UK
3School of Archaeology, University College Dublin, Ireland
4Archaeology/Palaeoecology, Queen’s University Belfast, UK
5Institute of Archaeology, University of Oxford, UK
contact
Nicki J. Whitehouse: nicola.whitehouseplymouth.ac.uk
references
Bogaard A (2002) Veg Hist Archaeobot 11: 155-168
Ellenberg H et al. (1992) Zeigerwerte von Pflanzen in Mitteleuropa. Scripta Geobot 18, 258 pp
Hellman S et al. (2008) Veg Hist Archaeobot 17: 445-459
Jacomet S et al. (2016) Holocene 26: 1858-1874
McClatchie M et al. (2014) J Arch Sci 51: 206-215
McClatchie M et al. (2016) Antiquity 350: 302-318
McLaughlin R et al. (2016) J World Preh 29: 117-153
Schulting R et al. (2017) Proc Preh Society 83: 305-323
Sugita S (2007) Holocene 17: 229-241
Trondman A-K et al. (2016) Veg Hist Archaeobot 25: 131-151
Simulating vegetation in ancient Japan using HUMPOL: A pollen-based multi-scenario modeling approach
Lauren Bell1, E. Crema2, M.J. Bunting3 and M. Madella4
We present a hypothetical vegetation map for the largest Jōmon settlement in Japan (ca. 5900-4100 BP) based on simulated pollen dispersal in the landscape using fossil pollen data. It suggests intentional planting of chestnut groves within the settlement area.
The simulation of vegetation in past landscapes can be important for archaeologists attempting to reconstruct ancient land-use and human-induced land-cover changes. This research focuses on the application of the software HUMPOL (Bunting et al. 2004), a modeling suite based on the “Prentice-Sugita model” from the REVEALS-LOVE algorithm of pollen dispersal and deposition in lakes and bogs – similar to the approach used in POLLANDCAL (Sugita 2007a,b; Sugita 1994; Sugita et al. 1999). However, HUMPOL expands on this by enabling the testing of multiple vegetational hypotheses on known landscape parameters, known as the Multi-Scenario Approach (MSA; Bunting and Middleton 2009). HUMPOL has been used in Europe to determine the extent of human impacts on past vegetational landscapes (e.g. Caseldine and Fyfe 2006; Gaillard et al. 2008). Models can provide insight into patterns otherwise invisible in the archaeological record. They are particularly useful when studying large areas with multiple data sources. HUMPOL is a valuable tool with which the user can test hypotheses on past landscapes by altering multifarious environmental parameters and variables (e.g. degree of vegetational openness) to assess their effect on vegetation cover.
Using HUMPOL for vegetation reconstruction
HUMPOL is most effectively used for vegetation reconstructions at local to sub-regional spatial scales, particularly in projects with good pollen core coverage and a robust chronology for the relevant time slices. To successfully define landscape parameters for the input map, we must assume the dominant pollen taxa reflect the different vegetation/landscape/land-use types in their ecological system. Pollen dispersal is simulated using this input map.
 |
|
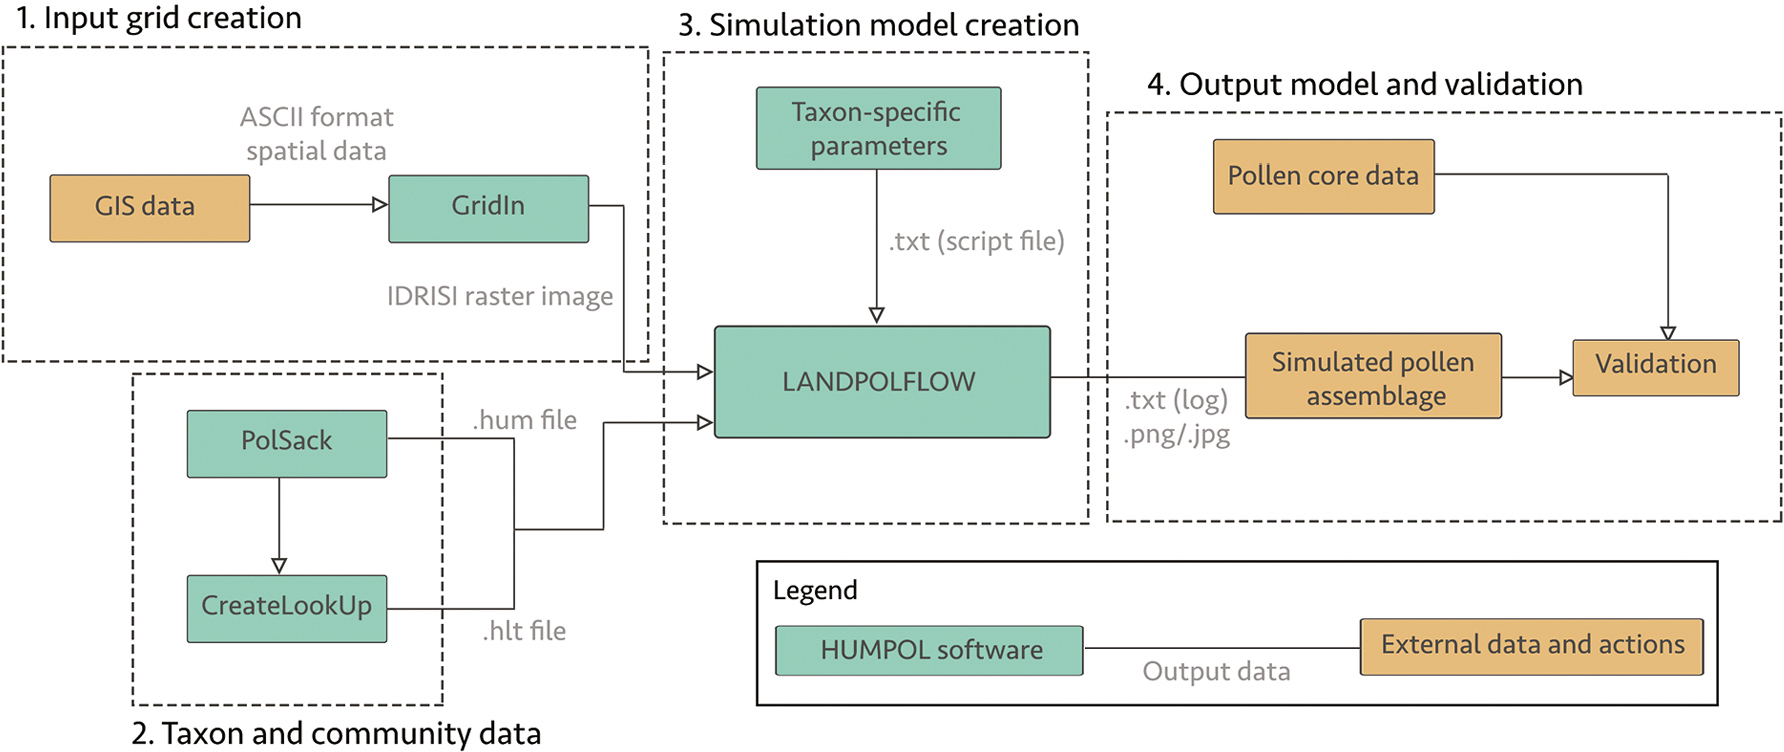
Figure 1: A workflow for the HUMPOL software suite. GridIn converts ASCII-format spatial data into the IDRISI-format grid with a specified cell size. PolSack creates unique identifiers and allows input of data for each taxon, community, and pollen core. CreateLookUp creates a distance-weighted vegetation lookup table based on abundance and location of each taxon in the landscape using the Prentice-Sugita model. Script file (.txt) contains all programmable instructions for the landscape parameters and MSA variables. LANDPOLFLOW simulates the dispersal and deposition of pollen in the hypothetical landscape based on data from all the above. |
One major prerequisite for HUMPOL input grid creation is landscape data, most crucially on elevation and hydrology. Geology and soil information can also be included. Unfortunately, as not all spatial data can be placed directly into the HUMPOL software suite, preparation of the data is usually one of the first stages in the modeling process (Fig. 1). The elevation data can be obtained from a high resolution Digital Elevation Model (DEM).
When creating the simulated landscapes, each selected pollen taxon and its preferences in terms of landscape parameters will affect where the pollen will be deposited on the grid, and determine its abundance once it reaches the plant’s ideal habitat. For this, the ecological preferences of each plant taxon used in the study need to be known, such as tolerance to slope, facing direction of the slope, and wetness (Fig. 1). To simulate pollen deposition in the pre-defined landscape, HUMPOL also requires pollen productivity estimates (PPE) and fall speed values for each taxon. Pollen productivity differs between plant taxa: for instance, trees generally produce more pollen than herbs. Furthermore, size and shape differs between pollen-morphological types, which affects their aerodynamics and thus the speed at which they are transported by wind and the distance they travel. PPEs are generally obtained empirically using field data, i.e. datasets of modern pollen assemblages from multiple pollen traps across a specific ecological system (e.g. Mazier et al. 2012). Fall speed is calculated based on measurements of pollen grains for each plant taxon on the basis of Stoke’s Law, which describes fall speed of small particles in the air (see also Dawson et al., this issue). Once pollen assemblages are simulated for the hypothetical landscape, they can be compared to the fossil pollen record (Fig. 1).
HUMPOL at Sannai Maruyama - secondary forest or chestnut gardens?
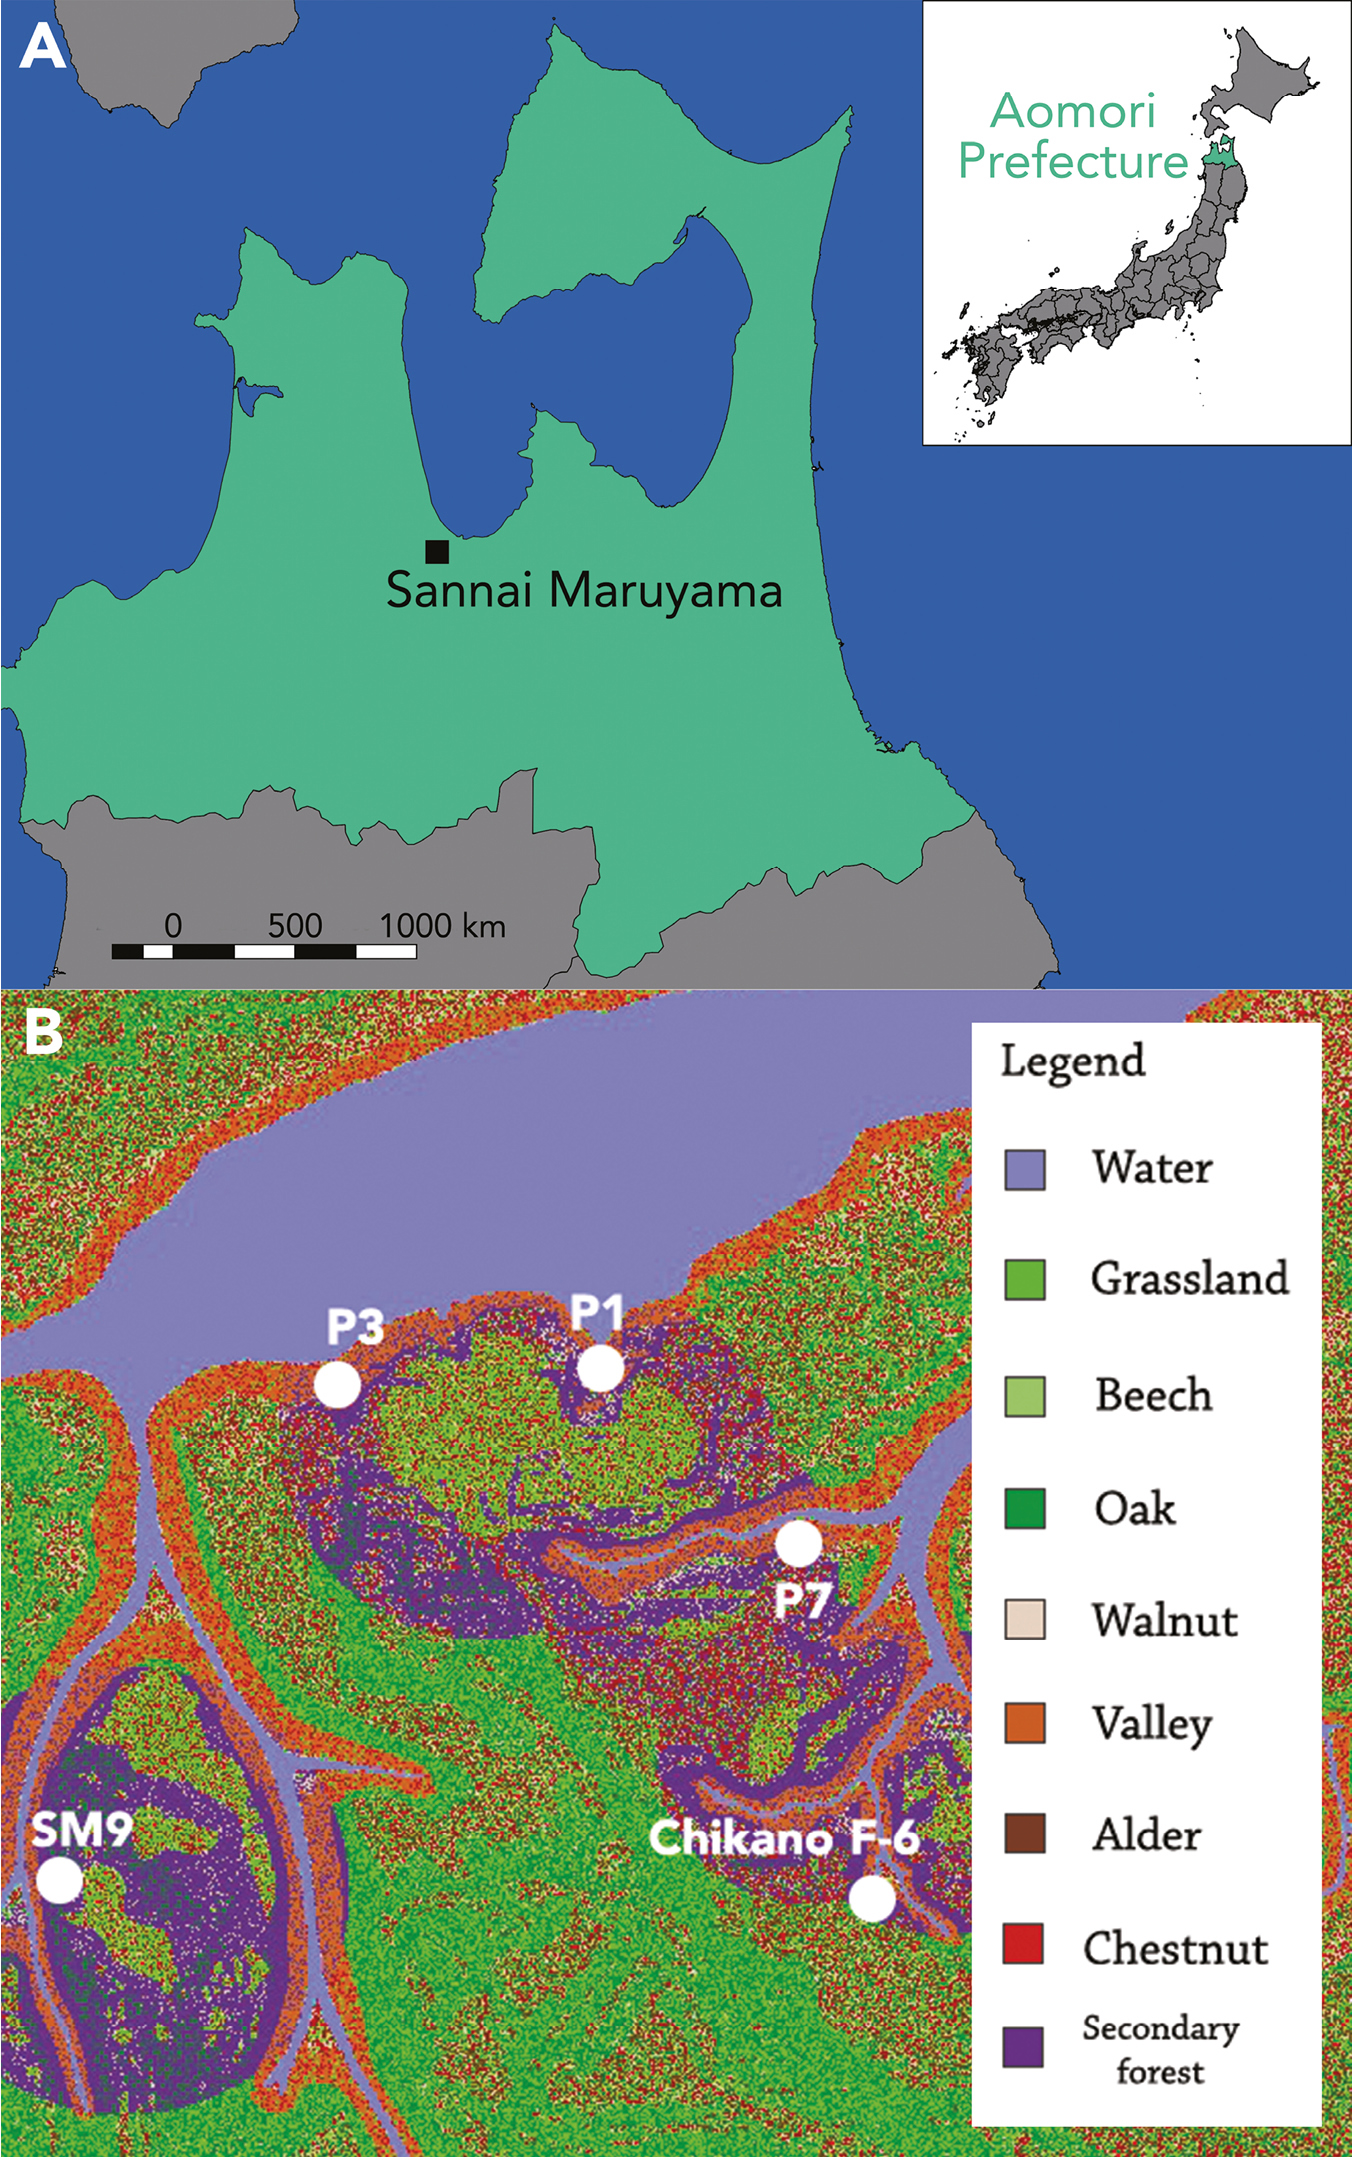
Sannai Maruyama is situated on a hilltop surrounded by valleys which lead into the Okidate River in modern-day downtown Aomori City in northern Japan (Fig. 2a), and is one of the largest Jōmon settlements known to date. Settled from ca. 5900-4100 BP, Sannai Maruyama displays evidence of pit dwellings, mounds, pottery, clay figurines, and stone implements (Kawahata et al. 2009; Tsuji and Nakamura 2001). Environmental data obtained from waterlogged areas suggest that during occupation there was a prevalence of chestnut trees around the site, a feature rarely seen in Jōmon sites. As chestnut (Castanea crenata Siebold & Zucc.) is a sun-loving, insect-pollinated tree, it naturally grows sparsely in valley settings. Human intervention therefore seems the only possibility for expanding its presence (Yoshikawa 2011). The purpose of this research was to test whether climate, passive human presence, or active management of the landscape could be identified as key factors for chestnut’s expansion at this time.
 |
|
Figure 2: (A) Map of Sannai Maruyama within Aomori Prefecture; (B) The output map from LANDPOLFLOW showing the hypothetical vegetation for the anthropic model (1.4 km2). This map resulted in the simulated pollen assemblages with the best statistical fit for the fossil pollen assemblages from the five pollen records P1, P3, P7, Chikano F6 and SM9 (white dots). |
Five pollen cores from adjacent valleys were selected due to their reliable dating to around 5100 cal. BP, their spread across the site, and sufficient representation of key dominant taxa. As geology and soil characteristics did not vary enough to have had an effect on vegetation, only a DEM of the area (1.4 km2) and a reconstructed hydrological map were used. PPEs and fall-speed values were acquired from studies in Europe (Mazier et al. 2012) and Japan (Bunting, pers. comm.). To assess the scale of human impact on the vegetation at Sannai Maruyama, two landscape scenarios were created in HUMPOL from two time slices: (1) pristine natural vegetation before the establishment of the settlement; and (2) anthropic vegetation at the time of peak settlement occupation. In the second scenario, three main factors were accounted for. As climate was warming around 5100 cal. BP, the effects of this on the pollen record were explored by increasing the abundance of sun-loving species, Castanea, Juglans and Aesculus. The presence of a secondary forest, as hypothesized by Nishida (1983), was represented in the simulation as a community of taxa associated with human exploitation around the settlement areas. To simulate the effects of intentional fires, variables for landscape openness were used in the settlement areas and in the secondary forest.
The results showed that it is possible to attain a close match to the pollen record at Sannai Maruyama and reproduce some of the expected patterns based on hypothesized anthropic effects on the vegetation (Fig. 2b). Because it was difficult to replicate the values of Castanea and Gramineae, it can be suggested that Jōmon management methods involved transplanting chestnut trees into the settlement area from saplings collected from the valleys. This disproves Nishida’s (1983) hypothesis regarding the layout of the secondary forests. If the modeled hypothetical landscape is correct, it would imply that the areas with pit dwellings were lined with chestnut groves whose produce was shared within the community. However, the HUMPOL software suite is limited in its representation of insect-pollinated plant taxa, such as Castanea. This is because the Prentice-Sugita model assumes that all pollen is dispersed by wind; therefore, the simulated pollen assemblages might be misleading. Nevertheless, using HUMPOL for this project has been very useful as an exercise in assessing the effects of potential causes of vegetation changes in the landscape, although further exploration is needed to reach more definitive conclusions. More reliable dates for the other existing pollen records from Sannai Maruyama, for example, would improve the resolution of the models produced. Comparisons to other similar settlements with good pollen-core coverage could also be valuable for furthering this research.
acknowledgements
This paper is based on a dissertation undertaken for a BSc in Archaeology at University College London (UCL). With thanks to Prof. Junko Habu for helping to start this project, and Prof. Mark Lake for supervising the dissertation.
affiliations
1School of Archaeology, University of Oxford, UK
2Department of Archaeology, University of Cambridge, UK
3Department of Geography, University of Hull, UK
4Department of Humanities (CaSEs, ICREA), University Pompeu Fabra, Barcelona, Spain
contact
Lauren Bell: lauren.bellhmc.ox.ac.uk
references
Bunting MJ et al. (2004) Holocene 14: 651-660
Bunting MJ, Middleton R (2009) Holocene 19: 799-803
Caseldine C, Fyfe R (2006) Quat Sci Rev 25: 632-644
Gaillard MJ et al. (2008) Veg Hist Archaeobot 17: 419-443
Kawahata H et al. (2009) Quat Sci Rev 28: 964-974
Mazier F et al. (2012) Rev Palaeobot Palynol 187: 38-49
Nishida M (1983) J Anthropol Archaeol 2: 305-322
Sugita S (1994) J Ecol 82: 881-897
Sugita S et al. (1999) Holocene 9: 409-421
Sugita S (2007a) Holocene 17: 229-241
Sugita S (2007b) Holocene 17: 243-257
Stefano Biagetti1,2, C. Lancelotti1, A. Zerboni3, D. Usai4,5 and M. Madella6
Although excluded from most maps of current and past land use, dryland rain-fed (non-irrigated) agriculture has been and is pivotal to enhance resilience of human communities, and understand land-atmosphere interactions and regional climate in many parts of the world.
On a warming Earth, reclaiming traditional knowledge related to low-demanding plant varieties and cultivation techniques that reduce land degradation is a priority. Drylands are generally defined as “challenging” for non-irrigated agriculture (Rockström and Karlberg 2009), since artificial watering is considered necessary to secure regular crop yields. The Sahara and its margins are one of the most emblematic drylands. This region is often considered “inactive” from an agricultural point of view (Rockström and Falkenmark 2015). Land-use models and maps of Africa normally characterize the Sahara as a huge empty area stretching from the northern edge of the Sahel up to the Mediterranean coast and the Atlas Mountains. Similarly, current technical reports and studies on food production in drylands (e.g. UNEMG 2011) tend to consider the Sahara devoid of plant cultivation. The amount and extent of rain-fed agriculture in drylands is also important in terms of biogeochemical and biogeophysical processes between land surface and the atmosphere, therefore impacting on climate both in the past and the future.
Rain-fed agriculture in the Sahara
 |
|
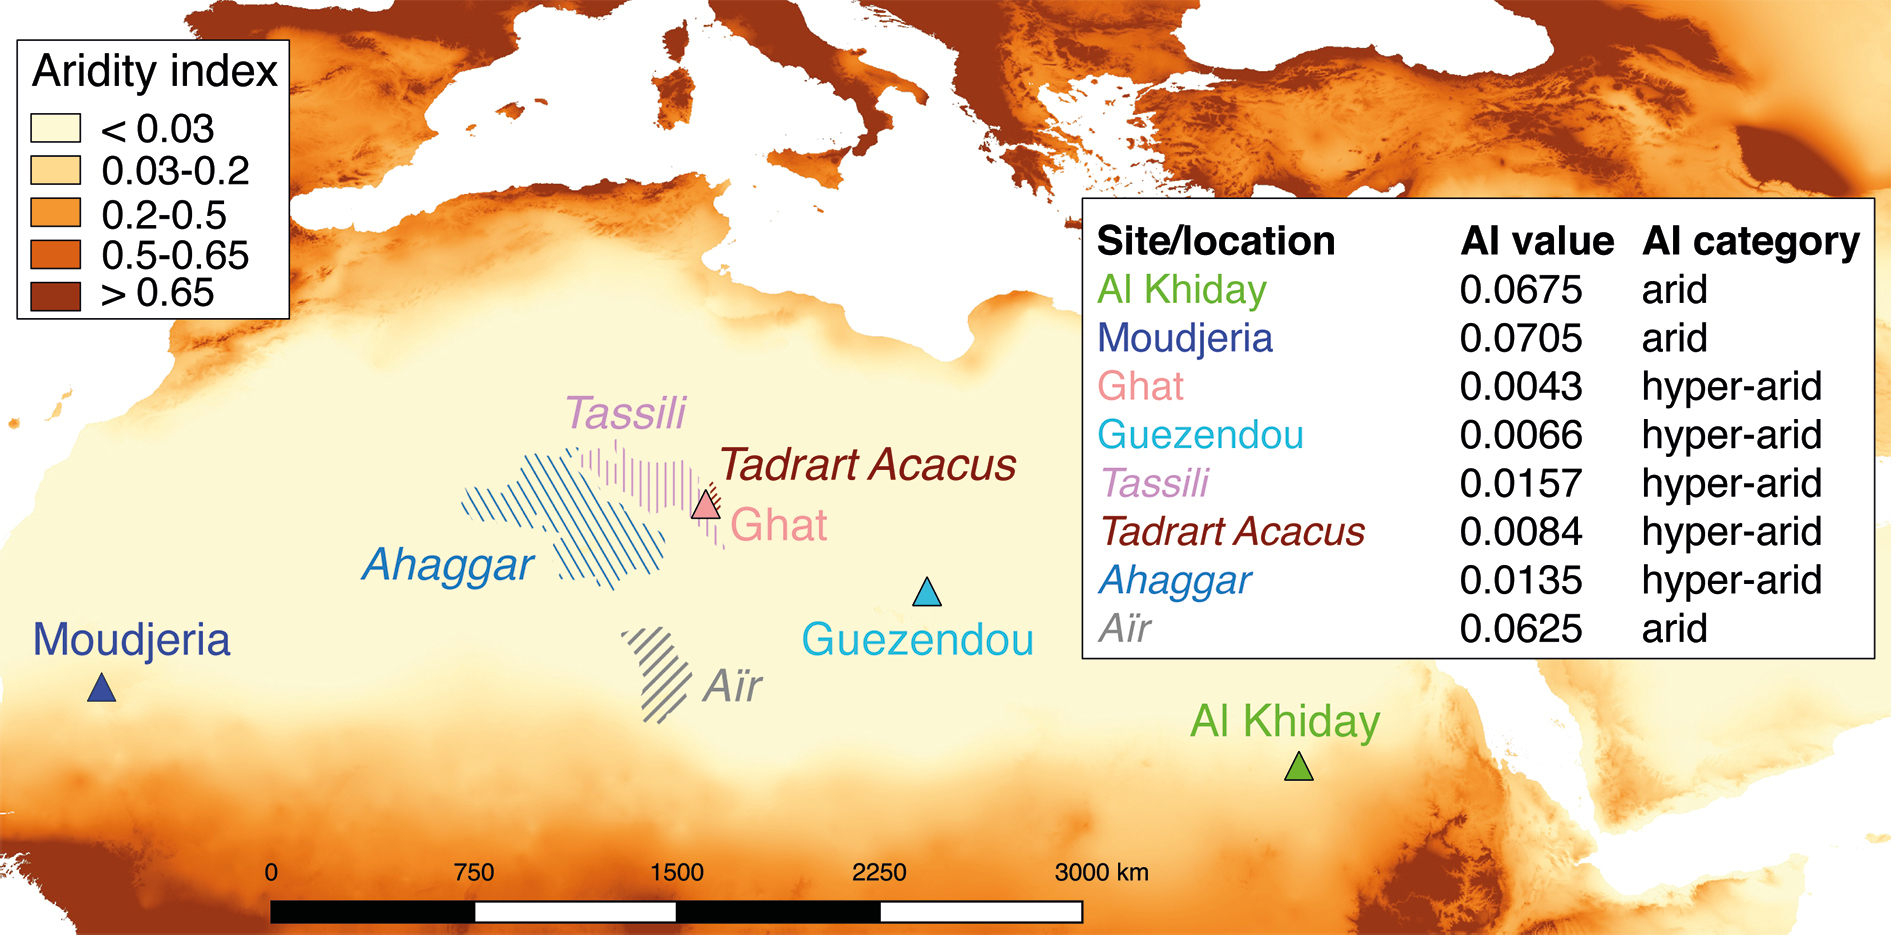
Figure 1: Aridity Index (AI) from the Consultative Group for International Agricultural Research Consortium for Spatial Information (CGIAR-CSI) and the localities mentioned in the text. Triangles indicate specific locations, while shaded areas and italics names refer to regions with evidence of past (and possibly current) plots of rain-fed agriculture. The AI takes into account the values of precipitation, temperature and potential evapotranspiration. The mentioned cases of rain-fed agriculture in the Sahara fall within the “hyper-arid” or “arid” class, well beyond the threshold for the supposed suitability of rain-fed agriculture. |
The perceived dominance of pastoralism, together with the idea that hot deserts are unsuitable for raising crops, seems to have eclipsed the role that cultivation has had over time in these regions. It is therefore not surprising that the extent of rain-fed agriculture in the Sahara is poorly researched. Yet, notes published over the last two centuries suggest the occurrence of this practice in different parts of this desert (Fig. 1). In central Mauritania, in the Moudjeria area, where average rainfall is 170 mm a-1, rain-fed crops were observed in the early 1960s (Toupet 1963) and pastoral communities were reportedly growing cereals without irrigation. In the Ahaggar Mountains (also known as the Hoggar Mountains), where the rainfall varies between 0 and 100 mm a-1, millet (without further specification) was grown in the past (see Duveyrier 1864). Nicolaisens and Nicolaisens (1997) reported the existence of a specific word (“tawgest”; de Foucauld 1951) to designate non-irrigated plots of land cultivated by the Tuareg people along the valleys of the Ahaggar. In the Aïr massif, where average precipitation is 120 mm a-1, Rodd (1926) wrote that “… in certain areas rain-grown crops could be raised most years. In the past a fair amount of cereals seems to have been produced this way…”, obviously hinting at a decrease in this practice. The engagement of nomadic Tuareg with rain-fed farming was reported also in the Tassili n’Ajjer region (now a national park) by the early 1950s (Nicolaisens and Nicolaisens 1997). This practice was further recorded in the Libyan south-west, namely in the Tadrart Acacus (di Lernia et al. 2012), and around the city of Ghat (Bourbon del Monte Santa Maria 1912). These last reports are surprising given the very low (and mostly uneven) rainfall in both those Libyan and Algerian regions, ranging from 0 to 40 mm a-1. In the Tibesti mountain range, close to the Guezendi area, cereal plots were observed in the 1940s (Desio 1942) in areas with less than 50 mm a-1 rainfall. This clearly shows a rain-fed agricultural strategy that complements pastoral and foraged resources. Such strategies have been largely ignored in past and current discourse of resource exploitation in the Sahara.
The case of Al Khiday, Sudan
 |
|
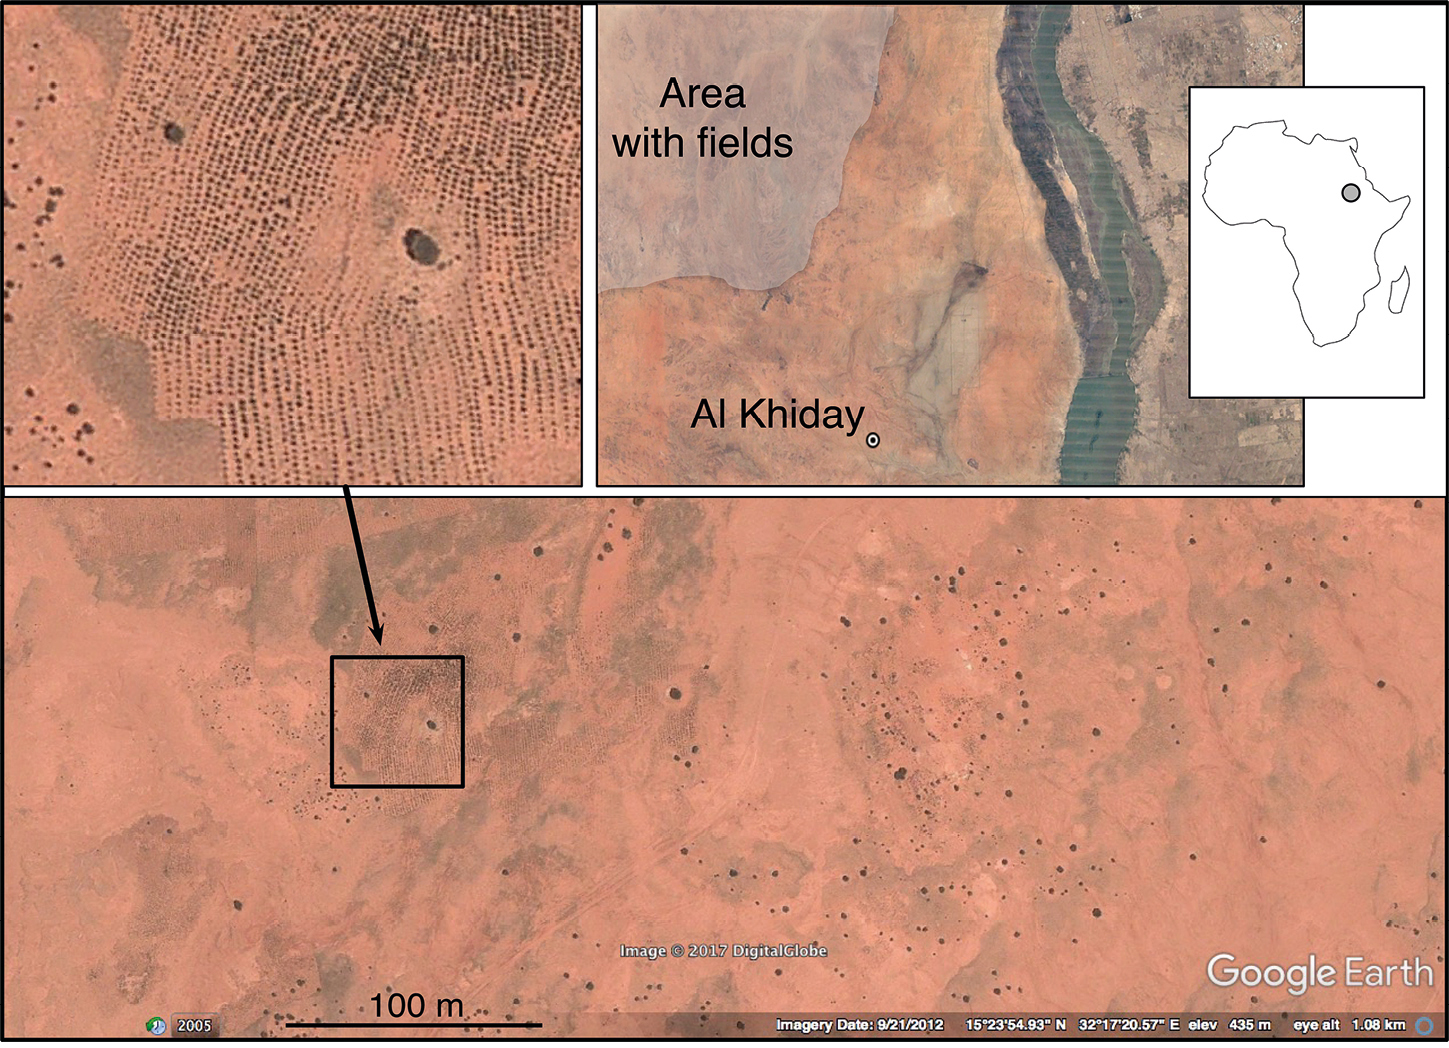
Figure 2: GoogleEarthTM view of one of the fields recorded at Al Khiday. Imagery taken in September 2012. Rows formed by millet plants, ready to be harvested, are shown. |
Recent explorations of the desert in the area of Al Khiday in Central Sudan (Fig. 2) are providing new, extensive and systematized data on rain-fed agriculture. The region today is arid (according to both the Köppen–Geigen and the CGIAR-CSI Aridity Index classifications; Zomer et al. 2008) with a yearly average rainfall of ca 100 mm. Several rain-fed fields between 15 and 30 km west of the White Nile left bank were recently surveyed. The observation of free satellite imagery time series (GoogleEarthTM) shows that 70 mm of precipitation in July/August is enough to enable the cultivation of extremely large expanses of land (up to ca. 120 ha per field system; Fig. 2). The cultivated areas are divided in plots owned by different families from neighboring villages, whose people are also engaged in wage labor and may own some small stock. The main crop is pearl millet (Pennisetum glaucum L. R.Br.), although in wetter years cash crops, such as karkadé (hibiscus), are also cultivated. After the late spring/early summer rains, the fields are prepared by clearing wild grasses (hoeing) while the soil is still wet. Farmers then walk the fields along parallel lines, making holes for seeds roughly every meter. The sown fields are then left unattended until the harvest in September when farmers use iron sickles to cut the plants just above the ground. Grains are then threshed in the fields and the by-products are left for the domestic stock (goats, sheep, donkeys) to graze.
No data are currently available for productivity of rain-fed agriculture in arid or hyper-arid lands, and a first preliminary evaluation of the productivity of the Al Khiday fields gives a value of ca. 100 kg of millet per hectare. This estimate is based on plant density and average single-plant seed production. This figure is clearly much lower than production from the world’s dry sub-humid and semi-arid regions, where rain-fed agriculture yields vary between 0,5 and 2 t ha-1 (e.g. Wani et al. 2003). In spite of the low yield, local farmers are able to produce double the quantity of millet necessary for the families' annual needs, leaving part of the crop to be sold at local markets after setting aside enough grain for the next planting season. It is astounding that this kind of cultivation not only supplies the families with important dietary carbohydrates, but also supplies some income.
Final remarks
Millets, and specifically pearl millet, are key crops in drylands because of their short growing season and the abundant productivity under aridity and high temperatures. Millets can also be used as fodder, either using the entire plant before grains mature or the by-products from grain processing. They are therefore perfectly suited for mixed agro-pastoral systems. Pearl millet is a critical West African domesticate, and the Sahel zone south of the Sahara is an important area for its domestication (Fuller 2007). However, research on past crops in Africa’s drier areas is still limited, and rain-fed practices have never been part of the current discourse on the origin of agriculture, its detection, and extensification/intensification dynamics. Research on ancient rain-fed farming in the Sahara (and other deserts) is urgently needed to address the role of this strategy in enhancing the resilience of human societies in difficult climatic settings. This research, which is in its earliest stages, is proceeding under the framework of PAGES’ LandCover6k Land Use group. This working group is producing updated and more realistic assessments of past land use in the light of environmental-human-behavior coupled models. Social science research can greatly enhance the value of this work by connecting present-day adaptive behaviors (traditional ecological knowledge) to the deep historical record. This work has the potential to revolutionize our understanding of the past, as well as current and future resilience strategies and policy, both at domestic and governmental levels. Furthermore, it will inform current research on the Anthropocene by establishing a deep connection between human behavior and its effects on environmental and landscape modifications.
Archaeology plays a pivotal role in exploring rain-fed agriculture through a long-term perspective, which enables the evaluation of adaptive strategies and the resilience of such practices. Thus, it is urgent to plan new archaeological research that can document rain-fed farming in drylands over the past millennia in order to appreciate its frequency, structure and distribution over time and space. This approach should include new archaeobotanical and experimental techniques that unambiguously identify past water-crop management directly from the cultivated crops recovered from archaeological contexts.
affiliations
1CaSEs - Complexity and Socio-Ecological Dynamics Group, Universitat Pompeu Fabra, Barcelona, Spain
2School of Geography, Archaeology and Environmental Studies, University of the Witwatersrand, Johannesburg, South Africa
3Department of Earth Sciences “A. Desio”, University of Milan, Italy
4Centro Studi Sudanesi e Sub-Sahariani, Treviso, Italy
5Department of Sciences of Antiquity, Sapienza University, Rome, Italy
6Department of Humanities (CaSEs, ICREA), University Pompeu Fabra, Barcelona, Spain
contact
Stefano Biagetti: stefano.biagettiupf.edu
references
Bourbon del Monte Santa Maria G (1912) L’oasi di Ghat e le Sue Adiacenze, Tipografia dell’Unione Arti Grafiche, 178 pp
de Foucauld C (1951) Dictionnaire Touareg–Français: Dialecte de l’Ahaggar, Imprimerie Nationale de France, 2030 pp
Desio A (1942) Il Sahara Italiano. Il Tibesti Nord-Orientale. Società Italiana Arti Grafiche, 232 pp
di Lernia et al. (2012) In: Sternberg T, Mol L (Eds) Changing Deserts, White Horse Press, 101-128
Duveyrier H (1864) L’exploration du Sahara: Les Touâreg du Nord, Challamel Ainé, 567 pp
Fuller DQ (2007) Ann Bot 100: 903-924
Nicolaisen J, Nicolaisen I (1997) The Pastoral Tuareg: Ecology, Culture, and Society, Thames and Hudson - Rhodos, 877 pp
Rockström J, Falkenmark M (2015) Nature 519: 283-285
Rodd FR (1926) People of the Veil, Macmillan, 504 pp
UN Environment Management Group (2011) Global Drylands: A UN System-Wide Response, UN Press, 132 pp
Mats Widgren
Maps of past agricultural systems suggest two rapid changes: around 1500 CE, as European colonization led to demographic and agricultural collapse in South America, 1870 to 1920 CE, as industrialization and steam transport resulted in a global division of labor.
Historians, archaeologists and historical geographers have been slow in reacting to the increased interest from climate modelers in past land use. However, the research situation for the Americas in the wake of the 500-year anniversary in 1992 of Columbus’s travels did stimulate syntheses on pre-Columbian landscapes (Butzer 1992). Three volumes on the cultivated landscapes of native America were published by Doolittle (2000), Denevan (2001), and Whitmore and Turner (2001). The subsequent dissemination of these syntheses to a broader audience by Mann (2005) should also be mentioned. These studies and publications inspired a cooperative effort by a group of American and Swedish scholars to map the development of global agricultural systems over the last 1000 years under the framework of the project Mapping Global Agricultural History (Widgren 2010). Here, we present, as an example, one of the maps created within the project: agricultural systems in Africa around 1800 CE. We based the development of global categories on the previous work of Whittlesey (1936) and Grigg (1974) on global agricultural regions in the 20th century. We are not mapping land cover, per se, or land-use types, but rather a limited set of globally known agricultural systems, i.e. the presence of agriculture and the dominant type of agricultural system. It is not possible to translate the mapped information into areas of different land-cover or land-use types. For example, a single agricultural system, i.e. mixed farming, was dominant in Northern Europe, where the activities related to crop cultivation and livestock were closely integrated. Land use and land cover could, however, vary widely, from large open fields in the Paris basin to remote farms in northern Scandinavia, where forest was the dominant land cover (Grigg 1974). Presentation of our knowledge on agrarian systems at the global scale in maps nevertheless facilitates comparison with other data and model simulations on land use and land cover.
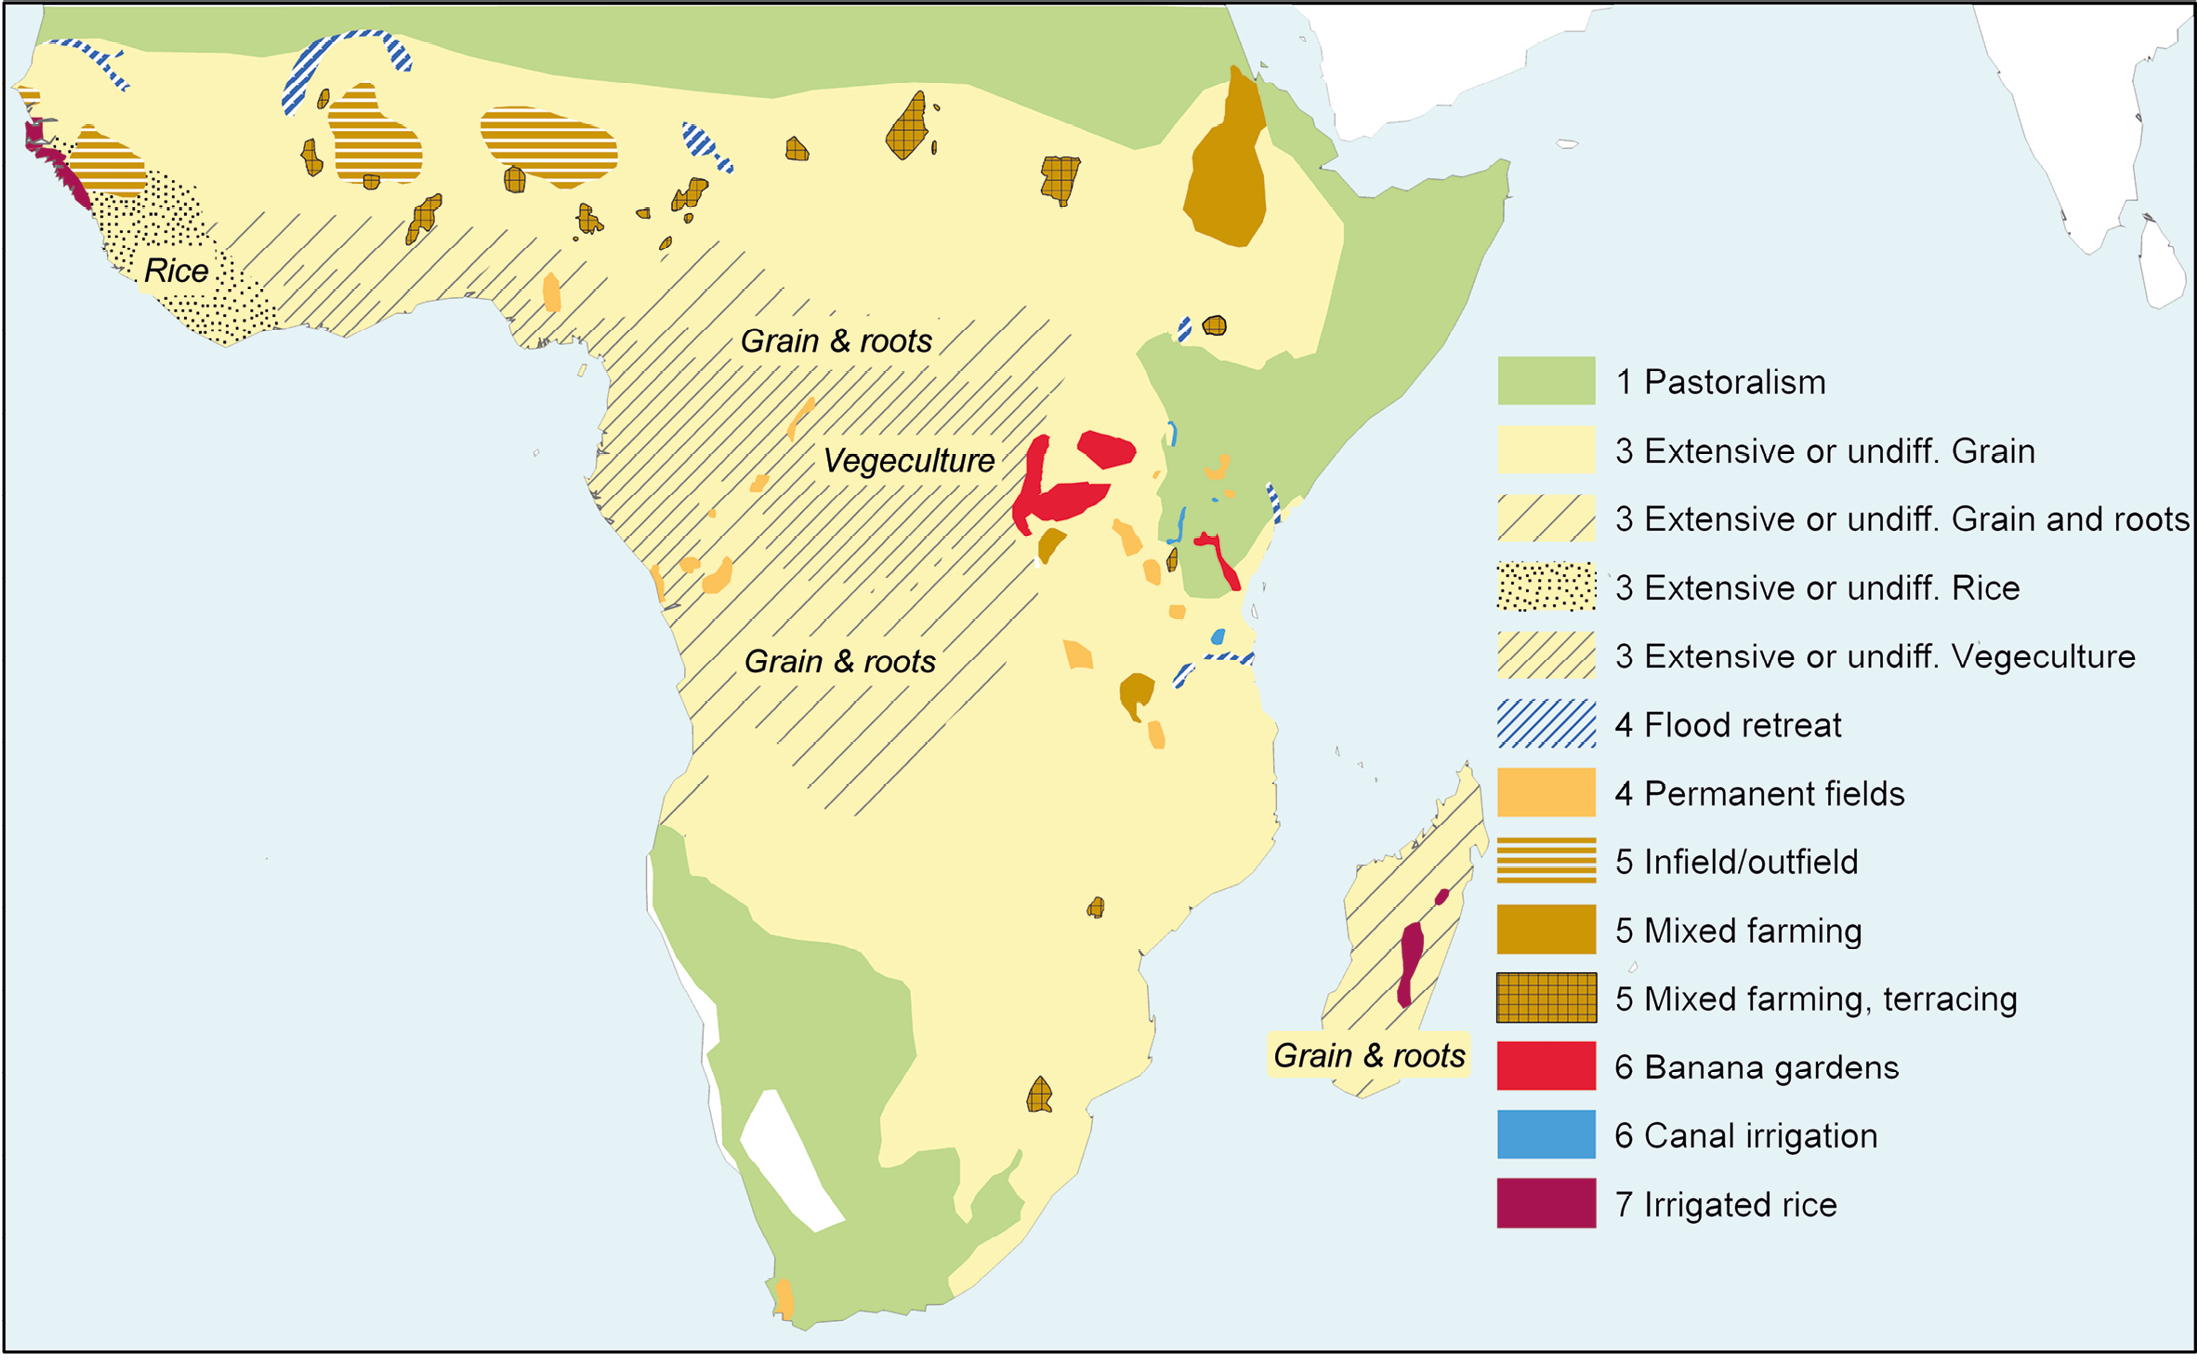
We have striven to keep the number of categories low in order to increase readability of the maps. On the global scale we defined; (1) Pastoralism and ranching, (2) Husbandry of non-domesticated plants, (3) Extensive or undifferentiated agriculture, (4) Permanent fields, (5) Mixed farming, (6) Intensive systems, and (7) Irrigated rice. This classification system is open for discussion and can have advantages or disadvantages depending on different viewpoints and aims. It has proven, however, to work on a global level and make comparisons across and between continents possible. Agricultural systems should preferably be understood on a nominal scale because they are qualitatively different and not immediately possible to translate into an ordinal scale. However, differences in productivity, labor intensity, and in the degree of modification of the land have inspired us to introduce an ordinal scale in the numbering and coloring of the systems. For the continental maps, each category can be further subdivided, as in Figure 1. For a discussion of the global categories and the continental sub-categories for Africa, see Widgren (in press).
 |
|
Figure 1: Agricultural systems in sub-Saharan Africa by 1800 CE. Husbandry of non-domesticated plants (category 2) certainly did exist in Africa, but was practiced in pockets within larger regions of agriculture and has therefore not been mapped. The background data for the map and the GIS-file can be downloaded from Widgren (2017). |
In contrast with anthropogenic land-cover change (ALCC) scenarios like those published by Kaplan et al. (2009) or Klein Goldewijk et al. (2017), we can show particularly rapid changes – “leaps” – that were due to global historical and political events. Such a “leap” occurred when the European colonization of South America (ca. 1500 CE) led to a demographic and agricultural collapse, especially in the Amazon. The other most important leap is the expansion of farming in the second half of the 19th century, when the combination of industrialization and steam transport led to a global division of labor on an unprecedented scale. It is in that context that we can see the expansion of the wheat frontier in western USA and eastern Eurasia, and at the same time a rapidly expanding rice frontier in the outer parts of the Asian deltas. Any modeling based on population growth and per capita consumption in different regions becomes increasingly meaningless from this period onwards.
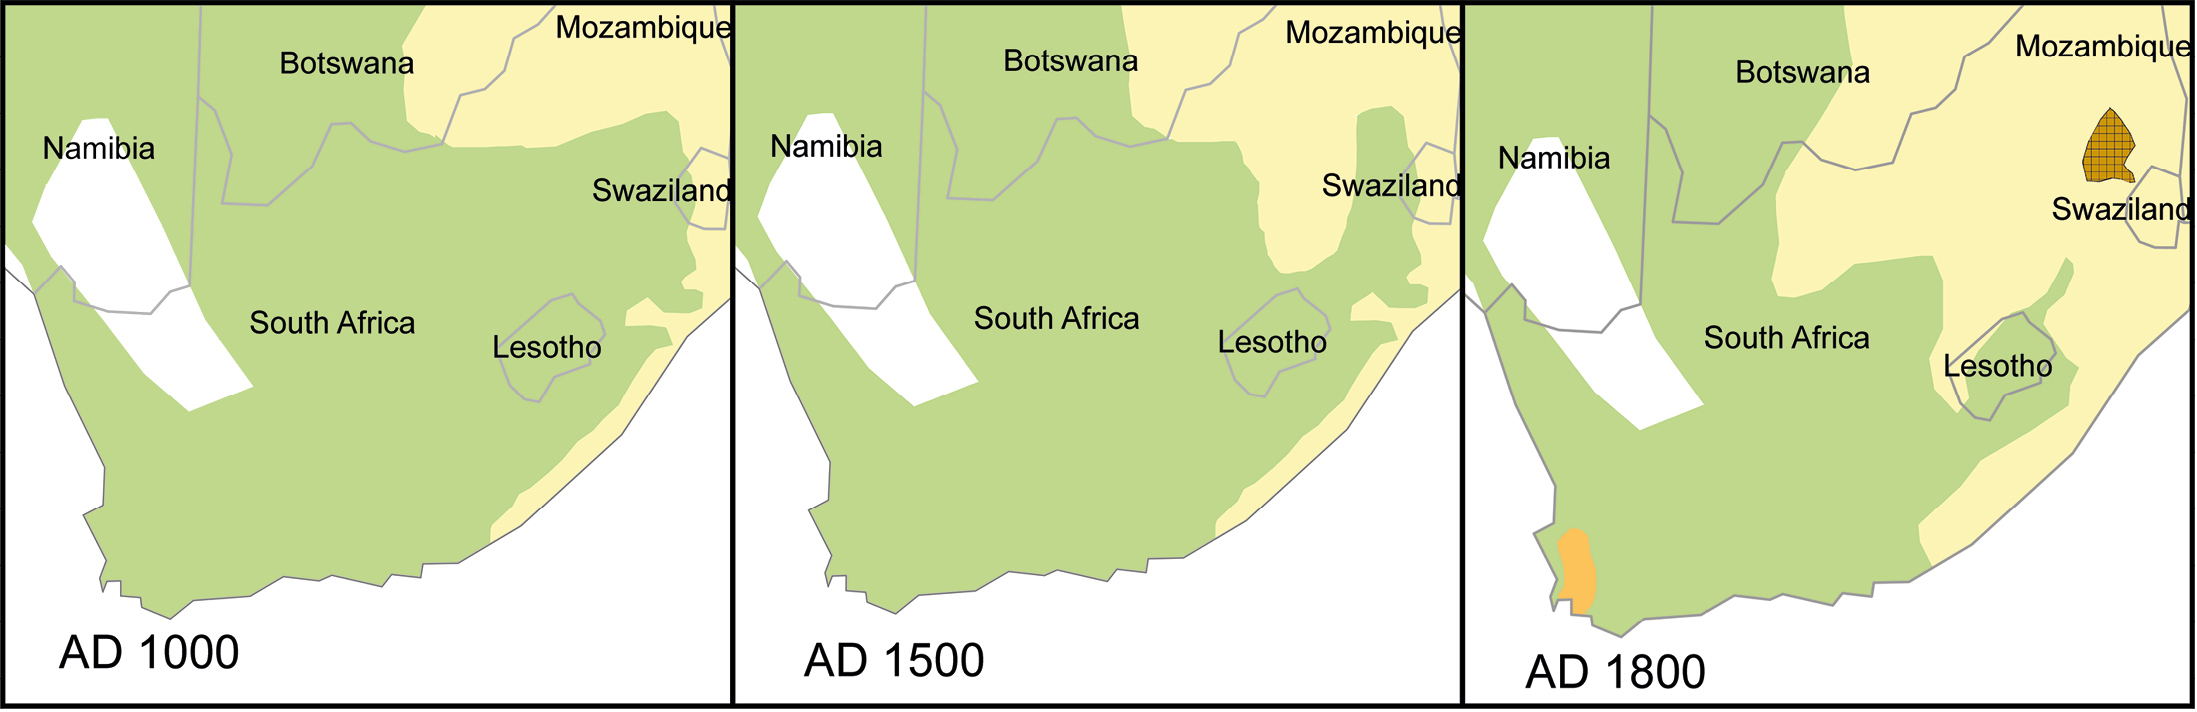
The historical development of farming in Southern Africa exhibits another trajectory that is difficult to model if archaeological and historical data are not taken into account. Archaeologists and historians have known for a long time that the winter rainfall area of Western Cape cannot sustain the African crops sorghum and millet. The agricultural development of African populations hence came to a definite limit in its expansion towards the southwest. It was only with the introduction of European crops that a Mediterranean type of farming system was established. Nonetheless, European farming had only reached a small area of the Western Cape around 1800 CE (see Maggs 1984 for the archaeological evidence, and Christopher 1982 for the historical evidence of European farming). Recent work based on a large archaeological database for Southern Africa seems to confirm Maggs’ maps of precolonial farming communities and provides a strong potential for a more precise mapping of agriculture in Southern Africa (Russell et al. 2014).
 |
|
Figure 2: Agricultural expansion in Southern Africa CE 1000 to 1800. Based on Maggs (1984) and Christopher (1982). For explanations, see caption of Fig. 1. |
The Mapping Global Agricultural History project and PAGES’ LandCover6k have the goal to provide evidence of land-use change at the global scale based on empirical data. Thanks to those activities, we expect this type of information will become more common. However, it is still a challenge to transparently integrate this empirical knowledge in the model-based back-casting that has so far dominated historical land-cover and land-use studies.
acknowledgements
The work on the definition of global categories and the continental maps within the Mapping Global Agricultural History project was performed with Bill Doolittle (University of Texas-Austin), Ulf Jonsson (Stockholm University), Janken Myrdal (Swedish University of Agricultural Science), Mats Widgren (Stockholm University) and Bill Woods (1947-2015, University of Kansas). Clark Erickson (University of Pennsylvania) has now joined that team to replace Bill Woods. In the context of PAGES LandCover6k, regional subgroups carry out the work in Africa. The group for Southern Africa includes Matthew Hannaford (Utrecht University), Munyaradzi Manyanga (University of Zimbabwe), Thembi Russel (University of the Witwatersrand) and the author (Stockholm University). A first version of the results for Southern Africa will be presented at the 15th Congress of PanAfrican Archaeological Association for Prehistory and Related Studies (PanAf) in Rabat, Morocco, 10-14 September 2018.
affiliation
Department of Human Geography, Stockholm University, Sweden
contact
Mats Widgren: mats.widgrenhumangeo.su.se
references
Butzer KW (1992) Ann Assoc Am Geogr 82: 345-368
Christopher AJ (1982) S Afr Geogr J 64: 97-113
Doolittle WE (2000) Cultivated landscapes of native North America. Oxford University Press, 600 pp
Kaplan JO et al. (2009) Quat Sci Rev 28: 3016-3034
Klein Goldewijk K et al. (2017) Earth Syst Sci Data 9: 927-953
Mann CC (2005) 1491: new revelations of the Americas before Columbus. 1st ed. Knopf, 465 pp
Maggs T (1984) In: Klein RG (Ed) Southern African prehistory and paleoenvironments. Balkema, 329-360
Russell T et al. (2014) PLoS ONE 9: e87854
Whittlesey D (1936) Ann Assoc Am Geogr 26: 199-240
Widgren M (2017) A map of agricultural systems in Africa by 1800. Figshare
Oliver Boles1,2, C. Courtney-Mustaphi1,3, S. Richer1,4 and R. Marchant1
Past land-cover change in Eastern Africa must be understood with reference to changing economies within complex webs of interacting human populations. Databases of archaeological sites and paleoenvironmental geoarchives help explore interactions of anthropogenic and environmental drivers of landscape evolution.
 |
|
Figure 1: Land uses: (A) pastoralism of grazers; (B) a modern boma with acacia branch outer fence occupied with modern buildings and areas for specific activities; (C) urban land-cover mosaics of Nairobi, Kenya; (D) industrial agriculture of sisal (Agave sisalana Perrine). Images credit: Rob Marchant. |
Eastern Africa is characterized by strong gradients of environmental variability and cultural diversity. Environments range from hot and moist coastal regions to isolated frigid alpine areas with glaciers, and from dry deserts to biodiverse moist montane forests (Fig. 1a-d), a diversity that has persisted throughout the Holocene even while particular landscapes have seen considerable ecological variability. Outside densely populated and fast-growing urban areas, rural livelihood strategies today range from fishing to specialist mobile pastoralism and sedentary agriculture, some of which is highly intensive. The last 6000 years have seen most Eastern African communities make the transition to food production, which has been accompanied by industrial developments like iron technology and the emergence of supra-regional trading networks, fundamentally changing how societies interacted with their environments. Intensification and diversification of resource use and demographic expansion into previously unexploited areas wrought considerable changes to land cover, as landscapes were manipulated and ecosystems responded. However, our knowledge of these processes exists largely in terms of discrete points – as study sites rather than landscapes. Moreover, the distribution of these points is both temporally and spatially inconsistent, and only in rare instances can we draw direct empirical links between the archaeological and paleoenvironmental records. As a consequence, enquiry into historical land-cover and land-use changes in Eastern Africa requires a multidisciplinary approach that combines Quaternary sciences and archaeology with anthropology, history, ethnography and linguistics.
Synthesizing a diverse range of expertise and data necessitates frequent interactions. Over the past two years, there have been LandCover6k-specific workshops (see Editorial, this issue; Marchant and Rucina 2016) and piggybacked meetings at academic conferences with overlapping themes and researchers. Several workshops and meetings had specific relevance to Tropical Africa and have been crucial platforms for the development of ideas and outputs. A PAGES-supported event in October 2015 at the British Institute in Eastern Africa (BIEA), Nairobi, brought together researchers from Congo, Uganda, Tanzania, Kenya, and Europe, and initiated the organization and collation of datasets that ultimately led to the submission of a 40+ multi-author paper published in Earth-Science Reviews (Marchant et al. 2018).
 |
|
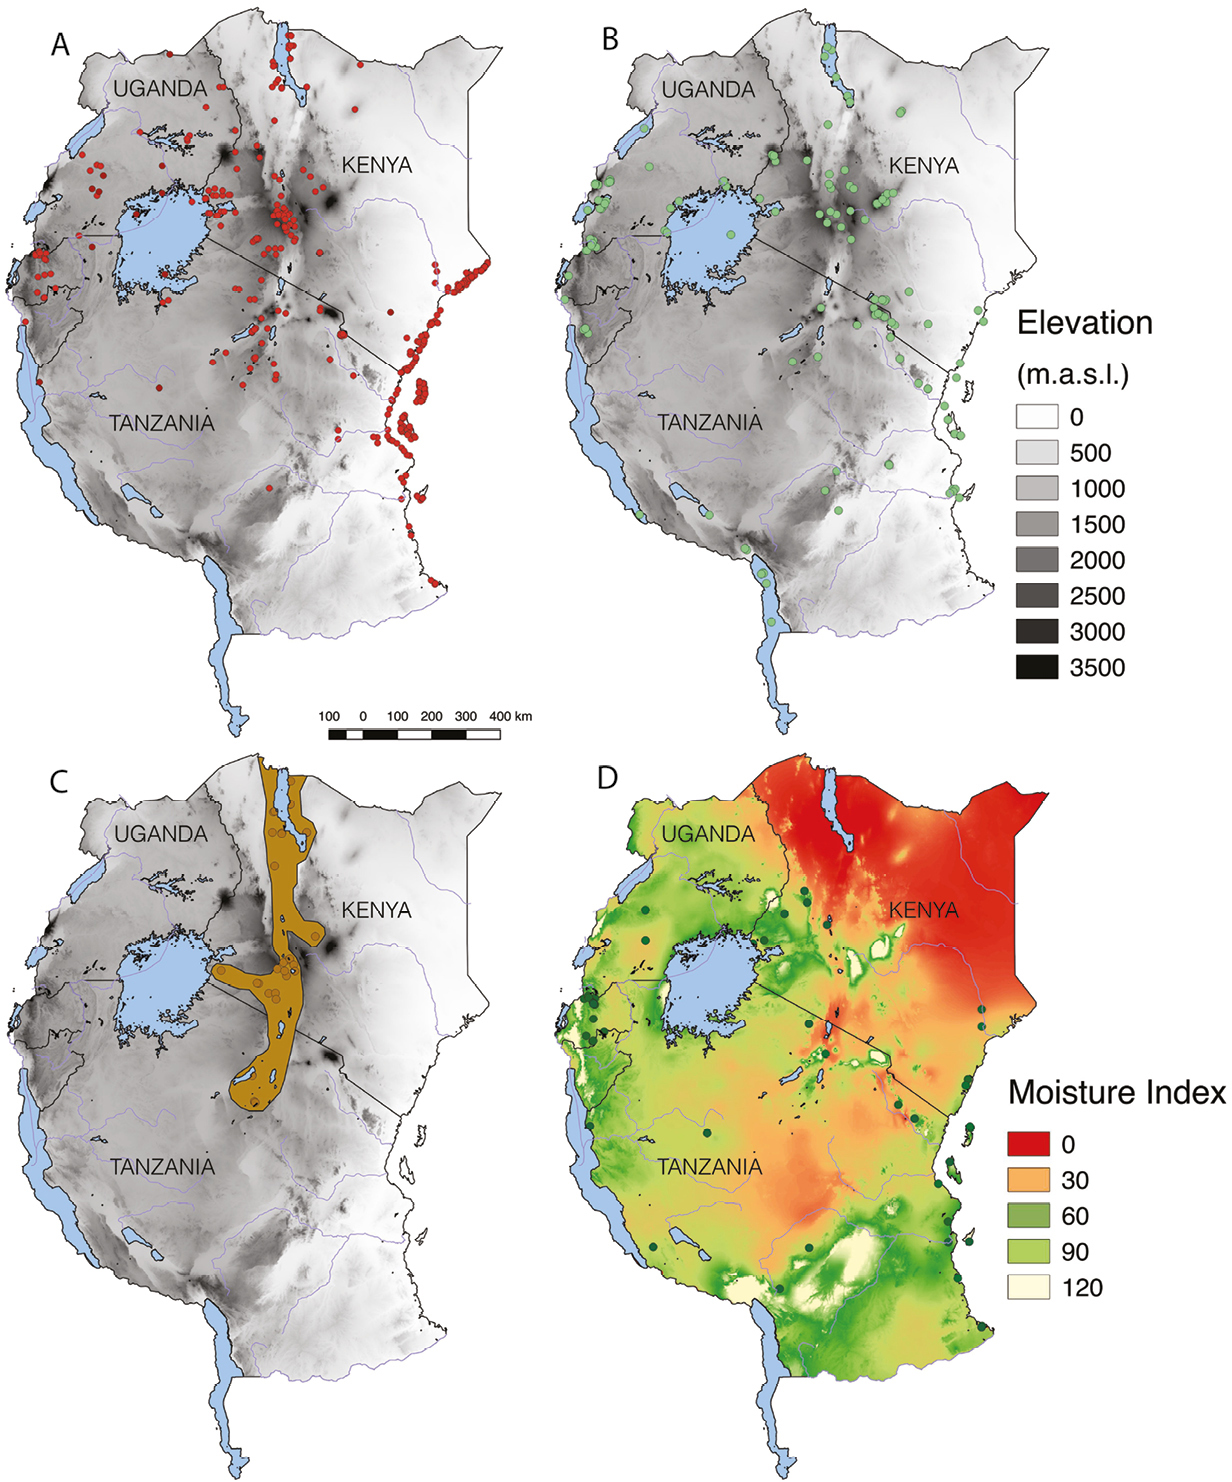
Figure 2: (A) map of Eastern Africa showing the locations of archaeological sites in the database, base-map ASTER DEM (JPL-NASA, 2018); (B) locations of paleoenvironmental geoarchives; (C) possible distribution of pastoralism at 3000 BP, based on site distribution and first stage of consensus building; (D) agricultural sites in database, basemap showing moisture index (precipitation relative to potential evapotranspiration) AFRICOVER (FAO 2018). |
More recently, the African Archaeology Research Day (AARD), hosted at University of York, UK, on 25 November 2017, was used to showcase archaeological and paleoenvironmental datasets and new mapping products relating to historical land-cover and land-use changes since 6 ka BP (Fig. 2a-d). This presentation marked the beginning of a mapping approach that uses expert consultation and consensus building, based on the underlying synthesized data. These new phases build upon the efforts of collating datasets from the region to examine key changes in land use and land cover over the past 6000 years.
The transition to food production
Contrary to many other areas of the globe, livestock domestication predates crop cultivation in Africa (Marshall and Hildebrand 2002). From a cradle in the northeastern Sahara, stock-keeping spread south and westwards, reaching northern Kenya some 4500 years ago and likely facilitated by an increasingly drier climate (Gifford-Gonzalez 1998). Advancement into eastern Africa took place within a complex web of interactions crossing ethno-linguistic and economic frontiers; rather than a linear spread, stock-keeping was adopted through a series of expansions and contractions – “fits and starts” (Wright 2013) – as communities experienced and moved through changing social and physical environments. Cultivation, by contrast, first appeared in the region during the late third millennium BP in the highlands of Rwanda and Burundi (Van Grunderbeek 1992). The emergence of farming in the Great Lakes region is generally packaged with iron technology and the spread of Bantu languages; though the exclusivity of this suite can be questioned (e.g. Crowther et al., in press), the timing of these developments coincides with the appearance of language and phrases relating to “fields” and “land clearance” (Schoenbrun 1993).
The ephemerality of pastoralist sites has frequently hindered archaeological investigation (Boles and Lane 2016) and our understanding is largely based on a small number of key locations and observations of faunal remains at non-herder sites, likely obtained through exchange networks. Mapping the distribution of herding therefore relies on inferences drawn from linguistic reconstruction and traditional histories with consideration of environmental conditions. Pastoralism spread southward through the Rift Valley corridor before expanding zonally, which provides a broad framework that can be extended and refined with details such as the drying climate of the late-second millennium BP that facilitated movement into the grasslands of western Uganda (Robertshaw and Taylor 2000). Currently, archaeological sites in southern Tanzania are rare, yet evidence that pastoralism had reached Southern Africa by the early second millennium BP (Marshall and Hildebrand 2002) requires us to consider that area in our distribution models.
Cultivation is perhaps slightly easier to trace, even if direct tangible evidence is often lacking. We can be confident that crop cultivation first appeared in the region when Bantu farming communities moved from the Congo Basin into the Great Lakes Highlands. These communities are tracked by a close association with pottery styles that eventually reached the eastern shore of Lake Victoria and beyond (Lane 2004). In the last 500 years or so, “islands of intensive agriculture” emerged (Widgren and Sutton 2004); locations such as Engaruka in northern Tanzania evidence technological innovations like terracing and irrigation systems (Stump 2009). As well as indigenous African domesticates like finger millet (Eleusine coracana) and sorghum (Sorghum bicolor), new crops like rice (Oryza sativa) and later, corn (Zea mays) arrived through trading portals on the Indian Ocean coast and changed the agricultural landscape, enabling farmers to exploit new environmental spaces.
Disentangling land use and land cover
Archaeological research has been spread unevenly across Eastern Africa, with large swathes subject to little or no investigation while other areas - such as the Central Rift Valley and the Swahili Coast - have been intensively studied. Predictably, this tends to reflect modern population distributions and accessibility. There is, however, reason to suspect that unevenness reflects past population distributions; plotting site locations above a basemap showing modern moisture index (ratio of annual rainfall and potential evapotranspiration; Fig. 2d) suggests past preferences towards the same amenable climatic zones where populations and regional economies are focused today. This is most apparent with respect to sites with evidence of crop cultivation, consistently located in certain zones with more reliable water distribution, such as lake or river basins, or moist highlands. This provides a useful parameter for interpreting between data-points. In conjunction with broader land-cover patterns evidenced in paleoenvironmental records, we can begin to disentangle the probable from the possible spreads of various land-use activities.
Besides the current database of 360+ archaeological sites (see supplementary data in Marchant et al. 2018), we have assembled records from 150+ paleoenvironmental geoarchives that represent the collated evidence of land-cover change over the late Holocene available from lake and marine sediments, swamp and peat deposits, glacial ice, and other sources such as tree-ring and coral growth records. As with the archaeology, the coverage of these records is biased towards certain areas and eco-climatic contexts. Furthermore, their scale and resolution varies widely: a wetland study of δ13C isotopes in the sediments provides information on very local variations in vegetation cover in and around the wetlands, whereas a pollen study from lake sediments can spatially aggregate a vegetation-change signal and include pollen taxa from adjacent mountain ecosystems, riverine forests, savannah, and the wetland itself. The next phase of work for our East Africa working group will explore the spatial coverage of our existing data, and develop land-cover maps for the LandCover6k time intervals (see Editorial, this issue) from which to generate environmental niche reconstructions to delimit land-use classes. We have already begun to record which geoarchives have previously been interpreted as evidencing anthropic influence; we will build on this through Bayesian modeling of radiocarbon dates from the paleoenvironmental and archaeological databases to access patterns of synchroneity in environmental and cultural change. In addition to informing our land-use and land-cover distribution maps, such models will help address questions such as how sedimentation rates might have responded to land-use change. These lines of enquiry will be essential in our assessment of how exactly the landscape of Eastern Africa has been affected by dramatic economic change in the last 6000 years.
affiliations
1York Institute for Tropical Ecosystems, University of York, UK
2Department of Anthropology, University of Pennsylvania, USA
3Department of Archaeology and Ancient History, Uppsala University, Sweden
4Department of Archaeology, University of York, UK
contact
Oliver Boles: oliver.bolesyork.ac.uk
references
Boles O, Lane PJ (2016) Azania Archaeol Res Afr 51: 507-530
Crowther A et al. (in press) Quat Int
Gifford-Gonzalez D (1998) J Anthrop Archaeol 17: 166-200
Lane P (2004) Azania J Brit Inst East Afr 39: 243-264
Marchant R, Rucina S (2016) PAGES Mag 24: 39
Marchant R et al. (2018) Earth Sci Rev 178: 322-378
Marshall F, Hildebrand E (2002) J World Prehist 16: 99-143
Robertshaw P, Taylor D (2000) J Afr Hist 41: 1-28
Schoenbrun DL (1993) J Afr Hist 34: 1-31
Stump D (2009) Azania Archaeol Res Afr 41: 69-94
Umberto Lombardo1, C. McMichael2, E. Kazuo Tamanaha3 and workshops participants
To improve climate models, climatologists need data on the world’s past land use. We present the initial results of a multidisciplinary effort, which aims to (i) expand the database of Amazonian archaeological sites and (ii) reconstruct past land use in Amazonia.
Reconstructing pre-Columbian land-use patterns in Amazonia is crucial in assessing the possible influence that pre-contact (i.e. pre-Colonial) deforestation and post-contact reforestation had on global climate. Pre-contact populations of Amazonia are estimated to have been 5-8.4 million, decreasing by 95% due to disease, slavery and war following European conquest (Denevan 2014). This severe population collapse resulted in the abandonment of cultivated areas and re-colonization of those areas by natural vegetation. As Amazonia is one of the largest terrestrial players in the global carbon cycle, the post-contact reforestation is suggested to have sequestered sufficient atmospheric CO2 to contribute to the onset of the Little Ice Age (Dull et al. 2010). Many ecologists believe, however, that the total deforested area of Amazonia was not large enough to drive such drastic changes in CO2 (McMichael et al. 2012).
Assessing the extent to which pre-Columbians modified Amazonian ecosystems is one of the most controversial topics in South American paleoecology and archaeology. Some argue that large-scale, pre-Columbian impacts mostly occurred in areas such as riverine forests and that impacts in interfluvial forests may have been minimal and localized (McMichael et al. 2012). Others suggest that large-scale impacts were widespread (Erickson 2008) and left long-lasting legacies in forest biodiversity (Levis et al. 2017).
Mapping pre-Columbian land-use in Amazonia
In light of this lack of consensus regarding the extent of past anthropogenic disturbance of Amazonia’s forests and its effect on global climate, it is important to bring together archaeologists, geographers and paleoecologists to develop a common methodology to assess and map how land was used in pre-Columbian Amazonia. With this in mind, we created a PAGES LandCover6k sub-group called “Mapping pre-Columbian land-use in Amazonia”. After securing funding from INQUA’s Humans and the Biosphere Commission (HabCom) and the Spanish SIMULPAST project, 16 researchers from seven countries met in Barcelona, Spain, in June 2016 to develop a common research methodology. A second workshop in Trinidad, Bolivia, in October 2017, included 15 researchers from six countries. These meetings focused on: (i) how to extrapolate past land-cover changes from a small number of documented archaeological sites to the entire Amazonia; (ii) what kind of proxies should be used to infer past changes in land use; and (iii) what should be considered as a baseline towards which changes in land cover can be quantified.
Method and datasets
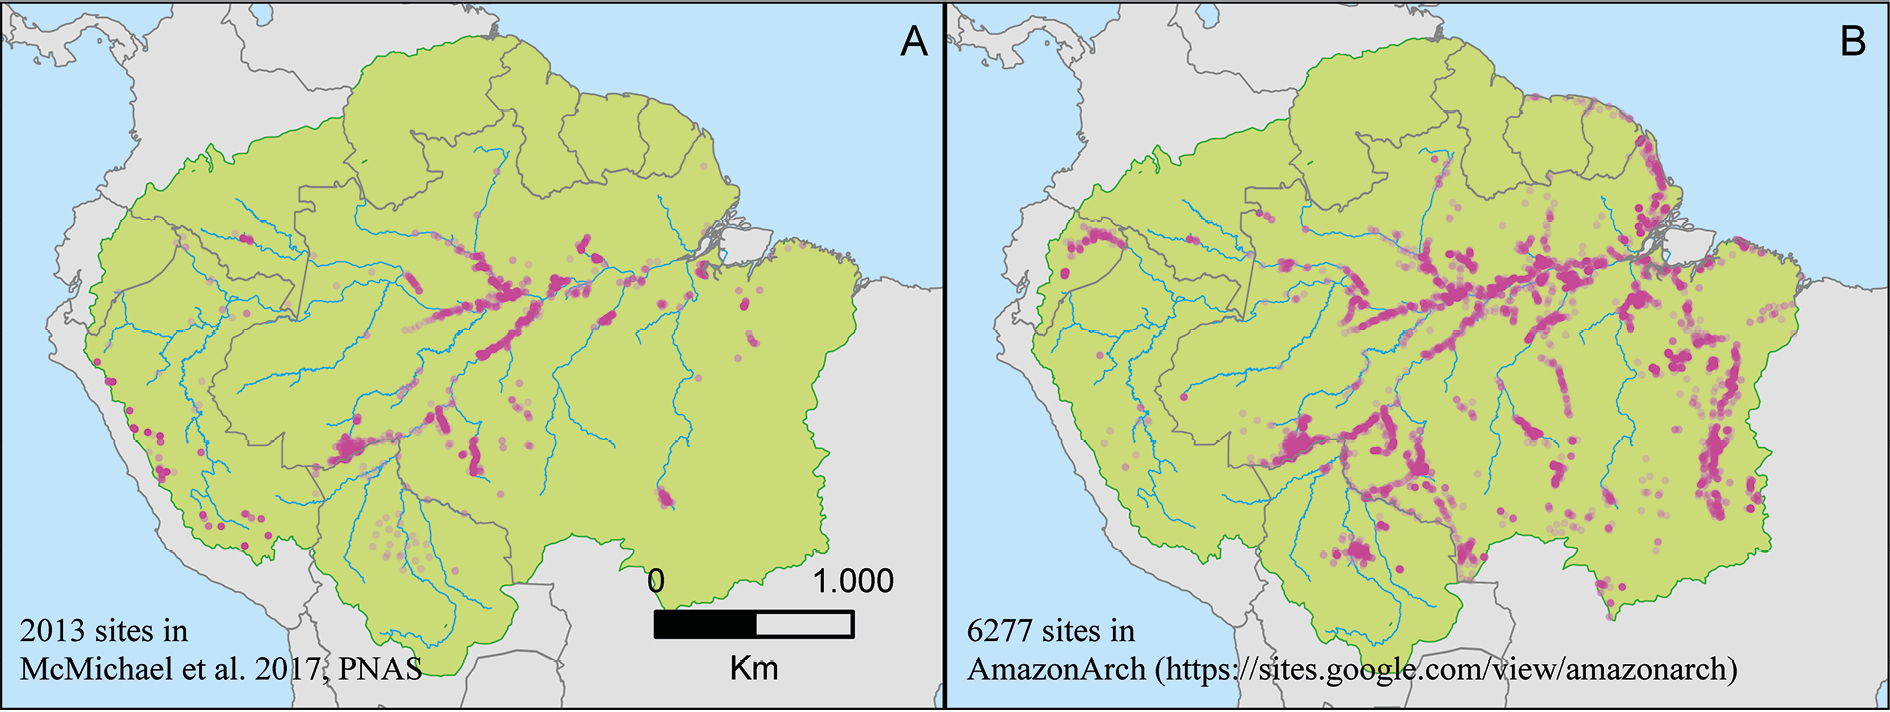
To date, efforts to map pre-Columbian human occupation in Amazonia have been largely based on geospatial models. McMichael et al. (2014, 2017) used locations of known archaeological sites to infer pre-Columbian settlement patterns in Amazonia, and Levis et al. (2017) used 1170 forest plots of the Amazon Tree Diversity Network (ATDN) to infer pre-Columbian legacies in modern vegetation assemblages. The main problem with these approaches is that the number of sites available is very small and often spatially biased. Lack of mapped archaeological sites in a given area within Amazonia could be due to the fact that large areas have never been surveyed, rather than the nonexistence of sites.
 |
|
Figure 1: Comparison between the number of archaeological sites (pink dots) used in (A) McMichael et al. (2017), and (B) the number of archaeological sites contained in AmazonArch. The green area represents Amazonia in sensu latissimo (as in Eva et al. 2005), consisting of a core sub region, Amazonia in sensu stricto, plus four peripheral sub regions: Andes, Planalto, Guiana and Gurupí. |
The “Mapping pre-Columbian land use in Amazonia” group concluded that two parallel lines of research are required. The first focuses on improving the quality of existing models by increasing the size of the database of pre-Columbian archaeological sites in Amazonia (Fig. 1). Archaeological sites are often documented in Spanish or Portuguese books, journals or reports, and sometimes are stored in researchers´ personal databases; for these reasons they are often overlooked by English-speaking researchers. Compiling data about these sites can significantly improve the database in a relatively short time and with limited effort. The second goal includes concentrating our efforts on devising a methodology to include and document, with empirical data, more nuanced forms of pre-Columbian land-use than previously modeled.
We started to compile and digitize all the available data about pre-Columbian archaeological sites in Amazonia, including: (i) geographic coordinates and radiocarbon dates associated with each site; (ii) site characteristics – size, type (i.e. lithic, ceramic, rock art, presence of anthropogenic soils, etc.); and (iii) the availability of ecological, ethnobotanical and archaeobotanical studies in the surrounding areas. The result, called AmazonArch (Amazonian Archaeological Sites Network), is a georeferenced database that allows researchers to share data and information about archaeological sites distributed within Amazonia. AmazonArch’s main goal is to gather archaeological data that can be used by network members and other researchers under a data-sharing and data-use policy (https://sites.google.com/view/amazonarch).
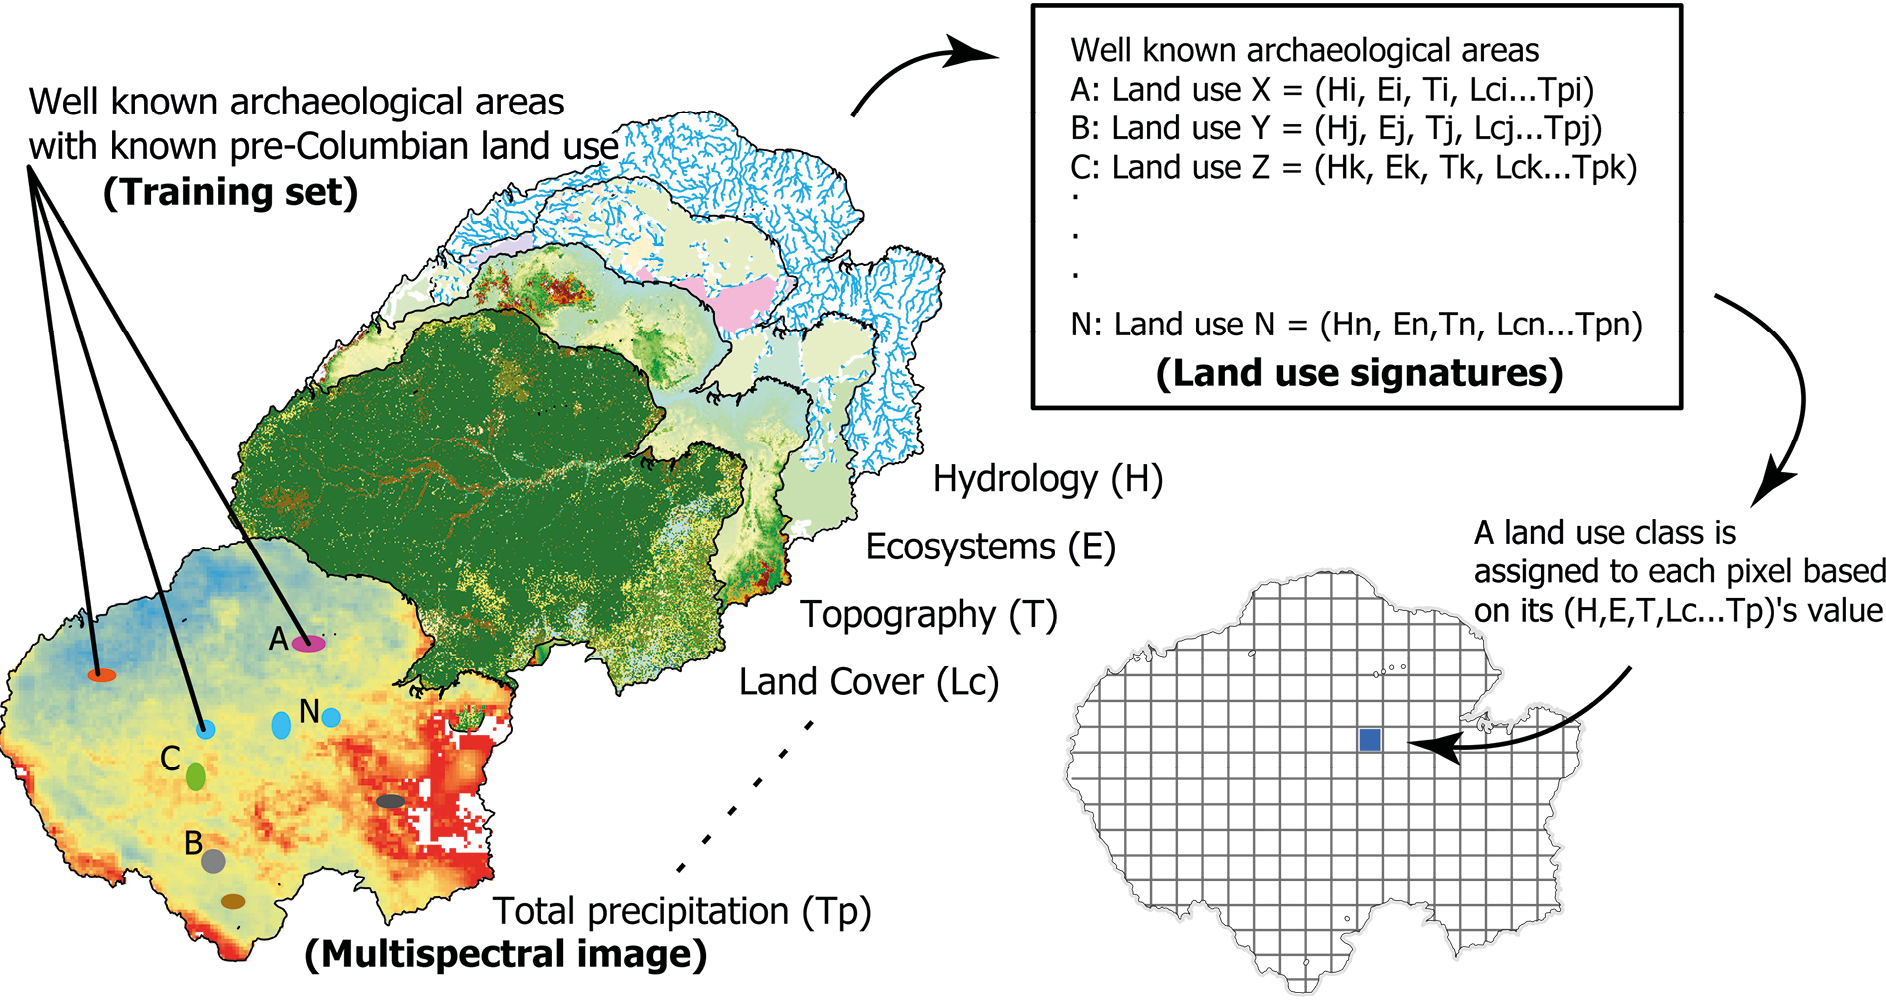 |
|
Figure 2: Steps in the supervised classification of pre-Columbian land use in Amazonia. |
The group is also working to “fill the gaps” by assessing the environmental impact that pre-Columbian populations had at a regional scale in well-known archaeological areas (i.e. the terra preta or Amazonian dark earth sites in Brazil or the Monumental Mounds region in Bolivia) and extrapolate the data from these case studies to the rest of Amazonia using a supervised classification algorithm (Fig. 2). The used algorithm was originally developed to classify land cover in remote sensing imagery (Richards and Jia 1999). Our plan is to use it to classify Amazonia on the basis of several layers of information, where each layer will be treated by the algorithm as if it was a spectral band in a multispectral image. We will use the following “spectral bands”: digital elevation model, climate, soil map, distance to water bodies, water chemistry, and vegetation. The group identified 19 well-known archaeological areas that will serve as “training fields” and seven land-use classes that will be used to classify the whole of Amazonia. The algorithm will take into account the environmental parameters (the “spectral bands”) associated with each well-known archaeological site (the “training set”) and will assign the land-use classes of the well-known archaeological area to each pixel that has a similar “spectrum” (above a given threshold). This is still a work in progress as we address several problems encountered. The first one is the difficulty of estimating land use in the well-known archaeological areas. Only recently have archaeologists started to examine the archaeological evidence outside the habitation sites, where most of the artifacts are found, so we know far more about terra preta (the area where people lived) than we know about terra mulata (the area that was under cultivation) and less about adjacent agroforest management.
The ultimate goal is to develop a basin-wide model (Fig. 1) with the supervised classification approach that contains more nuanced land-use data. We believe it is of great importance to start tackling the problem and to establish a replicable and robust methodology that allows the continuous improvement and updating of the pre-Columbian land-use maps as new data become available. We expect the results of these two approaches will, with time, converge towards more accurate and comprehensive reconstructions of land use in pre-Columbian Amazonia.
affiliations
1CaSEs – Complexity and Socio-Ecological Dynamics Research Group, Pompeu Fabra University, Barcelona, Spain
2Department of Ecosystem and Landscape Dynamics, University of Amsterdam, The Netherlands
3Research Group in Archeology, Mamirauá Institute for Sustainable Development, Tefé, Brazil
contact
Umberto Lombardo: umberto.lombardoupf.edu
references
Denevan WM (2014) J Lat Am Geogr 13: 207-221
Dull RA et al. (2010) Ann Assoc Am Geogr 100: 755-771
Levis C et al. (2017) Science 355: 925-931
McMichael CH et al. (2012) Science 336: 1429-1431
McMichael CH et al. (2014) Proc R Soc B Biol Sci 281: 20132475
McMichael CNH et al. (2017) PNAS 114: 522-527
Richards JA, Jia X (1999) Remote sensing digital image analysis - Third edition, Springer, 494 pp
Laurent Marquer1,2,3,4,5, A. Dallmeyer6, A. Poska2,7, J. Pongratz6,8, B. Smith2 and M.-J. Gaillard1
Differences between pollen-based reconstructions and dynamic vegetation simulations of past vegetation change in Europe over the last seven millennia are interpreted as being due primarily to land-use change. Incorporating land use in climate and dynamic vegetation models requires new approaches.
Since the spread of the Neolithic agriculture in northern and central Europe 7-6 ka BP, land use became a potential source of atmospheric greenhouse gases and impact on heat fluxes through biogeo-chemical and -physical processes between the land surface and the atmosphere. These processes will affect climate (temperatures and precipitations) and their impact can be quantified using dynamic global vegetation models (DGVMs). Such models are based on ecological concepts and are forced by climate data or run interactively with Earth System Models (ESMs). DGVMs simulate potential natural (climate-induced) vegetation cover in equilibrium with climate. In most models, vegetation is expressed as the fractional coverage of “plant functional types” (PFTs) per grid cell with a spatial resolution suitable for climate modeling. PFTs are groups of plants with comparable physiological characteristics and ecological requirements and tolerances. So far, land-use change (deforestation and other anthropogenic land-cover modifications) can only be prescribed in DGVMs.
How can we evaluate vegetation models’ outputs?
Historical observations are insufficient to evaluate DGVMs. To capture the natural variability, reconstruction of land-cover change on millennial timescales is necessary. Fossil pollen grains preserved in lake sediments or peat are a key biological proxy of past vegetation cover. Pollen records consist of dated series of samples in which pollen grains have been identified, counted, and expressed in percentages, or pollen accumulation rates. But pollen records cannot be directly compared to vegetation cover simulated by ESMs or DGVMs, because they do not directly reflect plant abundances due to differences in pollen productivity, dispersal, and deposition between plant species. To overcome these problems, the method of “biomisation” was developed, that groups plant species and pollen types into biomes (e.g. tundra, savanna, boreal forest). These reconstructed biomes can then be compared to biome distributions inferred from ESMs by using the simulated climate as forcing for biome models (e.g. Prentice et al. 1992; Dallmeyer et al. 2017). A technique to convert the PFT distributions simulated by ESMs or DGVMs directly into biomes is currently being developed (Dallmeyer et al. 2018).
The recent pollen-based quantitative vegetation reconstructions for Europe (e.g. Marquer et al. 2017) using the REVEALS model (Sugita 2007) offer a potential way of evaluating DGVM outputs. The REVEALS model accounts for biases related to interspecific differences in pollen productivity, dispersal and deposition between plant species. Moreover, the spatial scale (100x100 km2) and format (PFT) of REVEALS reconstructions are adequate for comparison with DGVMs’ simulated vegetation. For more details on REVEALS applications, see Woodbridge et al., Li et al., and Dawson et al. in this issue.
A case study from Europe
 |
|
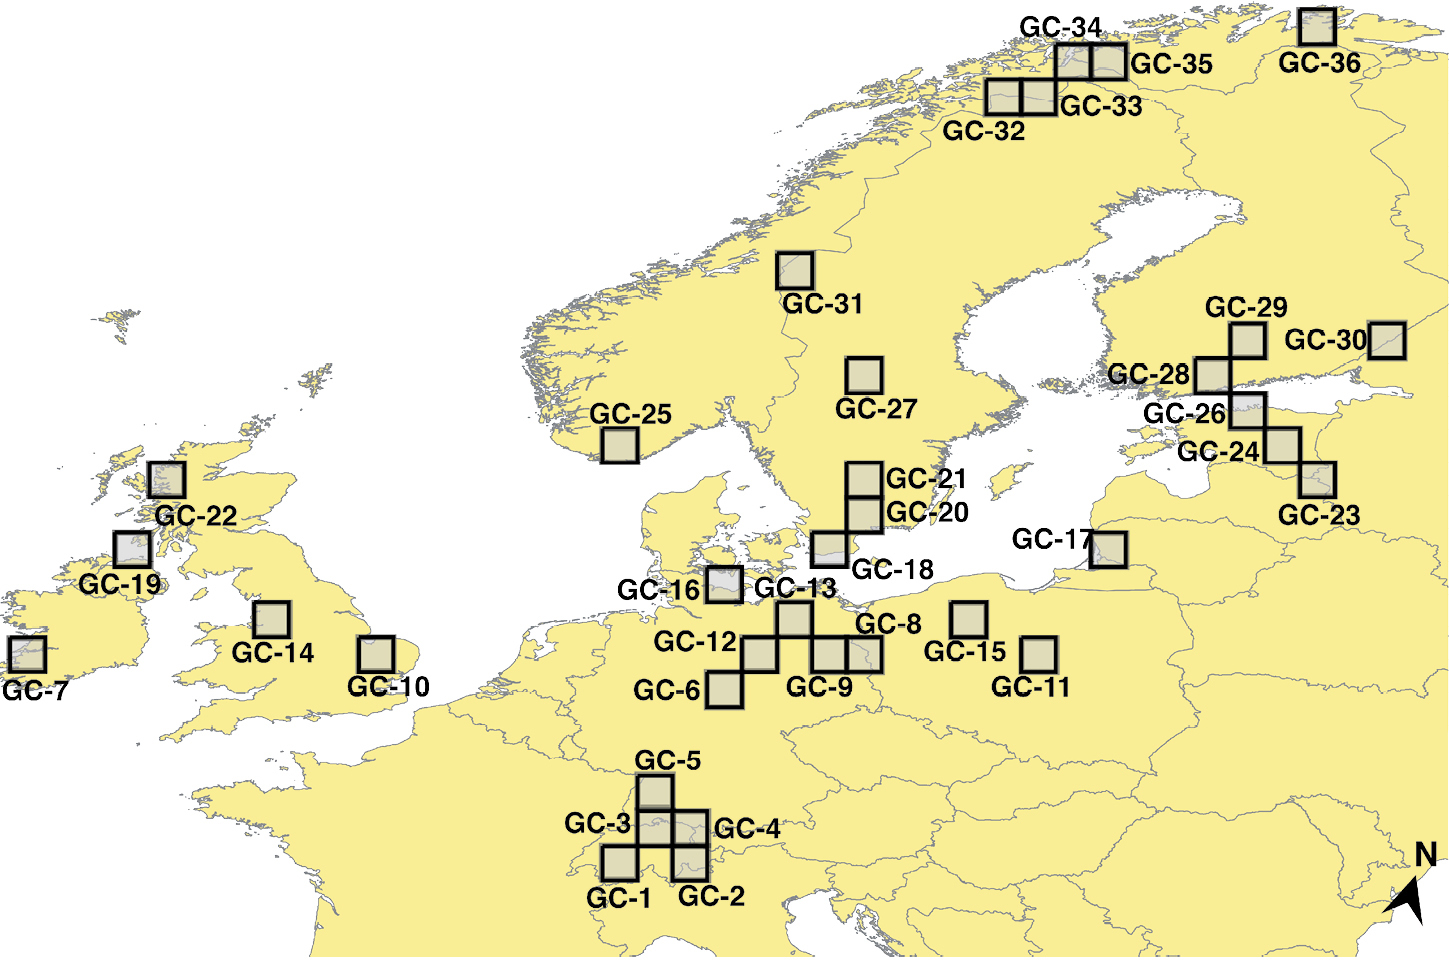
Figure 1: Location of the 36 1x1º grid cells used in Marquer et al. (2017) for Europe. Gridded pollen-based REVEALS estimates of plant abundance for the last 11.7 ka BP were calculated using all available pollen records in each grid cell. |
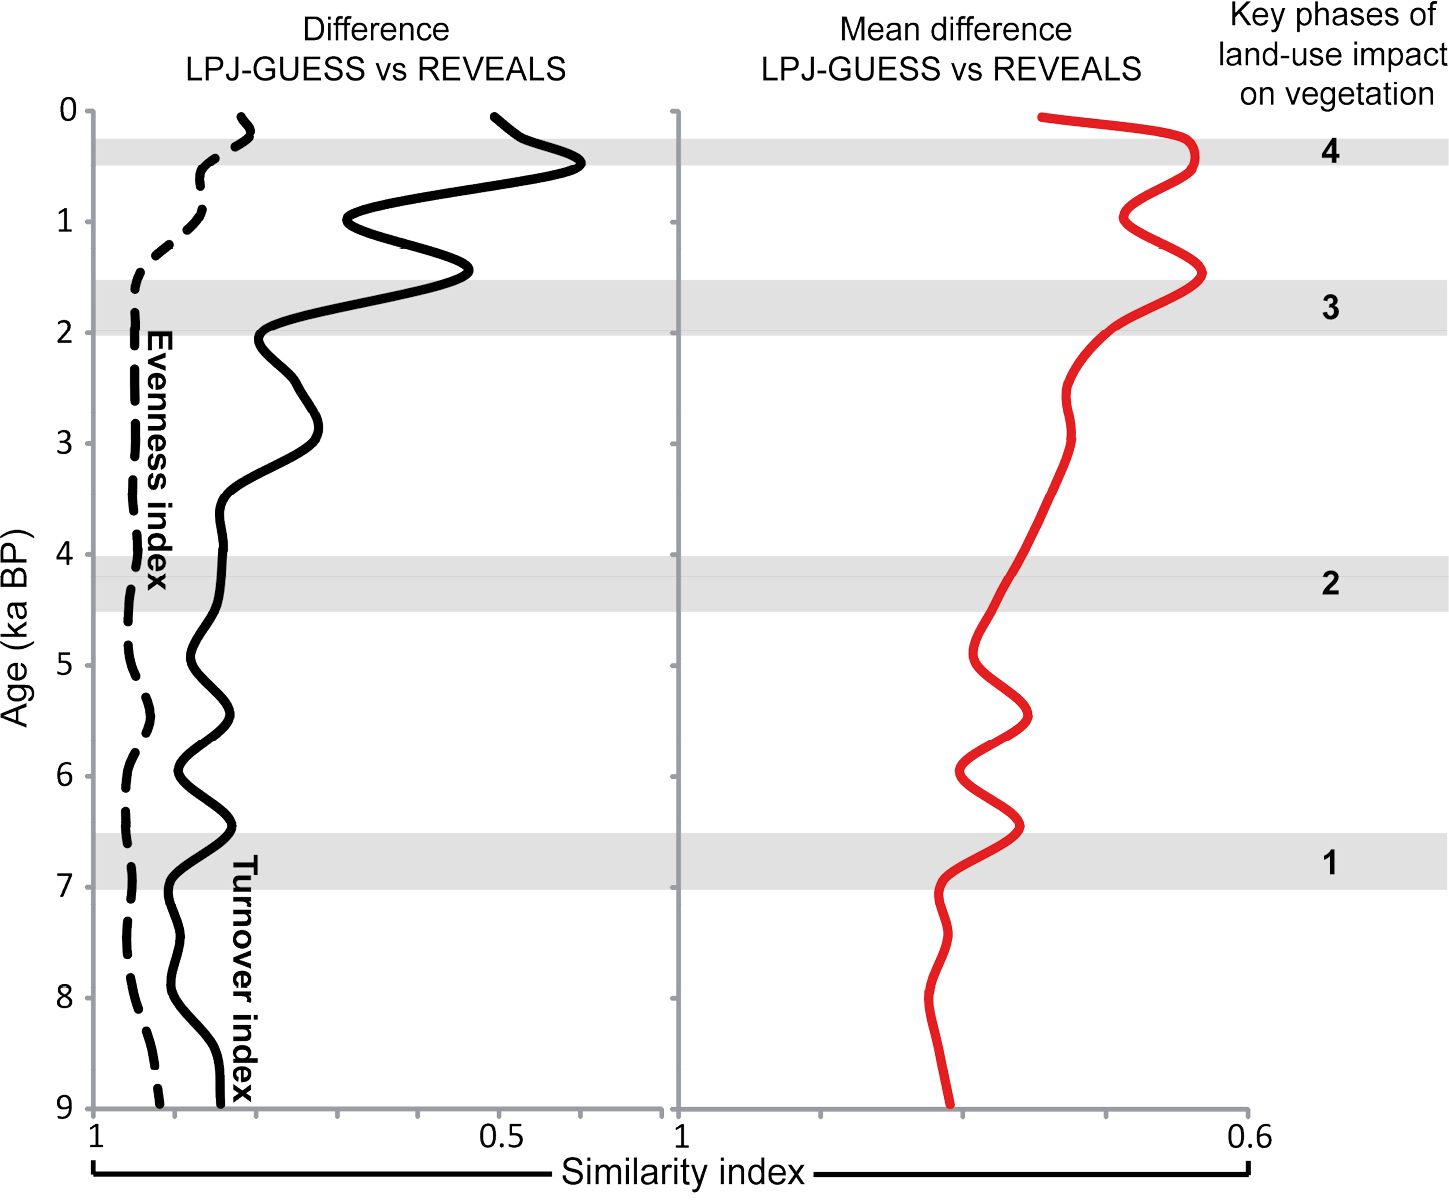
Marquer et al. (2017) used REVEALS land-cover reconstructions for the entire Holocene from 36 grid cells in Europe (Fig. 1) to evaluate the vegetation change simulated by LPJ-GUESS. LPJ-GUESS (Smith et al. 2001) is a dynamic, process-based vegetation model optimized for application at a regional spatial scale. It describes landscape and stand-scale heterogeneity and accounts for the biophysical properties that influence regional climate variability. LPJ-GUESS simulates climate-induced vegetation; it does not consider land use unless it is prescribed in model runs. In contrast, the influence of land use on vegetation cover is recorded in pollen records. The results of a comparison between the LPJ-GUESS outputs and the REVEALS estimates of plant cover suggest that they differ during the early part and last three millennia of the Holocene (Fig. 2). These differences are assumed to be due to ecological processes related to, among others, tree migration and soil development in Early Holocene and land-use in Late Holocene. Marquer et al. (2017) also used “indices” describing the degree of change in the vegetation, e.g. “turnover” and “evenness”. “Turnover” is a measure of the degree of change in vegetation composition over time. “Evenness” describes the relative abundance of all plant species/taxa within the studied vegetation, where little difference in abundance between species implies high evenness, while large differences in abundance between species implies low evenness. Other indices of vegetation change are “rate of change” and “difference between present and past vegetation” (Marquer et al. 2017 for more details). Differences between REVEALS- and LPJ-GUESS-based indices of vegetation change are not as large as differences between REVEALS-estimated and LPJ-GUESS-simulated plant abundances, particularly in Early Holocene (Fig. 2). It implies that, although LPJ-GUESS does not simulate effectively tree migration and soil development, REVEALS-based and LPJ-GUESS-simulated vegetation are comparable for most of the Holocene, except parts of Mid- and Late Holocene. These differences are assumed to be due to land-use change. Four major phases of land-use change were identified based on all indices of vegetation change (Fig. 2).
Challenges in implementing land use into dynamic vegetation models
 |
|
Figure 2: Differences between vegetation-change indices calculated based on LPJ-GUESS (dynamic vegetation model) simulations and pollen-based REVEALS estimates of past plant cover in Europe (Fig. 1). The differences are expressed by a similarity index ranging from 0 (no similarity) to 1 (total similarity). Left panel: similarity index for “evenness” and “turnover” indices. Right panel: mean of similarity indices for five vegetation-change indices. Marquer et al. (2017) assume that periods with low similarity indicate an impact of land use on vegetation. The four grey zones are major phases of land-use effects on land cover as identified by Marquer et al. (2017). |
While the differences in format and spatial scale between pollen percentage data and DGVM-simulated vegetation can partly be overcome with the REVEALS model, integrating land use into DGVMs is still a great challenge. A preliminary comparison of the transient vegetation simulations performed within the ESM MPI-ESM 1.2 with the REVEALS reconstructions of Marquer et al. (2017) suggests that the prescribed land-use forcing in the ESM is too strong in most European regions (Dallmeyer A, pers. comm.). DGVMs were originally designed to study the interactions between natural ecosystems and the atmosphere. However, the insight that land use is one of the many forcings of climate has led to several efforts to incorporate land use in DGVMs in past years. So far, land use is prescribed in DGVMs as sequences of land-use maps (e.g. Pongratz et al. 2010) or “transition matrices” of past changes in cropland, pasture, forestry or urban areas (e.g. Reick et al. 2013). Estimates of past land use at the global scale are currently provided by anthropogenic land-cover change (ALCC) scenarios such as KK10 (Kaplan et al. 2009) and HYDE 3.2 (Klein Goldewijk et al. 2017). These scenarios are based on different assumptions on the main drivers of land-use change, which results in large between-scenario discrepancies (e.g. Gaillard et al. 2010). Kaplan et al. (2017) recently showed that the past deforestation scenarios from KK10 are closer to REVEALS estimates of open-land cover than HYDE scenarios. Discrepancies between scenarios introduce uncertainty in DGVM simulations in addition to uncertainty caused by imperfections in (i) modeling certain processes, (ii) choice of model setup (e.g. bioclimatic tolerance of each PFT), and (iii) known biases in climate data used to force DGVMs. Implementing land-use change and land management in DGVMs is a priority in ESMs (Pongratz et al. 2018), but faces a number of major shortcomings for simulations over millennial timescales:
• Difficulties related to the allocation of agricultural areas in a model grid-cell, and the rules used to replace natural vegetation by expending cropland and pastures; the differences in effect of different allocation rules were shown to be very large (e.g. Reick et al. 2013).
• Quality and comprehensiveness of the land-use change data; past practices in land management are still largely missing in DGVMs, partly due to lack of data for the past. For instance, information on shifting cultivation does not exist except for the time from 800 CE until present (Hurtt GC, pers. comm.). Ignoring shifting cultivation leads to a large underestimation of land-cover change in Europe (Fuchs et al. 2015).
In this respect, the datasets of pollen-based REVEALS land-cover change and archaeology/history-based land-use change currently produced by the PAGES LandCover6k working group, as well as new approaches developed for the implementation of empirical data describing past land-use and land-cover change in DGVMs, have the potential to solve many of the challenges related to modeling past human-induced vegetation change (Gaillard et al. Editorial, this issue).
affiliations
1Department of Biology and Environmental Science, Linnaeus University, Kalmar, Sweden
2Department of Physical Geography and Ecosystem Science, Lund University, Sweden
3GEODE, UMR-CNRS 5602, Université Toulouse Jean Jaurès, France
4EcoLab, UMR-CNRS 5245, Université de Toulouse, France
5Research Group for Terrestrial Palaeoclimates, Max Planck Institute for Chemistry, Mainz, Germany
6Max Planck Institute for Meteorology, Hamburg, Germany
7Institute of Geology, Tallinn University of Technology, Estonia
8Department of Geography, Ludwig-Maximilians-Universität Munich, Germany
contact
Laurent Marquer: laurent.marquer.esgmail.com
references
Dallmeyer A et al. (2017) Clim Past 13: 107-134
Dallmeyer A et al. (2018) Clim Past Discuss: 41
Fuchs R et al. (2015) Global Change Biol 21: 299-313
Gaillard M-J et al. (2010) Clim Past 6: 483-499
Kaplan JO et al. (2009) Quat Sci Rev 28: 3016-3034
Kaplan JO et al. (2017) Land 6: 91
Klein Goldewijk K et al. (2017) Earth Syst Sci Data 9: 927-953
Marquer L et al. (2017) Quat Sci Rev 171: 20-37
Pongratz J et al. (2010) Geophys Res Lett 37: L08702
Pongratz J et al. (2018) Global Change Biol 24: 1470-1487
Prentice IC et al. (1992) J Biogeog 19: 117-134
Reick CH et al. (2013) J Adv Model Earth Syst 5: 459-482
Jessie Woodbridge1, R.M. Fyfe1, C.N. Roberts1, A.K. Trondman2, F. Mazier3 and B. Davis4
Europe was extensively wooded prior to the arrival of Neolithic agriculture. Forests have since been cleared and fragmented by humans. Here we compare different approaches to transforming fossil pollen data into quantitative past forest cover estimates on a continental scale.
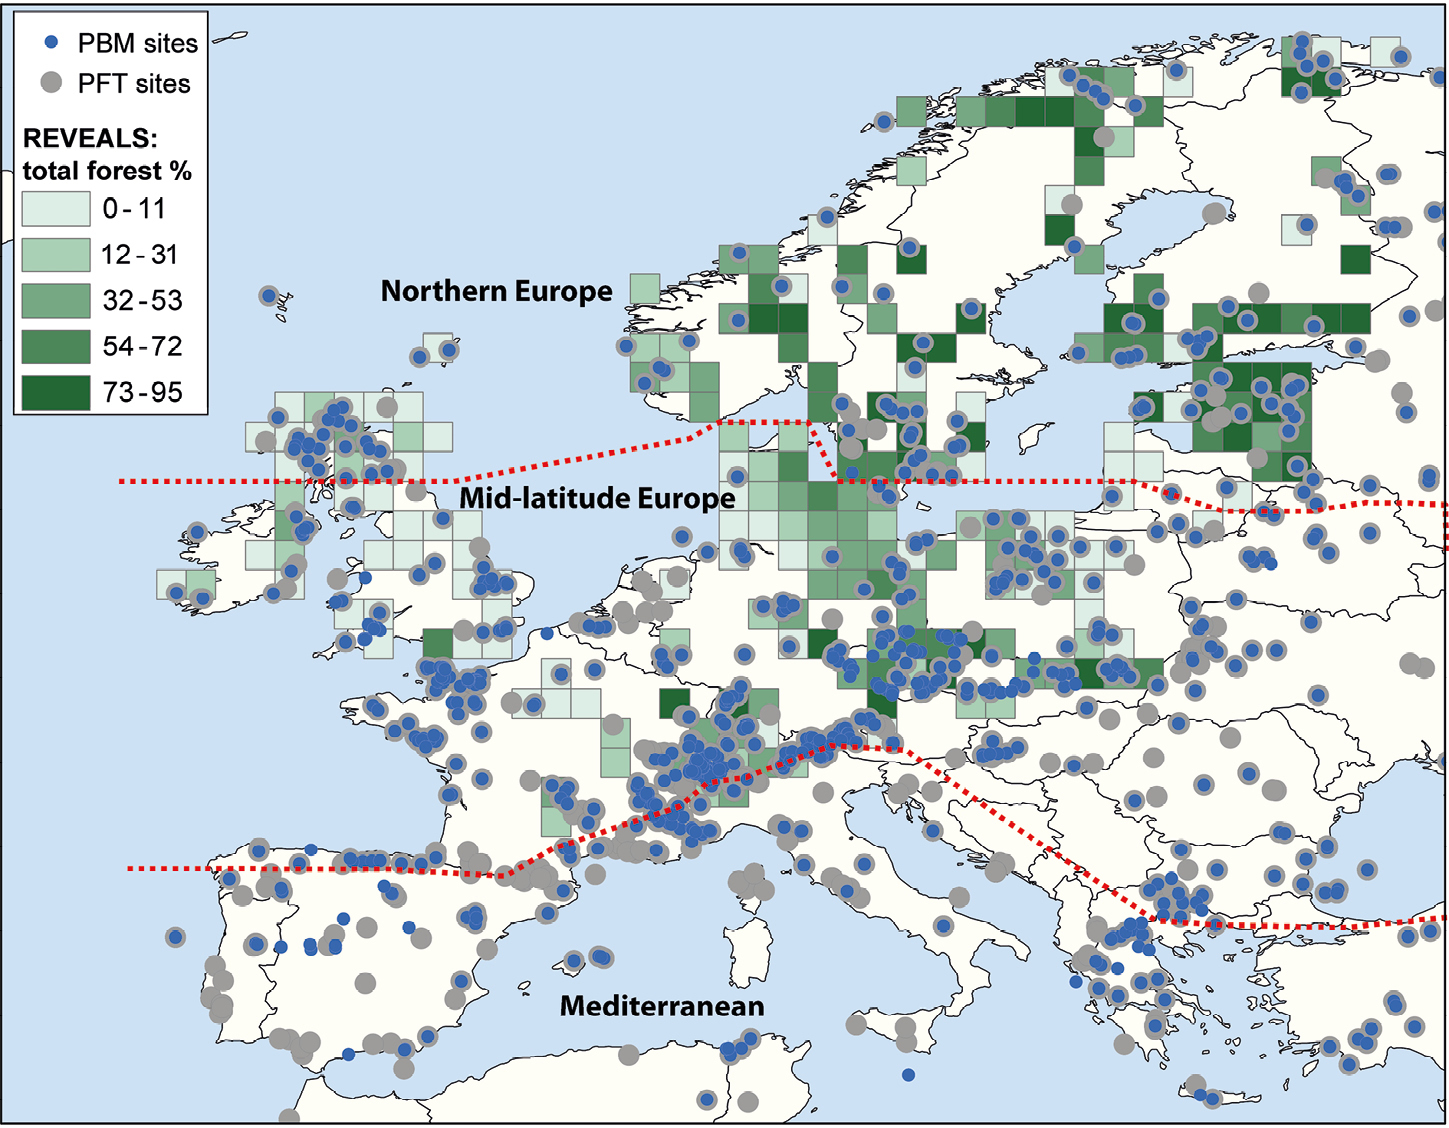 |
|
Figure 1: Pollen sites used in the PBM and PFT analyses, and REVEALS estimates for total forest cover percentage. Red dashed lines represent the separate regions analyzed: i.e. northern and mid-latitude Europe. |
Pollen-based reconstruction of past European vegetation in quantitative terms has been the focus of several research projects in recent years. A comparison of the results of three such efforts gives insights into the accuracy of different methods (Roberts et al. 2018). Here we summarize the methods, outcomes and their implications. The approaches include, firstly, a mechanistic model of the pollen-vegetation relationship (REVEALS; Sugita 2007) taking into account inter-taxonomic differences in pollen morphology, pollen productivity and characteristics of pollen dispersal and deposition. The second dataset derives from a pseudo-biomization (PBM) based approach, which assigns each individual taxon to a “land-cover class” and then allocates each pollen sample to a “biome” (Woodbridge et al. 2014a; Fyfe et al. 2015). The third is a dataset of tree pollen values converted from pollen data using a Plant Functional Type (PFT) approach (Davis et al. 2015; Fig. 1). The reconstructed vegetation datasets that are used in this comparison are primarily based on the fossil and modern European Pollen Databases (EPD and EMPD; Leydet et al. 2007-2017; Davis et al. 2013), alongside new chronologies produced by Giesecke et al. (2014). The REVEALS approach is the most complex of the three methods and requires pollen productivity values for the major plants involved in the vegetation reconstruction. Here we use the REVEALS reconstructions published by Trondman et al. (2015) for five time windows of the past 6000 years. The PBM and PFT methods are simpler and do not require values of pollen productivity. They can be more easily applied on broad spatial scales to provide time-continuous vegetation reconstructions.
Comparing vegetation reconstructions
 |
|
Figure 2: Pollen-inferred forest cover for: (A) mid-latitude and; (B) northern Europe using the PBM, PFT and REVEALS approaches for the same grid cells; (C) PBM scores for pasture/arable and disturbed land, broad-leaf forest and needle-leaf forest during the last 11,000 years for all reagions. (D) UK and Ireland REVEALS estimates for key vegetation types, and; (E) summed probability distributions of normalized archaeological radiocarbon dates in the UK (Woodbridge et al. 2014b). |
For this comparison, Europe has been divided into three broad climatic-ecological zones, namely Mediterranean, northern and mid-latitude Europe, with results presented for the latter two regions (Fig. 1). Estimates of Holocene vegetation change, using the different approaches, show broadly similar trends for mid-latitude and northern Europe (Fig. 2). The period of maximum forest occurred between approximately 8200 to 6000 BP, followed by a progressive decline in forest cover that accelerated after around 1200 BP (early Medieval times). The PBM, PFT and REVEALS reconstructions show remarkably similar reconstructions for total forest cover in mid-latitude Europe. They reveal that the percentage of forest cover has declined more in mid-latitude than in northern Europe over the last 6000 years, from about 65 to ~38%. The mid-latitude zone was originally dominated by broad-leaf trees, much of which has now been converted to arable and pasture land, but also by late migrating trees such as spruce, fir and beech. However, within this temperate zone, there were marked inter-regional differences in the timing of forest loss. In particular there were contrasting historical trajectories between north-central Europe, where the majority of forests remained intact until Early Medieval times (although records from some areas, such as coastal Poland, show forest loss earlier), and the UK and Ireland, France and Belgium, where most forests had already been cleared in Bronze and Iron Age times (Woodbridge et al., in press). Reconstructions of Holocene forest cover in the northern boreal zone show less consistency between the different pollen-based methods, with the PFT reconstructions systematically higher than those for REVEALS and PBM (Fig. 2). This reflects the weighting applied to open land-cover classes during the PBM process, which was applied after testing the method using modern surface-pollen samples and comparing against remotely-sensed maps (Woodbridge et al. 2014a), and the lower productivity of open vegetation types accounted for in the REVEALS reconstructions. For all regions of Europe, the PBM reconstructions show that the loss of broad-leaf forest has been more pronounced than that of needle-leaf forest (Fig. 2c). This is also shown by the REVEALS reconstructions performed in mid-latitude and northern Europe (e.g. Marquer et al. 2017).
Numerous factors have contributed to vegetation change and forest loss, including climatic changes and long-term ecological dynamics, along with forest conversion to agricultural and grazing lands. Early Holocene pasture/arable and disturbed land PBM scores represent natural vegetation dynamics. An increase in pasture, arable and disturbed land (indicated by the PBM scores for these land-cover classes) is evident from 4000 BP, i.e. Bronze Age (Fig. 2c). This accelerates in the most recent 2000 years, and indicates an increase in agricultural land broadly in line with the loss of forest. Focusing on sub-regions can allow exploration of patterns between vegetation and demographic change. Patterns of demographic change in human societies can be inferred from the density of 14C dates from archaeological sites, which is shown here for the UK (Fig. 2e; Woodbridge et al. 2014b), and indicate an increase in human populations after 6000 BP following the appearance of Neolithic farming. This pattern is reflected in the loss of forests and opening of vegetation indicated by REVEALS reconstructions (Fig. 2d).
Future priorities for pollen and land-cover research
The impacts of past human populations in transforming natural vegetation have major significance for understanding long-term forest dynamics and for future conservation and management of such resources. For instance, this allows habitats that could be more resilient or at risk from future environmental change to be identified. Future research needs to focus on developing the links between fossil pollen assemblages and land cover in regions where these relationships are not yet so well understood, for example, through obtaining values of pollen productivity for major plants in the Mediterranean region. A greater number of reliable pollen datasets with good chronologies are needed to further develop understanding of vegetation, land-cover and land-use changes, especially in areas where current data coverage is poor. Improved spatial coverage would also allow models of anthropogenic land-cover change to be better evaluated. Different approaches to vegetation reconstruction allow testing of the differing abilities of these methods to sense landscapes. REVEALS offers a quantified and spatially-explicit approach, which is valuable to branches of sciences that require detailed information about past land cover, such as climatologists (Gaillard et al. 2010). Advances have been made in quantifying the effects of past land use and climate on European vegetation change (e.g. Marquer et al. 2017) and in producing forest reconstructions based on the Modern Analog Technique (MAT) through coupling modern pollen samples with satellite-based forest cover (Zanon et al. 2018). Furthermore, in diverse heterogeneous landscapes, such as the Mediterranean, the use of cluster analysis can offer useful results for exploring past vegetation change (Fyfe et al. 2018). PBM and PFT-based methods provide descriptive accounts of vegetation and land-use changes, which can provide valuable comparisons with datasets that give information about disturbance in the past, such as paleoclimate records, fire history trends, and shifts in past human populations inferred from archaeological site densities. Such comparisons will be of value in further deciphering the causes of long-term land-cover change.
acknowledgements
We are grateful to the many funding bodies and institutions that have supported the different research groups that created the datasets used in this study and all contributors to the databases utilized.
affiliations
1School of Geography, Earth and Environmental Sciences, Plymouth University, UK
2School of Natural Sciences, Linnaeus University, Kalmar, Sweden
3GEODE UMR 5602, University Toulouse Jean Jaurès, France
4Institute of Earth Surface Dynamics, University of Lausanne, Switzerland
contact
Jessie Woodbridge: jessie.woodbridgeplymouth.ac.uk
references
Davis BAS et al. (2013) Veg Hist Archaeobot 22: 521-530
Davis BAS et al. (2015) Veg Hist Archaeobot 24: 303-317
Fyfe RM et al. (2015) Glo Change Biol 21: 1197-212
Fyfe RM et al. (2018) Veg Hist Archaeobot 27: 351-364
Gaillard M-J et al. (2010) Clim Past 6: 483-499
Giesecke T et al. (2014) Veg Hist Archaeobot 23: 75-86
Leydet M (2007-2017) The European Pollen Database. http://www.europeanpollendatabase.net
Marquer L et al. (2017) Quat Sci Rev 171: 20-37
Roberts N et al. (2018) Sci Rep 8: 716
Sugita S (2007) Holocene 17: 229-241
Trondman A-K et al. (2015) Glob Change Biol 21: 676-697
Woodbridge J et al. (in press) Late Antique Archaeol
Woodbridge J et al. (2014a) J Biogeogr 41: 2080-2092
Kathleen D. Morrison1, E. Hammer2, L. Popova3, M. Madella4, N. Whitehouse5, M-J Gaillard6 and LandCover6k Land-Use Group Members*
Although archaeological data are needed to understand the impacts of past human land use on the Earth system, synthesis is hampered by a lack of consistent categories. We develop hierarchical and scalable land-use classifications for use across the globe.
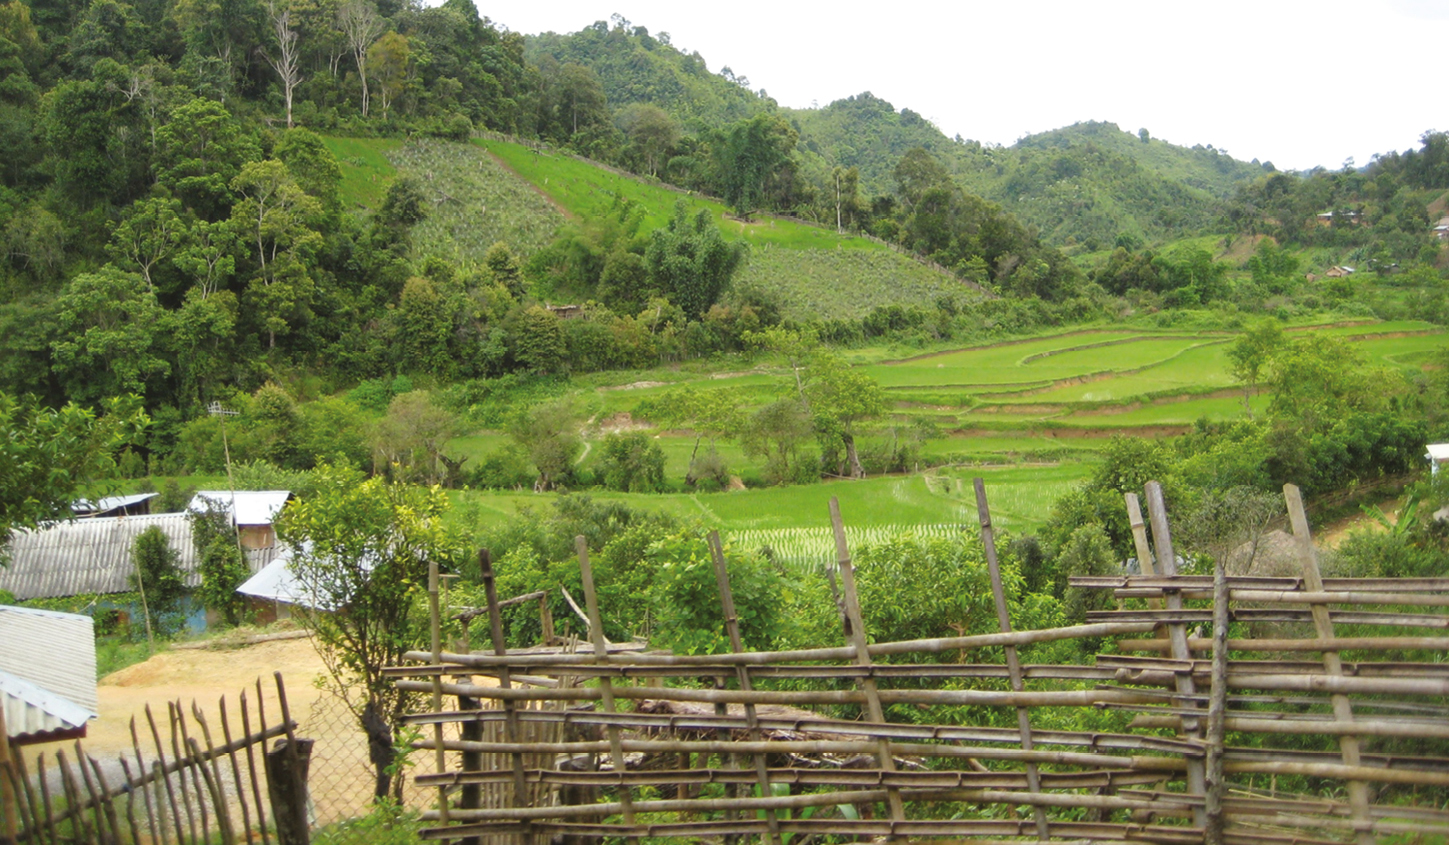 |
|
Figure 1: Land-use systems are often mosaics, incorporating multiple forms of land use simultaneously. In this village in the Philippines, irrigated rice fields are grown near the settlement, while the hillsides are used for swidden farming. This land-use regime would be classified as agriculture in level 1 of the LandCover6k land-use classification (Fig. 2), flooded-field farming and swidden in level 2, and rice paddy/taro pondfield in level 3. Domesticated animals and crops would be coded separately. Image credit: O. Paredes. |
Human land-use practices have been highly variable over the course of the Holocene, a diversity evident in the differentiated effects of human activity on land cover. Historically, agriculture was one of the most significant forms of land use, but even mobile hunter-gatherers transformed land cover through landscape-scale burning (Bliege Bird 2008). Livestock-keeping, plowing, irrigation, and the production of metal, ceramics, and bricks, have also been drivers of historical change. It is important to understand the aggregate effects of anthropic activities on the Earth system, but significant challenges are posed by: (1) the complexity, diversity and mosaic nature of human land use itself (Fig. 1); (2) the need to develop a uniform vocabulary and terminology for land-use practices around the globe and across the span of human history; (3) the sheer quantity of evidence to be analyzed; and (4) the lack of a tradition of global-scale comparisons. Nevertheless, there is a deep reservoir of expertise about land-use and land-cover transitions waiting to be tapped. One goal of LandCover6k is to improve understanding of the relationships between land-use and land-cover changes (Gaillard et al., this issue). By comparing land-use and land-cover trends, we can better disentangle anthropogenic forms of land- cover change from climatic or other drivers.
The LandCover6k land-use classification
 |
|
Figure 2: The LandCover6k land-use classification matrix. |
Comparison of land-use practices is complicated by regionally- and historically-specific terminologies. Even where the same category is used, there may be disagreement about the applicability of the term. “Agriculture”, for example, is subject to multiple interpretations about boundary conditions. In part, classificatory chaos reflects the complexity of land use itself. People typically practice multiple forms of land use simultaneously, and shift strategies as needed. This is not merely a complication but a critical area of research relating to resilience, sustainability and fundamental processes of change. We have sought to retain as much of this important complexity as possible while also making the simplifications necessary for global comparison.
To develop systemic, global-scale comparisons of land-use/land-cover relationships, it is first necessary to employ a consistent set of categories. Accordingly, and in consultation with scholars from across the globe, we developed a unified set of land-use categories (Fig. 2). The classification is hierarchical and expandable, with the highest level of generality designed to facilitate global analyses (level 1), and lower-order categories for regional studies (levels 2-3). Like all classifications, it simplifies complex systems, but such tradeoffs are offset by the analytical possibilities for large-scale analyses and minimized by the multi-level structure of the classification.
It is important to note that categories refer to activities known to have taken place in a particular location and time and do not necessarily reflect specific groups of people. Thus, if we know that both farming and pastoralism took place in the same area, we can include both categories in the database regardless of whether or not pastoralists were socially distinct from farmers. Categories refer to land (e.g. animal herding is taking place in this location) rather than to people (people here are herders), with the database designed to allow multiple forms of land use to co-exist.
Land-use types
The most general classification of land-use types was developed during a PAGES-sponsored workshop (Morrison et al. 2016) and refined during several regional workshops and an INQUA-sponsored thematic workshop (HoLa). The term “No evidence of land use” is to be used in cases where archaeologists are reasonably certain that humans were not present. “Minimal or extensive land use” applies to areas which are, for example, crossed by a few roads, but are not otherwise in use. Hunting and gathering encompasses both mobile and sedentary foragers; we presume that tending of wild plants is often a feature of forager land use. Within archaeology, much scholarly effort has been expended on the precise contours of early farming and its differentiation from other forms of land use; we recognize this complexity and have built in levels of detail sufficient for regional-scale studies.
Agriculture is the most internally diverse land-use class, reflecting both its history and significance to landscape transformation. The level 2 classification of agricultural forms (Fig. 2) is therefore the most finely subdivided. Not all croplands are equivalent. In the tropics, for example, forms of arboriculture typically mimic the structure of the natural forest in terms of taxonomic diversity and vegetation structure; arboriculture plots may be relatively short-lived, making differentiation between “natural” and anthropogenic vegetation difficult over the long term. In some temperate regions, domesticated grazers, such as cattle, are associated with human-made pastures, a practice uncommon in Africa and Asia. The manipulation of water and of slope are often critical components of agricultural practice; irrigated, ditched and terraced landscapes are found across the globe, associated with a range of cropping practices. Understandings of the aggregate effects of human land use on the Earth system must address this diversity, but also develop modes of comparison that make it possible to aggregate the vast, scattered body of archaeological and historical data.
Pastoralism without farming is sufficiently important in some regions that it was made a global (level 1) category. Where farming accompanies herding, however, our classification places this under the heading of agriculture. Similarly, the category “urban and extractive industries”, which includes land used for cities, mines, and quarries, was included at the global level because of its significant impact on land cover, despite its often-limited spatial extent. More detailed discussions and definitions of the land-use classifications are in preparation.
Land-use variables in the database
Our system allows the comparison of archaeological and historical data from across the globe and throughout the Holocene. It does not, however, provide systemic data on specific land-use practices of interest to climate modelers that may cross-cut categories. For example, mobile hunter-gatherers in Australia and North America who used fire as part of their subsistence strategies changed regional vegetation in ways that mobile hunter-gatherers not practicing landscape burning did not. In this case, a single land-use category masks a significant difference. Similarly, tillage, livestock production, irrigation, and pyrotechnologies may have important land-cover effects that complicate simple categorization. For example, metal production, which uses large quantities of wood (Jouffroy-Bapicot et al. 2007), can occur in diverse farming or urban contexts and is not necessarily linked to a specific land-use regime. Similarly, the same overall land-use regime (e.g. dry farming) may be carried out with either digging sticks or plows, but the choice of technology itself has implications for carbon cycling. Tillage, like burning and irrigation, may impact carbon cycling independently of the crop grown. Accordingly, our classification includes some variables within land-use groups (irrigation and large-animal husbandry are part of level 2 classifications), while others are coded separately.
Building a global land-use database
Although archaeologists and historians have amassed a huge amount of information about past human land use, these data cannot be directly compared or quantified without recourse to a single vocabulary. Working in consultation with climate modelers and keeping in mind the need to better understand the links between land use and land cover, we have developed a simple but capacious classification system for forms of land use and specific land-use activities that can be applied at a global level across the Holocene. We hope this framework - the product of several years of widespread consultation - will allow the important archives of archaeological and historical data to be marshaled to address critical issues of global change.
acknowledgements
HoLA, the Holocene Global Land Use International Focus Group was supported by INQUA IFG 1702F. Thanks also to the Universities of Chicago and Pennsylvania for support.
affiliations
1Department of Anthropology and Museum of Archaeology and Anthropology, University of Pennsylvania, Philadelphia, USA
2Department of Near East Languages and Civilization, University of Pennsylvania, Philadelphia, USA
3Barrett Honors College, Arizona State University, Tempe, USA
4Department of Humanities (CaSEs, ICREA), University Pompeu Fabra, Barcelona, Spain
5School of Geography, Earth and Environmental Sciences, Plymouth University, UK
6Department of Biology and Environmental Science, Linnaeus University, Kalmar, Sweden
*J Aleru, U Ibadan, NG; M Arroyo-Kalin, U College London, UK; A Bauer, Stanford U, US; C Betancourt, U Bonn, DE; S Biagetti, U Pompeu Fabra, ES; R Bishop, U College, IE; O Boles, U Pennsylvania, US; CR Clement, INPA, BR; P Cruz, CONICET, AR; BS Dennis, Nat C Youth Develop, NG; A Ekblom, Uppsala U, SE; K Elizabeth, Kyambogo U, UG; E Ellis, U Maryland, US; S Flantua, U Bergen, NO; T Foster, U Tulsa, US; D Gronenborn, Johannes-Gutenberg-U, DE; M Hannaford, Utrecht U, NL; J Iriarte, U Exeter, UK; A Junqueira, U Wageningen, NL; A Kay, U Lausanne, CH; K Klein-Goldewijk, Utrecht U, NL; J Kolář, Masarykovy U, CZ; C Lancelotti, U Pompeu Fabra, ES; P Lane, Uppsala U, SE; C Leclerc, CIRAD, FR; M-P Ledru, IRD, FR; C Lemmen, Helmholtz-Zentrum Geesthacht, DE; C Levis, INPA, BR; U Lombardo, U Pompeu Fabra, ES; S Maezumi, U Exeter, UK; M Manyanga, U Zimbabwe, ZW; R Marchant, U York, UK; N Maughan, Aix-Marseilles U, FR; F Mayle, U Reading, UK; C McMichael, U Amsterdam, NL; S Monprapussorn, Srinakharinwirot U, TH; CP Moraes, U Fed Oeste do Pará, BR; R Muchena, Chesa Forest Research Station, ZW; EG Neves, U São Paulo, BR; S Pandey, Birbal Sahni Inst Palaeobot, IN; L Phelps, U Lausanne, CH; Z Pinke, Szent István U, HU; P Riris, U College London, UK; S Rostain, CNRS, FR; T Russel, U the Witwatersrand, ZA; R Saini, Harisingh Gour Central U, IN; MJ Schmidt, Museu Paraense Emílio Goeldi, BR; A Shikoni, U Dodoma, TZ; A Sluyter, Louisiana State U, US; R Ssemulende, U Dar es Salaam, TZ; D Stump, U York, UK; A Styring, Goethe U Frankfurt, DE; B Sultan, RD, FR; P Szabo, Inst Botany Czech Acad Sci, CZ; E Tamanaha, Inst Mamirauá, BR; E Tello, U Barcelona, ES; E Thomas, Biodiv Internat, CO; B Vanniere, U Bourgogne Franche-Comté, FR; L Wandsnider, U Nebraska, US; M Widgren, Stockholm U, SE
contact
Kathleen Morrison: kathy.morrisonsas.upenn.edu
references
Bliege Bird R (2008) PNAS 105:14796-14801
Jouffroy-Bapicot I et al. (2007) Veg Hist Archaeobot 16: 251-258