PAGES Magazine articles
Robert D. Field1,2, K. Fernandes3, K.C. Glover4, W.D. Hansen5, J. Rabinowicz6 and A.P. Williams7
New York, USA, 23-25 October 2017
The Conference on Fire Prediction Across Scales was held at Columbia University in New York, drawing over 120 attendees from academia, government and the private sector. Input from fire managers enhanced awareness among the fire modeling and paleo communities of the real-world importance of better understanding the drivers of changes in fire activity for safety and land management. The meeting was unique in connecting researchers studying fire prediction at all scales, from the behavior of a flame, to a single wildfire, to changes in global fire patterns from year to year. And, necessarily, to changes in fire over centuries and millennia. The paleofire aspects of the meeting covered advances made in obtaining, synthesizing and interpreting charcoal records from lake sediment and burn scars in tree rings.
David Bowman (U. Tasmania, Australia) described the recent fire-driven loss of Athrotaxis in Tasmania after a dry spring. In trying to understand the degree to which anthropogenic climate change was a factor, Bowman noted that Tasmania’s highly variable fire climate makes climate-change attribution particularly challenging. The paleoecological record provides considerable insight, however, indicating strong El Niño-driven Athrotaxis losses during the late Holocene, serving as a long-term analogue for interpreting current fire regime changes. In New Zealand, Jed Kaplan (U. Oxford, UK) described simulations of vegetation cover over the past thousand years, suggesting Maori arrival as a likely explanation for fire-driven forest loss evidenced in charcoal and pollen records. Further work is needed to consider the climatic influence, given that the Maori arrival was preceded by a possibly confounding Medieval Warm period signal over New Zealand.
In the southwestern US, Rachel Loehman (USGS, USA) examined impacts of human activity on fire regimes over 1200-1900 CE in the Jemez region of New Mexico. Using process-based modeling, Loehman explained how high population densities, intensive agriculture, and fuelwood harvesting could contribute to a 25-fold increase in fire activity, but offset by smaller individual fires on a more fragmented, shrub-dominated landscape. Katherine Glover provided the longest time-scale perspective of the conference, presenting charcoal and pollen data from the San Bernardino Mountains in southern California over 120,000 years from two lake cores. These data are unique in their potential to understand interactions between climate, fire and vegetation cover before the arrival of people.
 |
|
Figure 1: Distribution of charcoal records for successive versions of the Global Charcoal Database (courtesy of Patrick Bartlein and Jennifer Marlon). Data are available from the PAGES Global Paleofire Working Group at www.paleofire.org. |
Jennifer Marlon (Yale U., USA) provided a global perspective, updating on recent activity from the PAGES Global Paleofire Working Group, including the latest (v4) Global Charcoal Database (Fig. 1). Marlon emphasized that, globally, there are pronounced relationships between climate and fire, which can be decoupled by human intervention. Over the western US, for example, a 100-year history of aggressive fire suppression has led to a decrease in fire activity relative to that expected from observed climate records. This has resulted in a “fire deficit” that has enhanced the response of fire activity to intensified fire weather in recent decades.
Attendees identified important areas where progress can be made. There is a need for more data over under-sampled regions, namely Africa and eastern Eurasia. Glover and Marlon identified a specific need for short cores sampled at high resolution to improve comparisons between paleo and contemporary fire records. Interpreting the paleofire record will also benefit from progress made in regional climate reconstructions such as those from the PAGES 2k Network (pastglobalchanges.org/2k-network), and from longer-term climate simulations, such as the Last Millennium Ensemble from the Community Earth System Model (CESM) Paleoclimate Working Group (www.cesm.ucar.edu/working_groups/Paleo).
Overall, conference attendees working mainly on contemporary fire issues were provided a window into the potential for using the paleofire record to provide context for the contemporary record, take the “long-view” in fire management planning, and to make predictions of future fire activity. The full program and presentation abstracts can be found at the Columbia University Initiative on Extreme Weather and Climate website (http://extremeweather.columbia.edu/events/past-events/2017-conference-on-fire-prediction-across-scales).
affiliations
1Department of Applied Physics and Applied Mathematics, Columbia University, New York, USA
2NASA Goddard Institute for Space Studies, New York, USA
3International Research Institute for Climate and Society, Columbia University, New York, USA
4Climate Change Institute, University of Maine, Orono, USA
5Department of Integrative Biology, University of Wisconsin-Madison, USA
6Earth Institute, Columbia University, New York, USA
7Lamont-Doherty Earth Observatory, Columbia University, New York, USA
contact
Robert D. Field: robert.field columbia.edu
Olivier Blarquez1, P. Grondin2 and the GPWG2
Montreal, Canada, 10-14 October 2017
In the past year, fires raged in different places around the world and their impacts on human lives, livelihoods and infrastructures were unprecedented. The long-anticipated effects of ongoing global changes on fire dynamics are now a reality, and have consequences on the functioning of ecosystems themselves, including, among others, loss of resilience, exceeding known range of fire regime variability and burning of ecosystems for which fire was supposedly absent. For example, the length of the California (USA) fire season in 2017 almost doubled, with fires blazing as late as December, and large fires developed in the Greenland tundra where they are unprecedented. Those unusual events modified the global carbon cycle and aerosol emissions, threatened human lives and infrastructures and, associated with climate change, may decrease ecosystem resilience (Stevens-Rumann et al. 2017). In this context, researchers, landscape managers and decision-makers from across the planet are being challenged to reintegrate natural disturbance processes into ecosystem management plans.
PAGES’ Global Paleofire Working Group 2 (GPWG2) organized a workshop which aimed to gather paleofire experts and stakeholders, including governmental agencies, in order to assess the use of long-term fire history for future fire and ecosystem management. Twenty-three participants from 10 countries at all career stages presented their research and worked together on strengthening the links between management and paleofire research.
Before the workshop, each participant was asked to contact a stakeholder, manager or decision-maker from their country of origin to survey their knowledge and interest in paleofire research using a questionnaire that was prepared by the workshop organizers. Several challenges in engaging stakeholders and interesting them in paleofire research emerged from the questionnaire answers and were discussed. Although the use of paleofire records for future ecosystem management has been the topic of several recent studies (e.g. Gillson and Marchant 2014; Girardin et al. 2013), paleofire knowledge is rarely translated into effective management tools and tends to remain a purely theoretical discipline.
 |
|
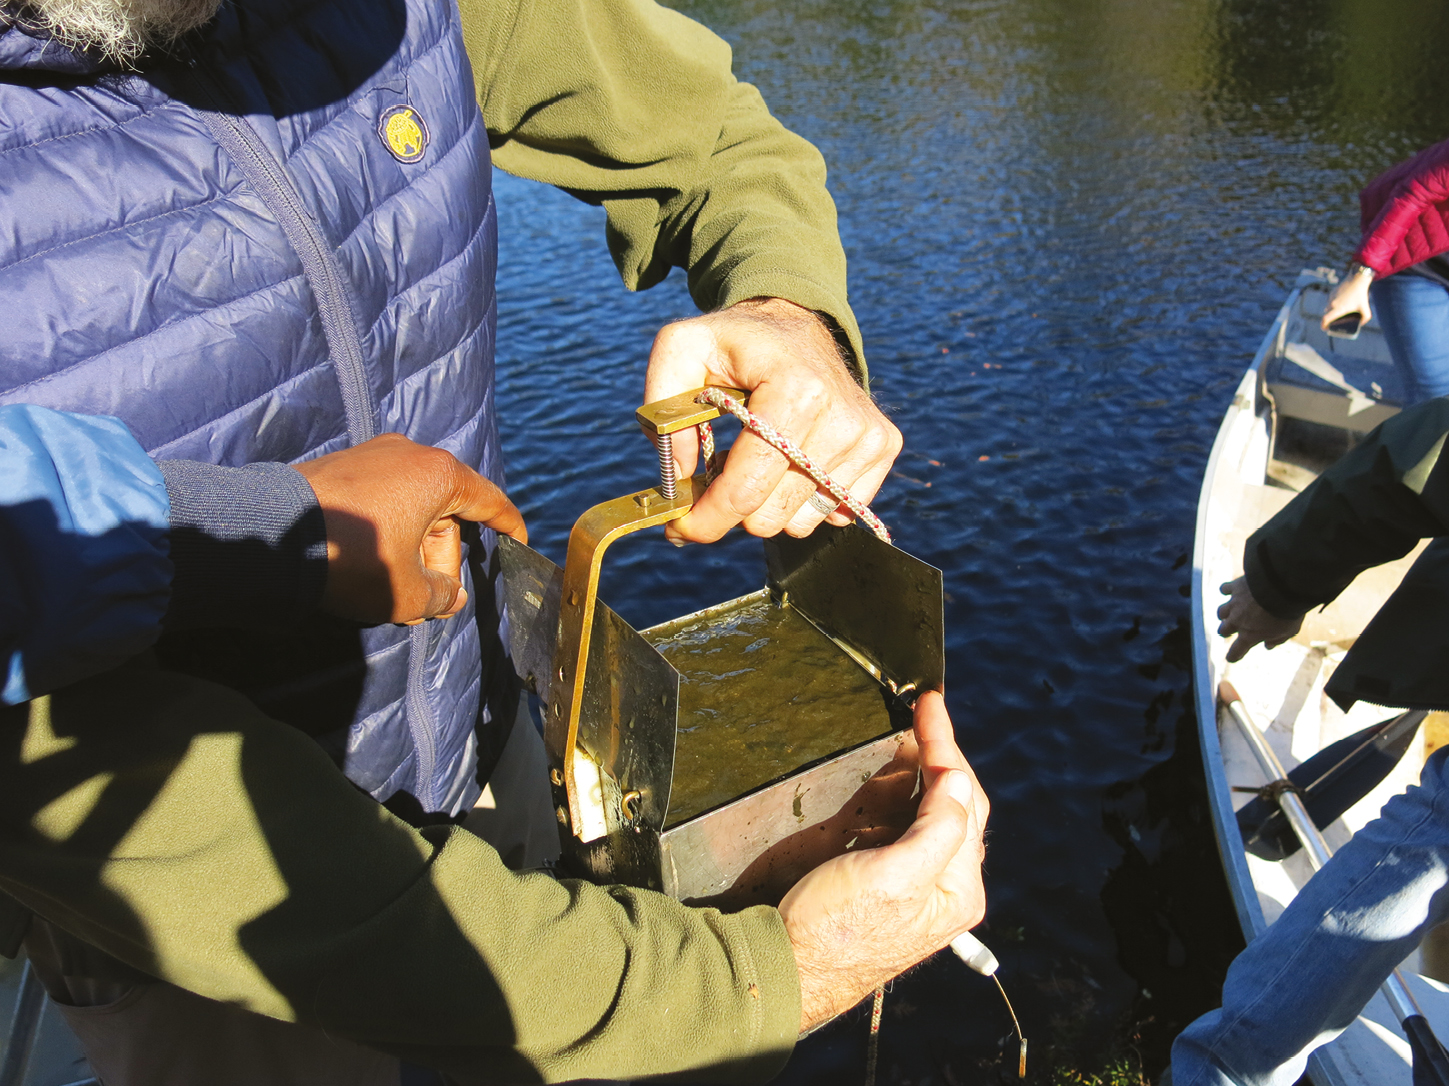
Figure 1: Lac Geai (Canada) surface sediment sampling with an Eckman sampler used to take the first sample for the Global Modern Charcoal Dataset (GMCD) initiative (Hawthorne et al., in press). Image credit: Katarzyna Marcisz. |
Better communication between paleoecologists and managers thus appeared to be the first goal to achieve - but several challenges remain, such as avoiding the use of jargon and using a common vocabulary. These points crucially require the calibration of paleoecological data that could translate past ecological processes into more measurable units (Hawthorne et al., in press). Currently the Global Charcoal Database (GCD, http://paleofire.org) and associated R paleofire package (Blarquez et al. 2014) only gather information on raw charcoal data, which are not directly useful to stakeholders. The development of new products associated with the GCD, such as a database of fire return intervals or other fire regime metrics calculated upon raw GCD data, has the potential to increase paleofire data use for management and will enhance the visibility of the discipline.
While necessary, this is, however, probably not sufficient and the questionnaire highlighted the need for strengthening partnerships between stakeholders and scientists. Co-design of research is starting to emerge in the geoscience field (Vano et al. 2017) and should contribute to make science more useful for communities and future ecosystem management. Several outcomes and products of the Montreal workshop will help paleofire science to follow that trend. There will be (i) the edition of a glossary that will merge terminologies used in paleofire science, ecosystem management and decision-making, and (ii) an updated questionnaire, which will be shared more broadly, to enable scientists to more effectively communicate with local actors and start new partnerships. The development of new methodological tools, such as improved calibration and interpreted past fire metrics from the GCD, will permit (iii) a better communication of paleofire knowledge via open source tools and data (See http://paleofire.org for details).
affiliations
1Department of Geography, University of Montréal, Canada
2Ministère des Forêts, de la Faune et des Parcs du Québec, Québec City, Canada
contact
Olivier Blarquez: olivier.blarquezumontreal.ca
references
Blarquez O et al. (2014) Comput Geosci 72: 255-261
Gillson L, Marchant R (2014) Trends Ecol Evol 29: 317-325
Girardin MP et al. (2013) For Ecol Manag 294: 238-249
Hawthorne D et al. (in press) Quat Int
Pinxian Wang
IODP-PAGES Workshop, Shanghai, China, 7-9 September 2017
 |
|
Figure 1: Map showing all IODP/ODP monsoon-expedition coring sites. |
Between 2013 and 2016, seven deep-ocean drilling expeditions were completed by the International Ocean Discovery Program (IODP) to explore the Cenozoic history of the Indian, East Asian and Australian monsoons. If the former Ocean Drilling Program (ODP; 1983-2003) cruises are included, the drilling activities covered the African and American monsoons regions as well (Fig.1). To further promote paleo-monsoon researches, 48 scientists from 12 countries attended the IODP-PAGES workshop on “Global Monsoon in Long-term Records”. Co-chief scientists of the IODP/ODP monsoon-related expeditions presented their scientific findings, discussed the research directions and made recommendations for the future IODP science program.
The workshop started with presentations given by members of the former PAGES Global Monsoon working group. Traditionally, the variability of the monsoon has been studied almost exclusively on regional scales. With the application of remote sensing and other new techniques since the last decade, the concept of the Global Monsoon has been introduced as a global-scale seasonal reversal of the monsoon circulation associated with the Inter-Tropical Convergence Zone (ITCZ) migration. PAGES established the “Global Monsoon and Low-Latitude Processes: Evolution and Variability” working group in 2007. The working group conducted two successive symposia in 2008 (Wang et al. 2009) and 2010 (Wang et al. 2011), published a special issue in Climate Dynamics (Wang et al. 2012) and two synthesis papers (Wang et al. 2014, 2017) .
A number of questions were discussed during the workshop, such as the applicability of the Global Monsoon concept at geological time scales, monsoon response to external forcing and internal feedback, initiation of the current monsoon systems, the use and misuse of monsoon proxies, and the role of monsoon in global climate system. After extensive discussions, workshop participants recommended that global monsoon and its role in the hydrological cycle should be incorporated in the IODP Science Plan beyond 2023.
Although monsoon precipitation accounts only for one third of the modern global total rainfall, its spatial-temporal variation is the most mutable component in the global hydrological cycle. Together with ENSO and trade winds, global monsoon comprises a major low-latitude component of the world climate system, and thus may provide a key to understanding the controlling factors of the hydrological cycle.
The workshop stressed the value of deep-time monsoon in high resolution records. Despite prominent progress in generating high-quality records over the past decade, the majority of high-resolution paleo-monsoon records remains restricted to the late Quaternary, with only a limited number of sediment sequences at several IODP sites tracing back beyond the Pliocene. A much longer time coverage is urgently needed to reveal the monsoon changes at the Hot- to Ice-House transition, and the tectonic background of when and how the modern monsoon systems established.
Another topic of discussion was monsoon proxies. Chemical and isotopic proxies have been extensively and successfully used in paleo-monsoon reconstructions, but opinions on their interpretation are divergent. Scientific debates call for further calibration of the current proxies and for development of new proxies, especially those indicative of the global monsoon. As many scientists working in monsoon regions tend to interpret all variance in the context of monsoon circulation, it is essential to discriminate the component of climate changes related from those unrelated to monsoon variations.
Workshop attendees also called for an extension of the geographic coverage of ocean drilling. The existing deep-sea monsoon records are heavily biased towards the Northern Hemisphere. High-resolution pre-Quaternary records from the Southern Hemisphere, including monsoon areas off South America, Australia and South Africa, are urgently needed. It is also expected that future targets of paleo-monsoon studies will continue to have a strong focus on margin environments, requiring improvements of international political relationships required to gain access to these regions.
affiliation
State Key Laboratory of Marine Geology, Tongji University, China
contact
Pinxian Wang: pxwangtongji.edu.cn
references
Wang P et al. (2009) PAGES news 17: 82-83
Wang P et al. (2011) PAGES news 19: 86-87
Wang P et al. (2012) Clim Dyn 39(5)
Thomas Laepple1, R.V. Donner2 and T. Kunz1
Potsdam, Germany, 25-27 October 2017
PAGES’ Climate Variability Across Scales (CVAS) working group aims to develop a thorough understanding of the mechanisms underlying climate variability across temporal and spatial scales. A specific focus lies on centennial to millennial timescales, where the variability observed in paleoclimate archives cannot be exclusively explained by a linear response to external factors, like solar variability or changes in orbital parameters, but exhibits a rich variability across a broad range of scales. In this context, the first CVAS workshop in fall 2016 (Franzke 2017) identified an existing knowledge gap regarding the scaling regimes of climate variability during the Holocene and the associated differences between tropics, extratropics and polar regions, as well as between land and ocean.
 |
|
Figure 1: Space-time spectrum of simulated Holocene temperature variability. Global 2 m temperature anomaly fields from the last 7000 years of the TraCE-21ka paleoclimate model simulation (Liu et al. 2009) have been decomposed into spherical harmonics; the annual cycle has been removed. The power spectral density generally increases towards longer spatial and temporal scales. |
The purpose of the second CVAS workshop, held at the Potsdam Institute for Climate Impact Research, was to specifically address these aspects to characterize Holocene climate variability in both space and time (Fig. 1). With relatively stable climate conditions similar to present-day, the Holocene constitutes a unique reference period for studying temporal scaling properties based upon a variety of paleoclimate archives, together with reconstructions of key climate forcing factors like solar irradiation and volcanic activity.
With generous financial support from PAGES, the Alfred Wegener Institute Helmholtz Center for Polar and Marine Research, and the German Federal Ministry for Education and Research, the meeting brought together 41 scientists, including 25 early-career researchers, working on Holocene climate variability from three distinct perspectives: data acquisition and interpretation, development and application of time-series analysis methods, and theoretical climatology and climate modeling.
The first day comprised plenary talks introducing the state of the art along with key open challenges in the field. These overview presentations and accompanying panel discussions set the stage for forming three breakout groups:
Data – how to select the best archives to quantify climate variability and understand their caveats
The data group summarized key properties of the major climate archives concerning potential time-scale dependencies in the proxy-to-climate relationship and the time-scale dependencies of non-climatic effects on the recorded signal. It further identified key areas and datasets that provide good starting points to characterize the spatial and temporal scaling of climate variability.
Analysis tools – from paleo-observations to robust and reproducible variability estimates
The subgroup on analysis tools identified a suite of traditional as well as unconventional methods for studying temporal and spatial scaling in paleoclimate archives and discussed conceptual and practical limits of the existing methods. Particular attention was paid to the challenge of unevenly sampled and “gappy” data and possible ways to overcome existing methodological limitations, triggering some joint research efforts among different members of this subgroup.
Models and theory – origins and interpretation of the space-time structure of Holocene climate variability
The model and theory subgroup discussed possible mechanisms that may generate centennial to millennial scale variability and shape its temporal and spatial structure, summarized existing theoretical concepts to describe and understand such fluctuations, and then formulated working hypotheses in order to focus ongoing research efforts. The subgroup also emphasized the necessity to communicate to the data subgroup the specific data requirements for testing and selecting different theoretical hypotheses.
Following the discussions within the subgroups and in the panel, initiatives have been started to systematically summarize the current state of the art in upcoming review papers. Another outcome of these discussions was a dedicated CVAS session and short course at the General Assembly of the European Geosciences Union in Vienna, Austria, in April 2018.
affiliations
1Alfred Wegener Institute Helmholtz Centre for Polar and Marine Research, Potsdam, Germany
2Potsdam Institute for Climate Impact Research, Potsdam, Germany
contact
Thomas Laepple: tlaeppleawi.de
references
Alexandra Skrivanek1, M.R. Sandstrom2 and J. Shakun3
Playa del Carmen, Mexico, 6-9 November 2017
The exquisitely exposed Last Interglacial (LIG) fossil coral reefs in the Yucatan Peninsula, Mexico, served as the backdrop for the fifth and final meeting of the PALSEA2 (PALeo constraints on SEA level rise 2) working group (Fig.1). The workshop highlighted current research on ice-sheet and sea-level changes, addressed critical gaps in field observations, and assessed the current knowledge regarding causes, rates, and mechanisms of sea-level and ice-sheet dynamics during past warm periods.
The five-day program (pastglobalchanges.org/science/wg/palsea/meetings/127-pages/1715) included 29 presentations, several group discussions, a poster session, and field excursions to fossil reefs at Xcaret and limestone caves at Rio Secreto. A major theme was the need to combine existing paleo sea-level and ice-sheet databases into a centralized global compilation with a streamlined user interface. Standardizing, interpreting and assessing the quality of field data were discussed as key components for integration and application by the modeling community. For example, participants considered how sample elevation does not necessarily equate to relative paleo sea level, and the need for clear, systematic descriptions explaining interpretations in paleo databases. Talks explored complications of interpreting sea level from fossil reefs, where accretion is often determined by storm deposition of coral rubble.
 |
|
Figure 1: Last Interglacial fossil reefs at Xcaret, Mexico. Image credit: Alexandra Skrivanek. |
Participants also examined the quantification of uncertainty due to glacial isostatic adjustment (GIA) on global sea-level signals in order to reconcile peak LIG sea-level reconstructions. Discussions focused on GIA uncertainty stemming from ice-sheet configurations and 3D Earth-model parameters, as well as the need for additional paleo sea-level data. Suggestions included targeting near-to-intermediate field regions sensitive to GIA, such as the Bahamas, to limit possible ice-sheet configurations, developing adjoint framework methods to efficiently estimate GIA-model parameters, and applying 3D GIA Earth models to investigate model error associated with lateral viscosity variations.
Presentations emphasized the importance of understanding glacial ice-sheet volume and spatial extent prior to the last glacial cycle, which determines GIA effects on LIG sites. New cosmogenic nuclide and sediment provenance techniques have the potential to constrain these glacial ice extents over million-year timescales to orbital timescales, respectively.
Dynamic topography due to mantle convection could have significant effects on the elevation of paleo sea-level indicators, but has substantial vertical uncertainty, leading participants to recommend that larger uncertainty bounds be placed on the current assessment of the peak LIG highstand at 6-9 meters above present global sea level (Dutton et al. 2015). This assessment is consistent with a new, far-field LIG peak sea-level reconstruction from fossil reefs exposed in the Seychelles. Resolving sub-millennial sea-level excursions from LIG deposits remains difficult, considering the vertical uncertainties and complex effects of post-depositional alteration on the interpretation of coral ages. The workshop highlighted new developments regarding the potential for stable oxygen-isotope records from polar ice cores to provide additional constraints on the timing and rate of LIG ice-sheet variability.
Pliocene sea level remains a topic of interest as atmospheric CO2 concentrations were similar to modern values, but constraining global sea level from paleo-shoreline observations and marine geochemical proxies is challenging in light of dynamic topography and diagenesis. Presentations featured a new record of Mid-Pliocene sea-level fluctuations from offshore of New Zealand that offers insight into the pacing and magnitude of ice-sheet variations during this warm period.
Lastly, reconstructions of Holocene ice-sheet stability continue to be refined via multi-proxy and data-model comparisons as well as the detailed study of coral microatolls. A recent compilation of late-Holocene relative sea-level data and advances in statistical modeling of relative sea-level indicators can support the investigation of factors influencing Holocene sea-level change.
Long-term objectives include improving consistency across the various scientific disciplines in terms of quantifying model accuracy and uncertainty, and endorsing transparency and open-source records for modeling and data acquisitions.
acknowledgements
We thank PALSEA2 workshop organizers, namely, Andrea Dutton, Anders Carlson, Glenn Milne, Antony Long and Paul Blanchon, and the supporting organizations: Past Global Changes (PAGES) and the International Union for Quaternary Research (INQUA).
affiliationS
1Department of Geological Sciences, University of Florida, Gainesville, USA
2Lamont-Doherty Earth Observatory, Columbia University, New York City, USA
3Department of Earth and Environmental Sciences, Boston College, Chestnut Hill, USA
contact
Alexandra Skrivanek: lexaskufl.edu
references
PAGES ECN Steering Committee1
Early-career researchers (ECRs) bring fresh and novel ideas that have the potential to contribute to existing knowledge and challenge established paradigms. Intense competition in the current job market coupled with challenges such as establishing a professional identity, competing for grants, and choosing an independent career path are leading to a small success rate of ECRs within academia. Therefore, the greater scientific community is missing out on new research ideas, concepts and collaborations when ECRs are lost through the academic bottleneck effect. So how can we maintain a pool of strong-minded ECRs in academia?
 |
|
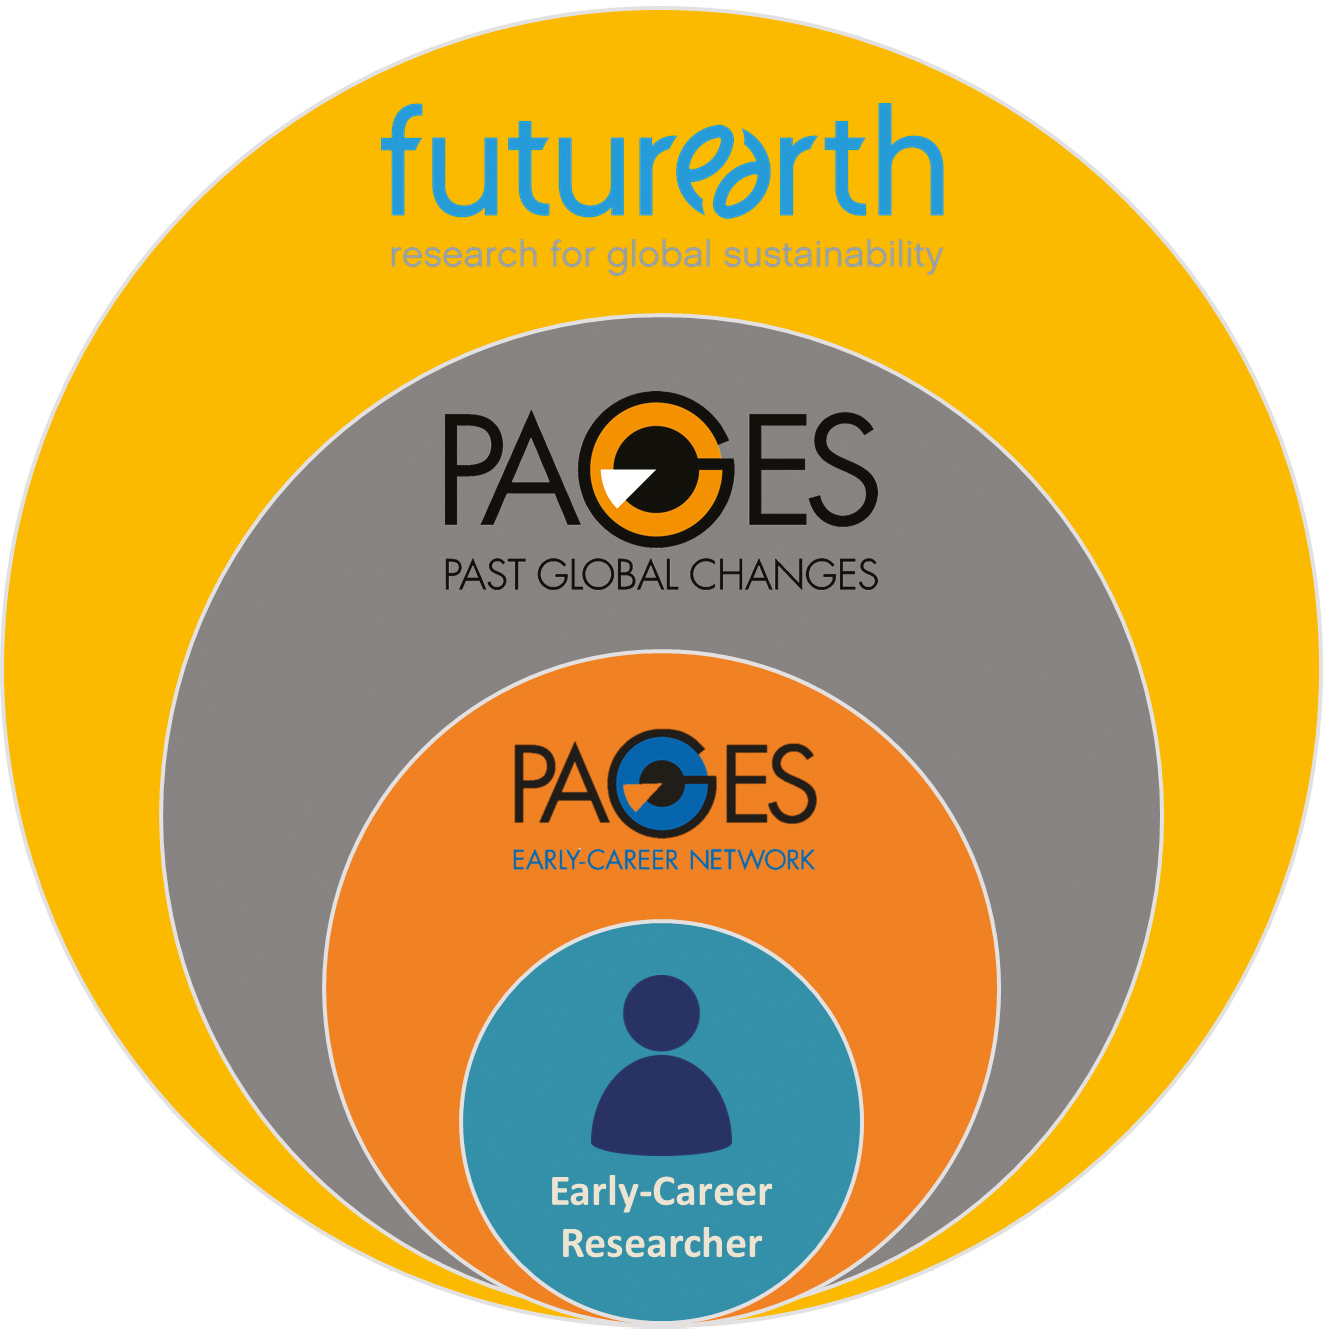
Figure 1: Structure of the PAGES ECN within the PAGES and Future Earth communities. |
One possible answer is establishing a supportive network of researchers that are at the same stages in their careers. So, to facilitate the career of ECRs, the PAGES Early-Career Network (ECN) was created. This idea was first discussed in 2017 at the 3rd Young Scientists Meeting (YSM) in Morillo de Tou, Spain, and resonated with a group of enthusiastic participants. Nested within the PAGES and Future Earth communities (Fig. 1), the goal of the PAGES ECN is to aid in the dissemination of information, establish scientific networks, and foster the development of ideas that can lead to future research collaborations and improved job prospects. Developed by early-career researchers for early-career researchers, the overarching aim of the PAGES ECN is to facilitate the exchange of ideas and skill sets that will provide the tools necessary for researchers to excel in their fields.
The PAGES ECN will achieve this aim by creating a skills database platform where ECRs will be able to meet and share experiences and create ideas for new research and international collaborations. Additionally, the PAGES ECN will foster career development and improve skill sets of ECRs via webinars and training events that will be tailored to the needs of the network participants. The PAGES ECN will promote education and outreach to disseminate scientific ideas to a wider audience and improve the visibility of ECRs in the scientific community by collaborating with other early-career networks.
The interactiveness of the PAGES ECN means any member can participate and work alongside the steering committee, and contribute to the organization of webinars and workshops, as well as participate in outreach events such as the ECN blog and social media platforms. We also seek participation among active members who are interested in acting as regional ECN representatives to facilitate the global integration of ECRs into the wider scientific community. To strengthen the position of ECRs within the PAGES community, members of the ECN steering committee will work with PAGES working groups to nominate a liaison person between them.
Visit the PAGES ECN website http://pastglobalchanges.org/ecn, where you can also sign up to become a member. Also subscribe to the mailing list to keep up to date with our activities. ECRs are encouraged to contribute to The Early Pages blog (https://theearlypages.blogspot.ch). You may also contact the PAGES ECN at pages.ecn@gmail.com and follow us on Twitter (@PAGES_ECN) and Facebook (www.facebook.com/PAGES.ECN), and watch our videos on our Youtube channel (https://www.youtube.com/channel/PAGESECN).
Activities
One month after the network’s February 2018 launch, the committee organized a pair of webinars entitled ‘Welcome to the PAGES ECN’ to introduce the group to the PAGES and paleoscience communities. The first in-person meeting of the PAGES ECN was held at the European Geosciences Union (EGU) meeting in Vienna, Austria, in April 2018. During this splinter meeting, we also introduced the PAGES ECN to interested ECRs. The main goal of this meeting was to exchange directly with other ECRs, get feedback and ideas about this new network, and encourage future collaboration. Future activities will be posted on the website, Twitter and Facebook.
affiliations
1V. Carter (Charles University, Czech Republic); S. Alexandroff (Bangor University, UK); X. Benito (University of Nebraska-Lincoln, USA); A. Bonk (Polish Academy of Sciences, Poland); M. Chevalier (University of Lausanne, Switzerland); A. Kay (University of Lausanne, Switzerland); A. Koch (University College London, UK); S.Y. Maezumi (University of Exeter, UK); N. Schafstall (Czech University of Life Sciences, Czech Republic); T. Trofimova (Uni Research, Bjerknes Centre for Climate Research, Norway).
contact
Andria Dawson1, X. Cao2, M. Chaput3, E. Hopla4, F. Li5, M. Edwards4, R. Fyfe6, K. Gajewski3, S.J. Goring7, U. Herzschuh2,8, F. Mazier9, S. Sugita10, J.W. Williams11, Q. Xu12 and M.-J. Gaillard5
A spatially explicit pollen-based reconstruction of Northern Hemisphere land cover suggests open land increases of 10 to 100% across large parts of the study area over the period 6 and 0.2 ka BP. This change may have influenced past climate.
The quantification of feedbacks and forcings from the terrestrial biosphere onto past and future climate requires Earth system modeling studies that make use of well-constrained descriptions of past vegetation cover (henceforth land cover) and land-use change (Harrison et al.; Gaillard et al., this issue). Most efforts to map past vegetation on a continental to global scale are based on pollen percentages or pollen-based qualitative biome reconstructions. The growing availability of community-supported pollen-data repositories, improved radiometric dating precision, novel age-depth modeling approaches, pollen-vegetation model developments, and new statistical techniques have facilitated the development of highly resolved estimates of hemispheric-scale late Quaternary land-cover change. Spatially explicit regional land-cover reconstructions using pollen preserved in sedimentary archives can be achieved with mechanistic pollen-vegetation models, a kind of proxy system model that describes the processes governing pollen production, transport, and deposition from vegetation to sedimentary archives.
New generation vegetation reconstructions
 |
|
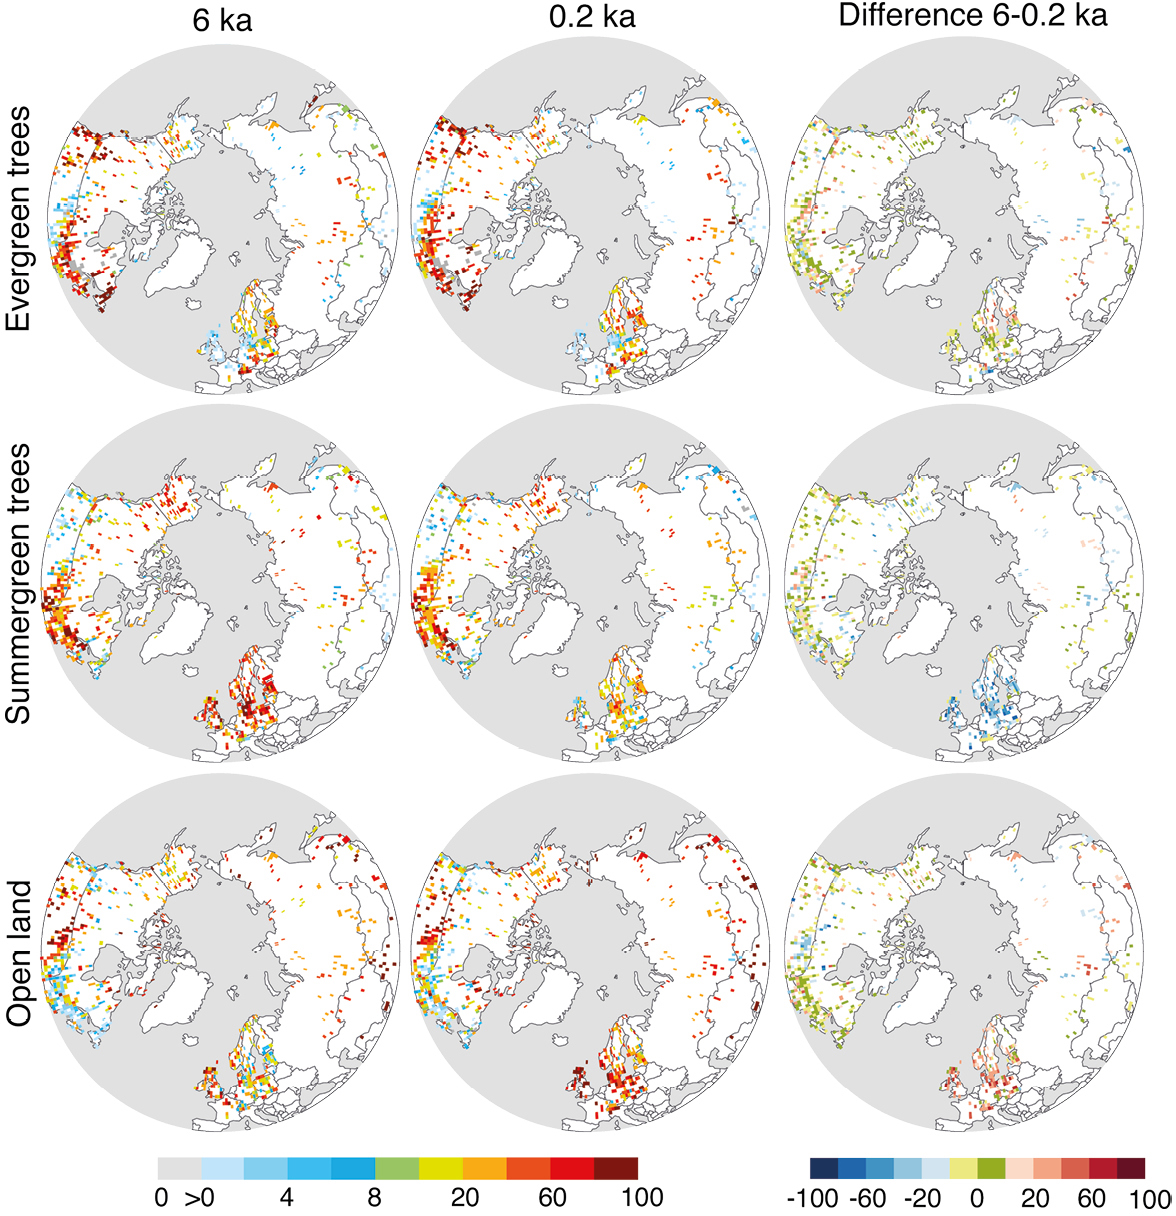
Figure 1: Northern Hemisphere (>40°N) mean fractional land cover for open land, summer-green, and evergreen trees for 6, 0.2ka BP, and the difference between 6 and 0.2 ka BP. Land-cover estimates were generated from site-level pollen records using the REVEALS model and aggregated to 1° x 1°grid cells. The standard errors (SEs) are not shown in this figure for readability (see Fig. 2). |
The PAGES LandCover6k working group (Gaillard et al., this issue) used established methods and comprehensive pollen and vegetation datasets to develop global Holocene (the last 11.5 millennia) reconstructions of land-use and land-cover change. More specifically, the working group focused on time periods commonly targeted by Earth system modelers (Harrison et al., this issue): e.g. 6 and 0.2 ka BP. Preliminary results for the Northern Hemisphere (NH) demonstrate the potential of pollen-based land-cover products in the assessment of anthropogenic land-cover change scenarios (e.g. KK: Kaplan et al. 2009; HYDE: Klein-Goldewijk et al. 2017), and for quantifying climate forcings due to past land-use change. Figure 1 shows the first hemispheric-scale land-cover reconstruction based on a mechanistic pollen-vegetation model; the model used here is known as REVEALS (Sugita 2007). These preliminary results precede and guide the publication of a more comprehensive description of methods and results.
REVEALS can account for inter-taxonomic differences in productivity, dispersal, and deposition of pollen taxa in sedimentary basins (Sugita 2007) and estimates plant abundance on a regional spatial scale (2.5-10 103 km2) in percentage cover or m2/m2 using sedimentary pollen records. REVEALS also provides standard errors (SEs) of plant-cover estimates (Fig. 2). The reported SEs account for component errors within the relative pollen-productivity estimates (RPPs) of the represented pollen taxa and the variation among pollen records used in the reconstruction (Sugita 2007). REVEALS has been validated in several regions of Europe (e.g. Hellman et al. 2008) and North America (Sugita et al. 2010), i.e. pollen-based REVEALS estimates of plant cover based on modern pollen assemblages from surface lake deposits are comparable to plant cover inferred from satellite data, air photographs and vegetation inventories. The REVEALS approach is increasingly used to develop regional-scale land-cover reconstructions, but so far much of that effort has focused on Europe (e.g. Trondman et al. 2015). Land-cover estimates from REVEALS have also been compared to other methods. For example, Roberts et al. (2018) show that REVEALS-based past European land-cover reconstructions differ significantly from those of other pollen-based methods for large parts of the Holocene (Woodbridge et al., this issue). Kaplan et al. (2017) demonstrate that the KK scenarios of European Holocene deforestation are closer to REVEALS estimates of open-land cover than the HYDE scenarios version 3.1.
 |
|
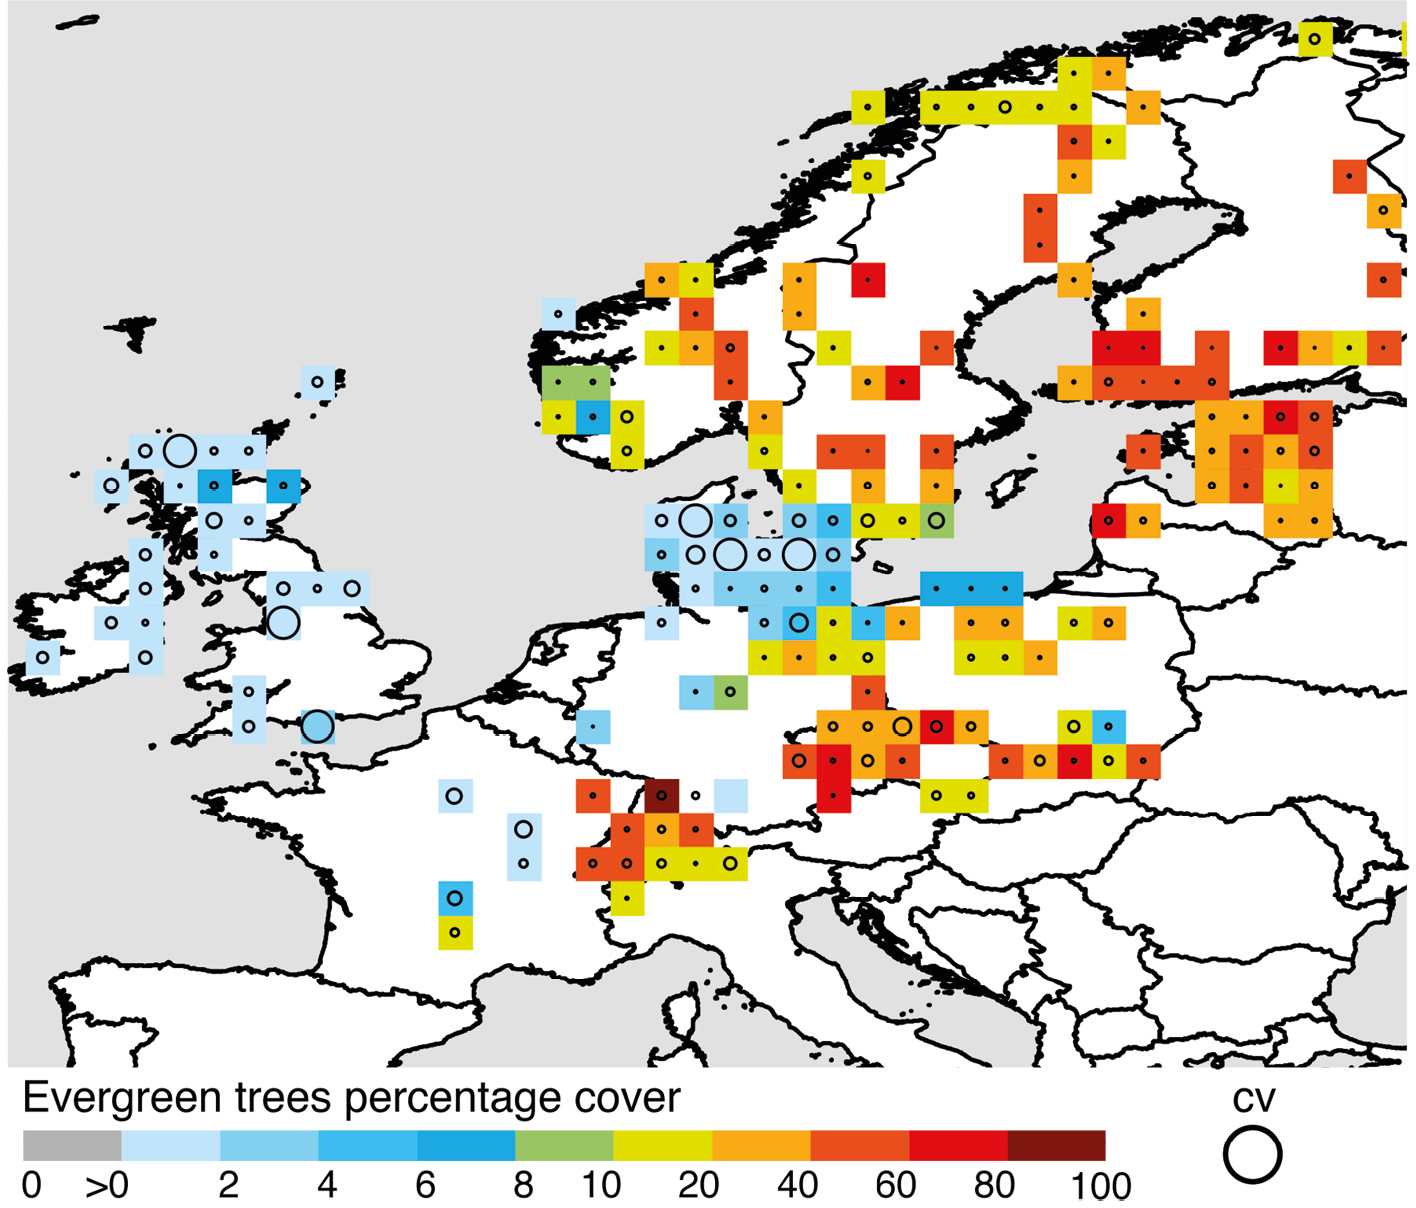
Figure 2: Fractional evergreen cover for 0.2 ka BP (red indicates high cover, see color scale) and reconstruction uncertainty expressed as coefficient of variation (CV; circles; the largest circle corresponds to a SE ≥ mean REVEALS estimates, i.e. estimate not different from zero). |
REVEALS requires several input variables that are not typically needed for other types of paleovegetation reconstructions, including lake or bog size, RPPs, and fall speed of pollen; this information may be missing in legacy data. LandCover6k has led an international effort to gather the relevant knowledge and data for this new generation of land-cover reconstructions. The methodological protocol used follows Mazier et al. (2012) and Trondman et al. (2015). Reconstructions are grid-based (1° x 1° which is the approximate spatial scale of REVEALS reconstructions) and use all appropriate lake- and bog-pollen records available within each grid cell. Pollen records are selected according to criteria including chronology quality, time resolution and pollen-count size. Pollen data was obtained from the European Pollen Database (EPD), Neotoma Paleoecological Database (http://neotomadb.org), and other pollen data archives. This synthesis uses multiple RPPs for a total of 45 plant taxa/pollen morphological types. These RPPs are compiled from Calcote (1995), Commerford et al. (2013) and Prentice and Webb (1986) for northern United States, Canada, and Alaska (23 taxa; Dawson et al. unpublished); Mazier et al. (2012; 25 taxa) for Europe; Cao et al. (unpublished; 27 taxa) for Siberia; and Li et al. (2017 and unpublished, 25 taxa) for China. The REVEALS estimates shown here (Fig. 1 and 2) are for the time periods 0.1-0.35 ka BP (0.2 ka, i.e. end of the Little Ice Age, high deforestation) and 5.7-6.2 ka BP (6 ka; low deforestation). The width (i.e. resolution) of the time windows follows Trondman et al. (2015) and ensures that pollen counts are large enough to obtain REVEALS estimates with low SEs. The obtained REVEALS estimates (and their SEs) for the individual plant taxa were grouped into three land-cover types: evergreen trees, summer-green trees, and open land§.
Land-cover transformation between 6 and 0.2 ka BP
This synthesis of NH land cover at 6 and 0.2 ka BP (Fig. 1) highlights stability (green color, +/-10%) or regional increases (red colors, >10%) in evergreen trees (ET) in Europe (Finland and Sweden), southern Siberia, western Cordillera, and northeastern regions of North America. However, ET decreased across portions of Siberia, subarctic Canada, and Scandinavia (blue colors, <-10%). Summer-green trees (ST) decreased (blue colors, <-10%) most significantly in Europe; they also occur in other regions of the NH (North America, Canada, Siberia, western China) where either open land or evergreen trees increased (green, with up to 10%, to red colors). Open land (OL) increases are evident and largest in Europe, and also occur in south-central and eastern Siberia, and northwest China. In North America, OL decreased in the eastern Great Plains, with less pronounced and localized OL increases in both western and eastern North America.
These patterns of OL increases reflect both extrinsic forcing by humans and climate and intrinsic forest processes. Further integration with paleoclimatic and archeological data is needed to disentangle these influences. Regardless of the cause, changes towards more open landscape may have affected both the global and regional climate. For example, climate modeling experiments using a regional climate model in Europe demonstrated biogeophysical forcings on climate from anthropogenic land-cover change between 6 and 0.2 ka BP of +/- 0.5-1.0°C, with the sign and size of the forcing varying by geographical location and season (Strandberg et al. 2014). Other experiments suggest that early anthropogenic land use in Mesoamerica (ca. Late Classic Maya Period, ca. 1.7-1.05 ka BP) may have decreased summer precipitation by 10 to 20% (Cook et al. 2012).
Improving dynamic vegetation models
The Landcover6k REVEALS syntheses will be of interest to many researchers, but they are primarily designed to support modeling studies of vegetation-atmosphere-anthropogenic feedbacks in the past. The REVEALS estimates will be compared to and integrated with the history-archaeology-based LandCover6k land-use mapping (Gaillard et al., Morrison et al., this issue). These syntheses will be used to evaluate and improve both land-cover and land-use descriptions that are implemented in Earth system modeling, in particular in the next phases of the PMIP (Paleoclimate Modelling Intercomparison Project; Harrison et al. and Stocker et al., this issue). Current work is focusing on the development of new methods that allow for reconstructions with more complete spatio-temporal coverage and which more explicitly account for uncertainty in the data (e.g. age-depth model uncertainty) and processes (e.g. dispersal and differential production) . This explicit treatment of uncertainty, combined with recent advances in data assimilation, allows for the integration of quantitative land-cover estimates and dynamic vegetation models to move towards improved ecological and climate forecasting.
§Evergreen trees: fir, spruce, pine, hemlock, juniper, other species of the cypress family; summer-green trees: larch, alder, birch, hornbeam, hazel, beech, ash, aspen/poplar, oak, linden, elm, chestnut (if growing as forest), willow; open land: heather, pink family, chestnut (if growing in cultural landscapes), walnut, amaranth/goosefoot family, ragweed, mugwort, other species of the daisy family, cabbage family, cannabis/hop, bindweed, sedges, legume family, meadow sweet and other species of Filipendula, mint family, lily family, grasses, knotweed family, ribwort plantain, hoary plantain, common plantain and other plantain species, buttercup family, rose family, common sorrel/sheep’s sorrel and other sorrel species, rye, and other cereals.
affiliations
1Department of General Education, Mount Royal University, Calgary, Canada
2Polar Terrestrial Environmental Systems, Alfred Wegener Institute for Polar and Marine Research in the Helmholtz Association, Potsdam, Germany
3Department of Geography, Environment and Geomatics, University of Ottawa, Canada
4Geography and Environment, University of Southampton, UK
5Department of Biology and Environmental Science, Linnaeus University, Kalmar, Sweden
6School of Geography, Earth and Environmental Sciences, Plymouth University, UK
7Department of Geography, University of Wisconsin, Madison, USA
8Institute of Earth and Environmental Sciences & Institute of Biochemistry and Biology, University Potsdam, Germany
9Department of Environmental Geography (GEODE), University of Toulouse II Jean Jaurès, France
10Institute of Ecology, University of Tallinn, Estonia
11Department of Geography and Center for Climatic Research, University of Wisconsin, Madison, USA
12College of Resources and Environment Science, Hebei Normal University, Shijiazhuang, China
contact
Andria Dawson: andria.dawsongmail.com
references
Calcote R (1995) J Ecol 83: 591-602
Commerford JL et al. (2013) Am J Plant Sciences 4: 34550
Cook BI et al. (2012) Geophys Res Lett 39: L16706
Hellman S et al. (2008) J Quat Sci 23: 21-42
Kaplan JO et al. (2009) Quat Sci Rev 28: 3016-3034
Kaplan JO et al. (2017) Land 6: 91
Klein Goldewijk K et al. (2017) Earth Syst Sci Data 9: 927-953
Li F et al. (2017) Veg Hist Archaeobot 26: 587-605
Mazier F et al. (2012) Rev Palaeobot Palyno 187: 38-49
Prentice IC, Webb T (1986) J Quat Sci 1: 35-43
Roberts N et al. (2018) Sci Rep 8: 716
Strandberg G et al. (2014) Clim Past 10: 661-680
Sugita S (2007) Holocene 17: 229-241
Furong Li1, X. Cao2, U. Herzschuh2, X. Jia3, S. Sugita4, P.E. Tarasov5, M. Wagner6, Q. Xu7, F. Chen8, A. Sun9 and M.-J. Gaillard1
Pollen proportions generally underestimate past open land cover in Eastern China. Pollen-based REVEALS reconstructions of plant cover in conjunction with archaeological and historical data provide more realistic descriptions of past anthropogenic deforestation than the scenarios commonly used by climate modelers.
 |
|
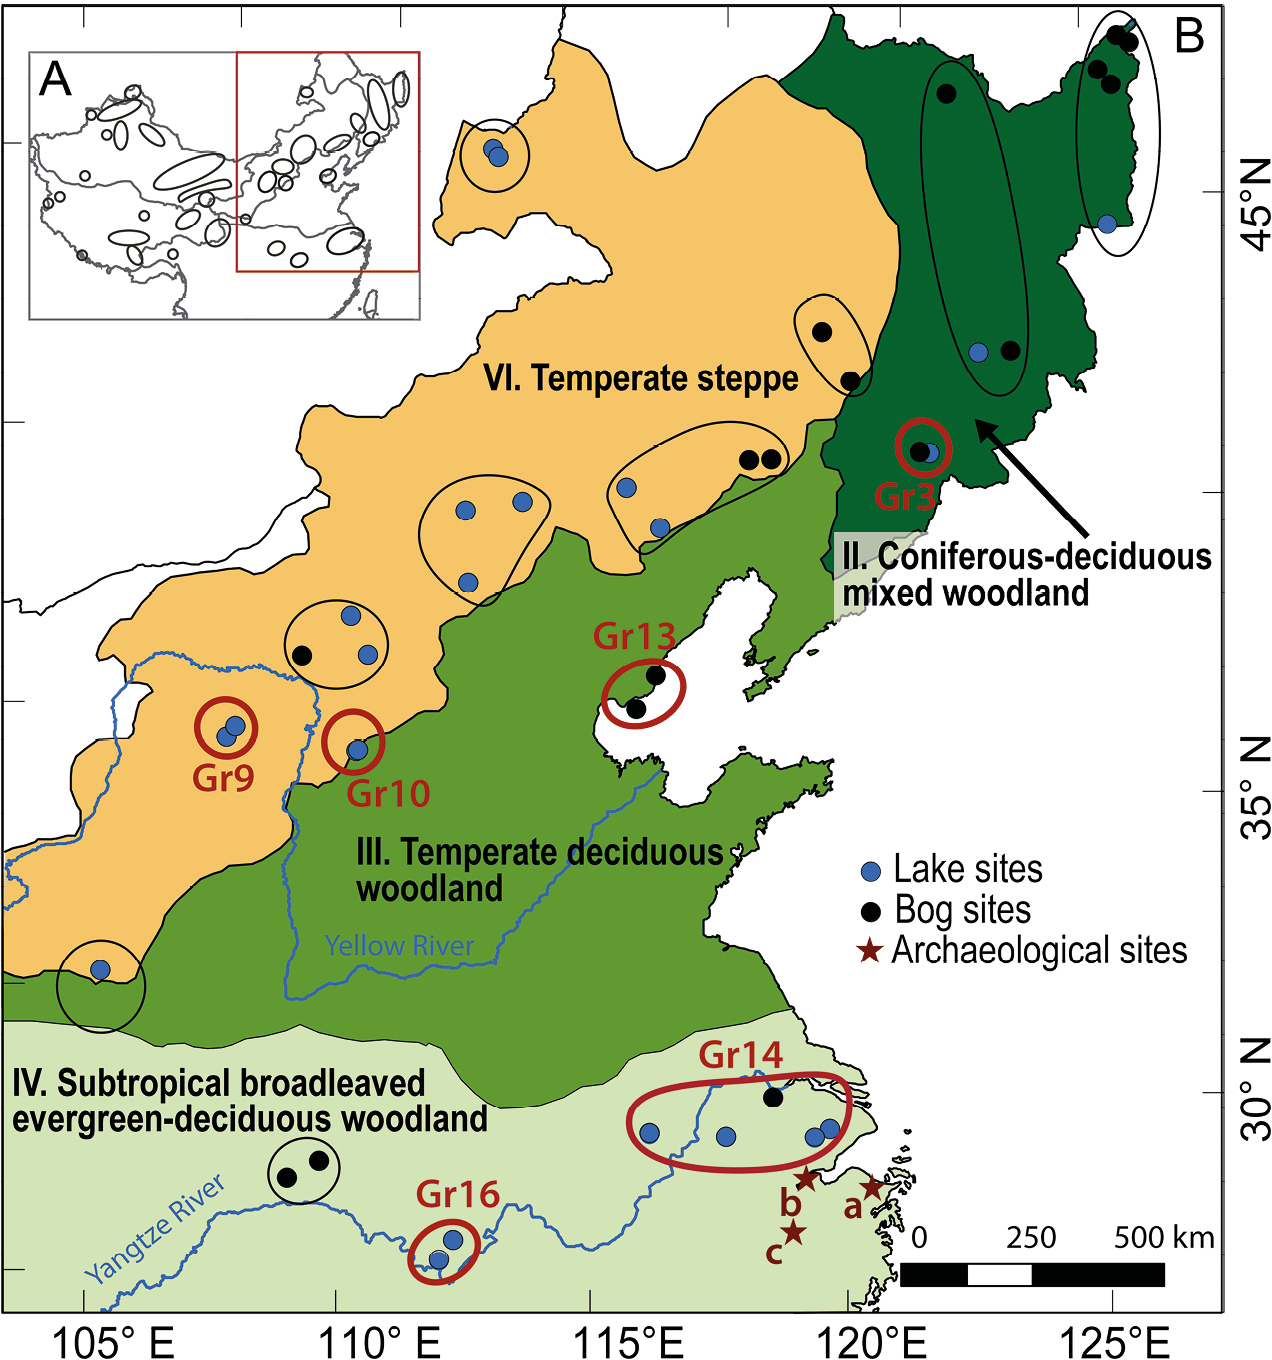
Figure 1: (A) Location of the study region. (B) Location of the site groups used for the pollen-based REVEALS reconstructions presented in this paper (dark red circles). Black circles indicate the additional site groups used in the full study by Li (2016). Dark red stars: location of the archaeological sites mentioned in the text: (a) Hemudu/Tianluoshan; (b) Liangzhu; (c) Shangshan. |
We present here examples of pollen-based REVEALS (Sugita 2007) reconstructions of past regional plant cover in Eastern China (Fig. 1) to demonstrate the potential of such reconstructions to (i) answer questions on past land-use and related land-cover change, and (ii) produce more realistic reconstructions of past anthropogenic land-cover change that can be used in the study of climate-land-use interactions in the past. For instance, the scenarios of past anthropogenic land-cover change commonly used by climate modelers (Klein Goldewijk et al. 2011) were shown to diverge significantly from other ALCC scenarios for several periods of the Holocene and regions of the globe, among other for Eastern China (Gaillard et al. 2010). China is one of the key regions of the globe where agricultural civilizations already flourished from ca. 7 ka BP and therefore plays an important role in land use-climate interactions over the Holocene. Pollen-based quantitative reconstructions of past land cover can be used to evaluate ALCCs (e.g. Kaplan et al. 2017). The REVEALS reconstructions presented here are part of a larger study within the PAGES’ LandCover6k working group, covering temperate and northernmost subtropical China (Li 2016), and will be used to evaluate the existing ALCC scenarios in China.
Li (2016) uses the REVEALS model to estimate past regional plant cover from fossil pollen data with a standardized dataset of relative pollen productivity estimates (RPPs). Li (2016) groups several pollen records from the same region (e.g. site group 3, 9, etc. in Fig. 2) following the strategy adopted for Europe (Trondman et al. 2015) to increase the reliability of the REVEALS estimates. The time windows follow the standard scheme of the LandCover6k project, i.e. modern (age of the peat or lake-sediment sequence’s top) to 0.1 ka BP, 0.1-0.35, 0.35-0.7 ka BP, and continuous 500-year intervals from 0.7 to 11.7 ka BP. REVEALS estimates were calculated for the 31 taxa for which RPPs are available. Some plant taxa were then grouped into plant functional types (PFTs; Fig. 2), i.e. “temperate deciduous trees” (e.g. oak, ash, elm, linden) and “subtropical evergreen trees” (e.g. chinquapin, ring-cupped oak), and “other herbs and cultivated trees”. PFT is a concept adopted by ecologists to represent broad groupings of plant species that share similar life forms and physiological mechanisms. In that sense, “other herbs and cultivated trees” is not exactly a PFT, but it rather groups all pollen types/plants that might have been part of human-modified vegetation due to agriculture. One of the dominant pollen types in this group is Artemisia (genus including up to 400 species in the world with diverse names such as mugwort, sagewort, wormwood, etc.). Chestnut and walnut are also included in “other herbs and cultivated trees” as species of both genera have long been cultivated in Eastern China, but walnut also grows in the temperate-deciduous woodland zone. The sedge family is included in the reconstruction, although plants from this family often grow locally at the study sites, which might be the case in site groups 9, 13 and 14.
 |
|
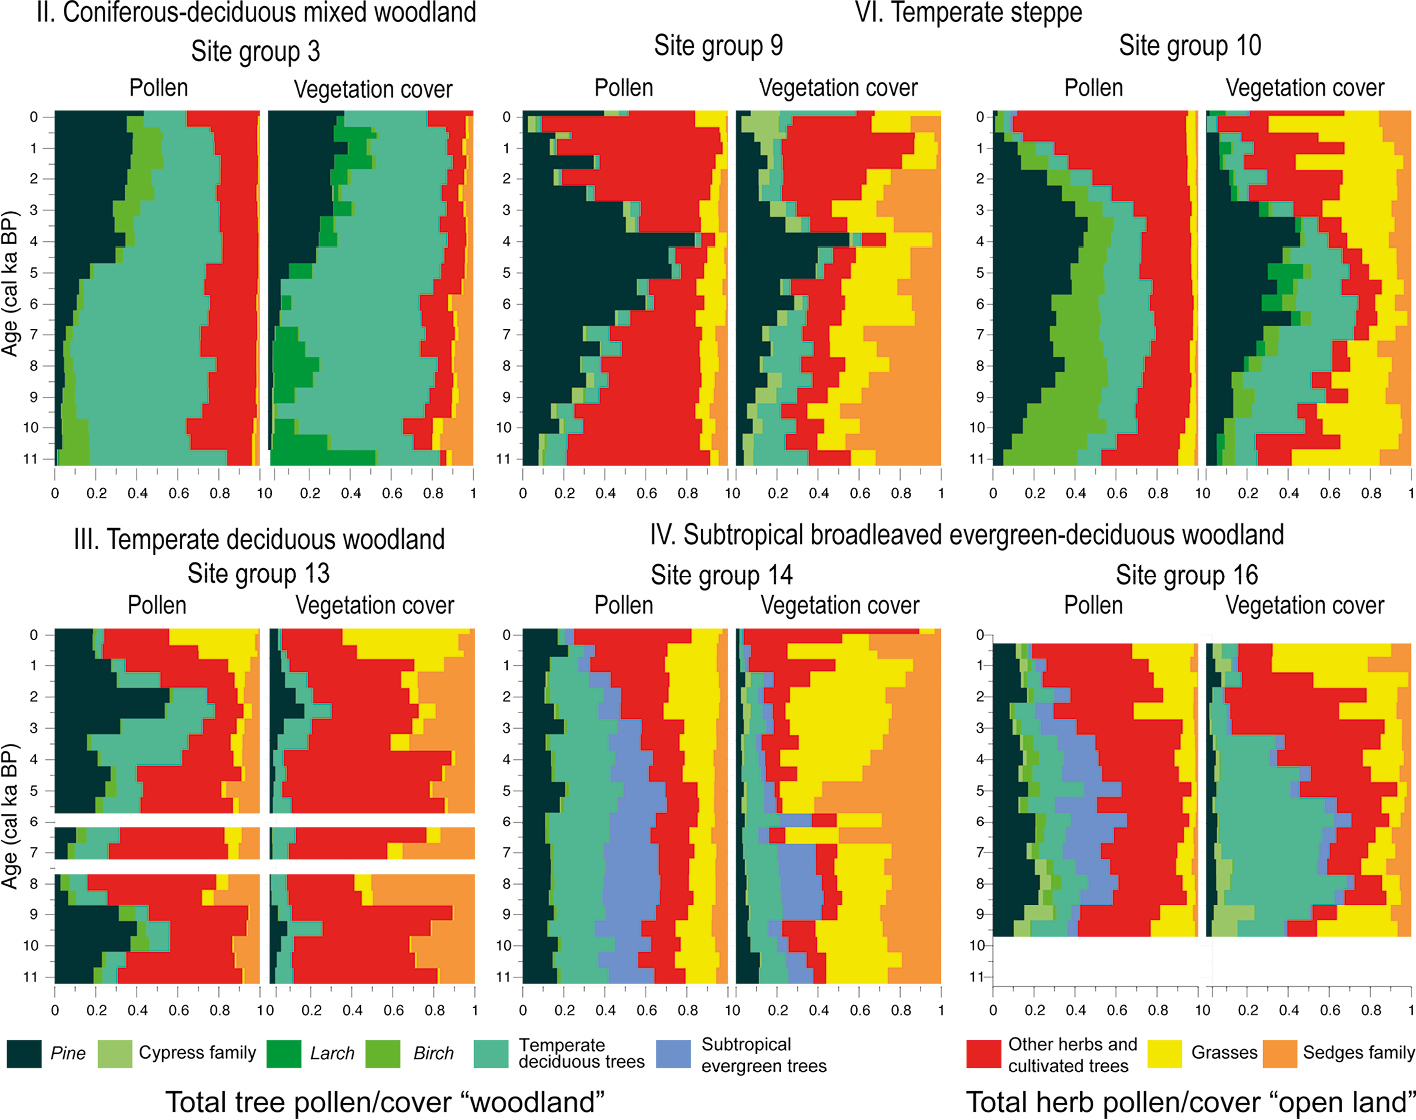
Figure 2: Comparison of pollen (left panel in each group of diagrams) with REVEALS estimates of plant cover, i.e. “vegetation cover” (right panel in each group of diagrams) in proportion for six site groups. “Temperate deciduous trees”: ash, oak, linden, elm, rose family; “evergreen subtropical trees”: chinquapin, ring-cupped oak, oleaster family, coffee family; “other herbs and cultivated trees”: Artemisia (mugwort, sagewort, wormwood, etc.), hemp (Cannabis)/hop, buttercup family, aster/composite family, mustard family, pink family, amaranth/goosefoot families, morning glory family, legume family, mint family, lily family, knotweed/buckwheat family, chestnut tree and walnut tree. |
Similar to Europe, herbaceous vegetation is strongly underrepresented in pollen percentages, and pine (Pinus) and birch (Betula) are overrepresented when compared with broad-leaved trees (Fig. 2). One taxon among herbs, Artemisia (see above), is strongly overrepresented by pollen. Therefore, in the cases where Artemisia is dominant in “other herbs and cultivated trees”, the REVEALS estimated cover of total herbs or “open land” is lower than the pollen percentages, especially in site groups 3, 9 and 10 (Fig. 2).
Do decreases in total tree cover reflect anthropogenic land-use change?
Open land is not necessarily due to human activities and changes in its cover do not need to be human-induced. There are ways to estimate the percentage of variation in pollen assemblages explained by, for example, climate versus human activities (Marquer et al. 2017), but these methods cannot extract the proportion of human-induced deforestation. Other lines of evidence such as archaeological and historical data syntheses are required to cross-check the interpretation of pollen-based land-cover change.
There is little change in wooded land cover over the Holocene in the southern part of the coniferous-deciduous mixed forest (II: site group 3). It suggests that human impact on the regional vegetation cover was weak except during the last 500 years, which the low number of archaeological evidence from this region also suggests. In the southern part of the temperate steppe zone (VI: site groups 9, 10), the total herb cover or “open land” (Fig. 2) increases at the expense of “woodland” from 6 ka (site group 10) and 4 ka BP (site group 9). Numerous archaeological sites in this region indicate widespread human activity during the Mid Holocene (Hosner et al. 2016), and foxtail millet and broomcorn millet remains suggest that domestication of crops started ca. 7.5 ka BP (Zhao 2014). The distinct increase in open land cover from ca. 6 ka BP can therefore be assigned to large anthropogenic deforestation, with losses of ca. 40% (site group 9) to ca. 70% (site group 10) woodland cover between 6 ka BP and recent time (1500-1800 CE), and ca. 30% (site group 10) to ca. 40% (site group 9) between 4 and 2.5 ka BP. The distinct decrease in total tree cover or “woodland” from ca. 2 ka BP in the coastal area of the temperate-deciduous woodland zone (III: site group 13) probably relates to the first peak in population numbers at the beginning of the Han dynasty, 2.2-1.98 ka BP (Twitchett and Loewe 1995).
In the northern part of the subtropical broadleaved evergreen and deciduous woodland zone (IV: site groups 14, 16), a clear increase in open land occurs from 6.5 and 7.5 ka BP in site groups 14 and 16, respectively. The reconstruction from site group 14 (5 sites) is problematic for the time period 7-5.5 ka BP due to differences in timing of land-cover change between the sites or, more likely, problems of chronology for one or several sites. It is not possible, therefore, to date with certainty the age of the first loss in woodland cover (ca. 20-25%) in the area from this reconstruction. The earliest date would be between ca. 7 and 6.5 ka BP and the younger date between ca. 6 and 5.5 ka BP. A woodland-cover loss of ca. 15% occurred between ca. 1.5 and 1 ka BP. The reconstruction from site group 16 shows a woodland-cover loss of ca. 35% between 6 and 4 ka BP and ca. 30% between 3.5 and 3 ka BP. Pollen, charcoal and phytolith evidence at three archaeological sites in the lower Yangtze River region (Fig. 1) suggest that human influence started around 7 ka BP, substantial human impacts occurred at 4.7 ka BP, and widespread human activities expanded around 2.8-2.2 ka BP (Atahan et al. 2008). Site group 14 is located close to the archaeological sites Shangshan (dated to ca. 10 ka BP), Hemudu/Tianluoshan (7.5-6 ka BP), and Liangzhu (5.2-4.3 ka BP) (Fig. 1). Evidences from the Shangshan site suggest the use of rice by humans, but whether it is domesticated or wild rice is not clear. Evidences from the Hemudu and Tianluoshan sites indicate a transition process from domestication ca. 7.5 ka BP to cultivation ca. 6 ka BP, while the findings at the Liangzhu site suggest a rapid development of rice agriculture around ca. 5 ka BP (Zhao 2010). The latter supports the pollen-based evidence of a significant early deforestation from ca. 6 ka BP (possibly earlier but not older than ca. 7 ka BP) and a subsequent increase of woodland loss over the Mid- and Late-Holocene (from ca. 6-5.5 ka BP).
The examples above demonstrate the potential of pollen-based REVEALS reconstructions of past plant cover in conjunction with archaeological and historical data to quantify woodland loss due to deforestation over the Holocene. These reconstructions show good agreement with syntheses of archaeological studies indicating that humans transformed the landscapes of central-eastern temperate and northern China since ca. 7 ka BP, with substantial increases of the number of archaeological sites recorded after ca. 7 ka BP and between ca. 4.5 and 3 ka BP (e.g. Wagner et al. 2013; Wagner and Tarasov 2014). The REVEALS reconstructions also suggest that the HYDE 3.1 scenarios of Holocene anthropogenic land-cover change (Klein Goldewijk et al. 2011) commonly used in climate modeling strongly underestimate the degree of past anthropogenic deforestation in eastern temperate and northern subtropical China.
affiliations
1Department of Biology and Environmental Science, Linnaeus University, Kalmar, Sweden
2Alfred Wegener Institute Helmholtz Center for Polar and Marine Research, Research Unit Potsdam, Germany
3School of Geographic and Oceanographic Sciences, Nanjing University, China
4Institute of Ecology, University of Tallinn, Estonia
5Institute of Geological Sciences, Free University of Berlin, Germany
6Eurasia Department, German Archaeological Institute, Berlin, Germany
7Institute of Nihewan Archaeology, Hebei Normal University, Shijiazhuang, China
8Institute of Tibet Plateau Research, Chinese Academy of Science, Beijing, China
9University of Chinese Academy of Sciences, Beijing, China
contact
Furong Li: furong.lilnu.se
references
Atahan P et al. (2008) Quat Sci Rev 27: 556-570
Gaillard M-J et al. (2010) Clim Past 6: 483-499
Hosner D et al. (2016) Holocene 26: 1576-1593
Kaplan JO et al. (2017) Land 6: 91
Klein Goldewijk K et al. (2011) Glob Ecol Biogeogr 20: 73-86
Li F (2016) Linnaeus University Dissertations, Linnaeus University Press, 271/2016, 67 pp
Marquer L et al. (2017) Quat Sci Rev 171: 20-37
Sugita S (2007) Holocene 17: 229-241
Trondman A-K et al. (2015) Glob Change Bio 21: 676-697
Wagner M et al. (2013) Quat Int 290/291: 344-357
Jan Kolář1,2, M. Macek3,4 and P. Szabó1
Estimation of past population dynamics on a regional scale over thousands of years is a difficult research task. We offer insights based on spatio-temporal modeling and discuss the significance of the archaeological evidence for population and land-use reconstructions.
The size and density of populations are among the most significant factors influencing the character of human-environment interactions, and, in combination with information on subsistence strategies, enable researchers to create a better picture of past land use. However, quantifying or estimating population size and density for the distant past is a challenging task.
Continental-to-global-scale land-use reconstructions based on archaeological data are important because historical land use affected land cover which, in turn, influenced global and regional climate (e.g. de Noblet-Ducoudré et al. 2012; Pongratz et al. 2010; see Editorial, this issue). However, the importance of large-scale archaeological data for paleoscience became widely recognized only recently (e.g. Ellis 2015; Gaillard et al. 2015).
Character of archaeological evidence and population estimates
Archaeology differs from many paleosciences with respect to the nature of the data it can provide. Archaeologists usually focus on a few sites or specialize in one period, a few specific types of artifacts or methods of analysis. Thus, producing a chronologically long and continuous perspective on population or settlement dynamics presents an unusually complex task.
Several approaches have been used to produce population estimates based on information from archaeological data. One can work with absolute or relative assessments of past populations (Müller 2013). Absolute population estimates usually provide densities (persons per km2) and are related to environmental factors, such as carrying capacity, and ethnographical or archaeological data. Relative population estimates rely on the assumption that the amount of archaeological evidence directly reflects population size and density, although the values are not translated into absolute values. The prevalent technique to produce relative population estimates is the use of summed radiocarbon probability distributions, which are based on radiocarbon dates of bones, wood or seeds from archaeological contexts (e.g. Bevan et al. 2017; Shennan et al. 2013; Timpson et al. 2014). Although the method is criticized for a diverse range of biases (e.g. financial situation of countries and national research funding agencies allowing for more analyses, research traditions and interests, past mobility and subsistence strategies; see Torfing 2015), it seems capable of providing valuable insights into the long-term history of human activities over large regions. The most important advantage of this approach is that it overcomes the common archaeological focus on specific sites or periods and produces quantified spatio-temporal models easily comparable with paleoenvironmental proxies that may cover thousands of years and large areas (Bevan et al. 2017).
Human activities and land use in the Holocene
The Czech Republic currently does not have sufficient numbers of radiocarbon dates to use these as the primary estimators of past population, but databases of archaeological sites and excavations are available for the entire area (Kolář et al. 2016a; Kuna et al. 2015). The data in these databases cover most of human history and can be used to model past human activities in both space and time.
Understanding the drivers behind and effects of past population dynamics is of high importance. This can be done only by producing archaeological results which are easily comparable with climatic or paleoecological proxies. Our region of interest is Moravia (the eastern part of Czech Republic), from which we collected data on all available archaeological sites and finds dated between 10,000 BCE and 1250 CE.
We analyzed archaeological evidence from 1685 modern civil parishes (basic administrative units), which contain records on 18,736 archaeological components characterized according to basic function (settlement, burial site, hillfort, traces, etc.). Spatial precision differs for all components (precisely located components vs. finds located only to the parish); we thus used the parish as the common spatial denominator. Temporal precision of the archaeological dating also varies. Some components have imprecise dates (“Neolithic-Eneolithic”: 5400 BC-2000 BC for most non-diagnostic polished stone artifacts) while others have been dated to the nearest decade.
 |
|
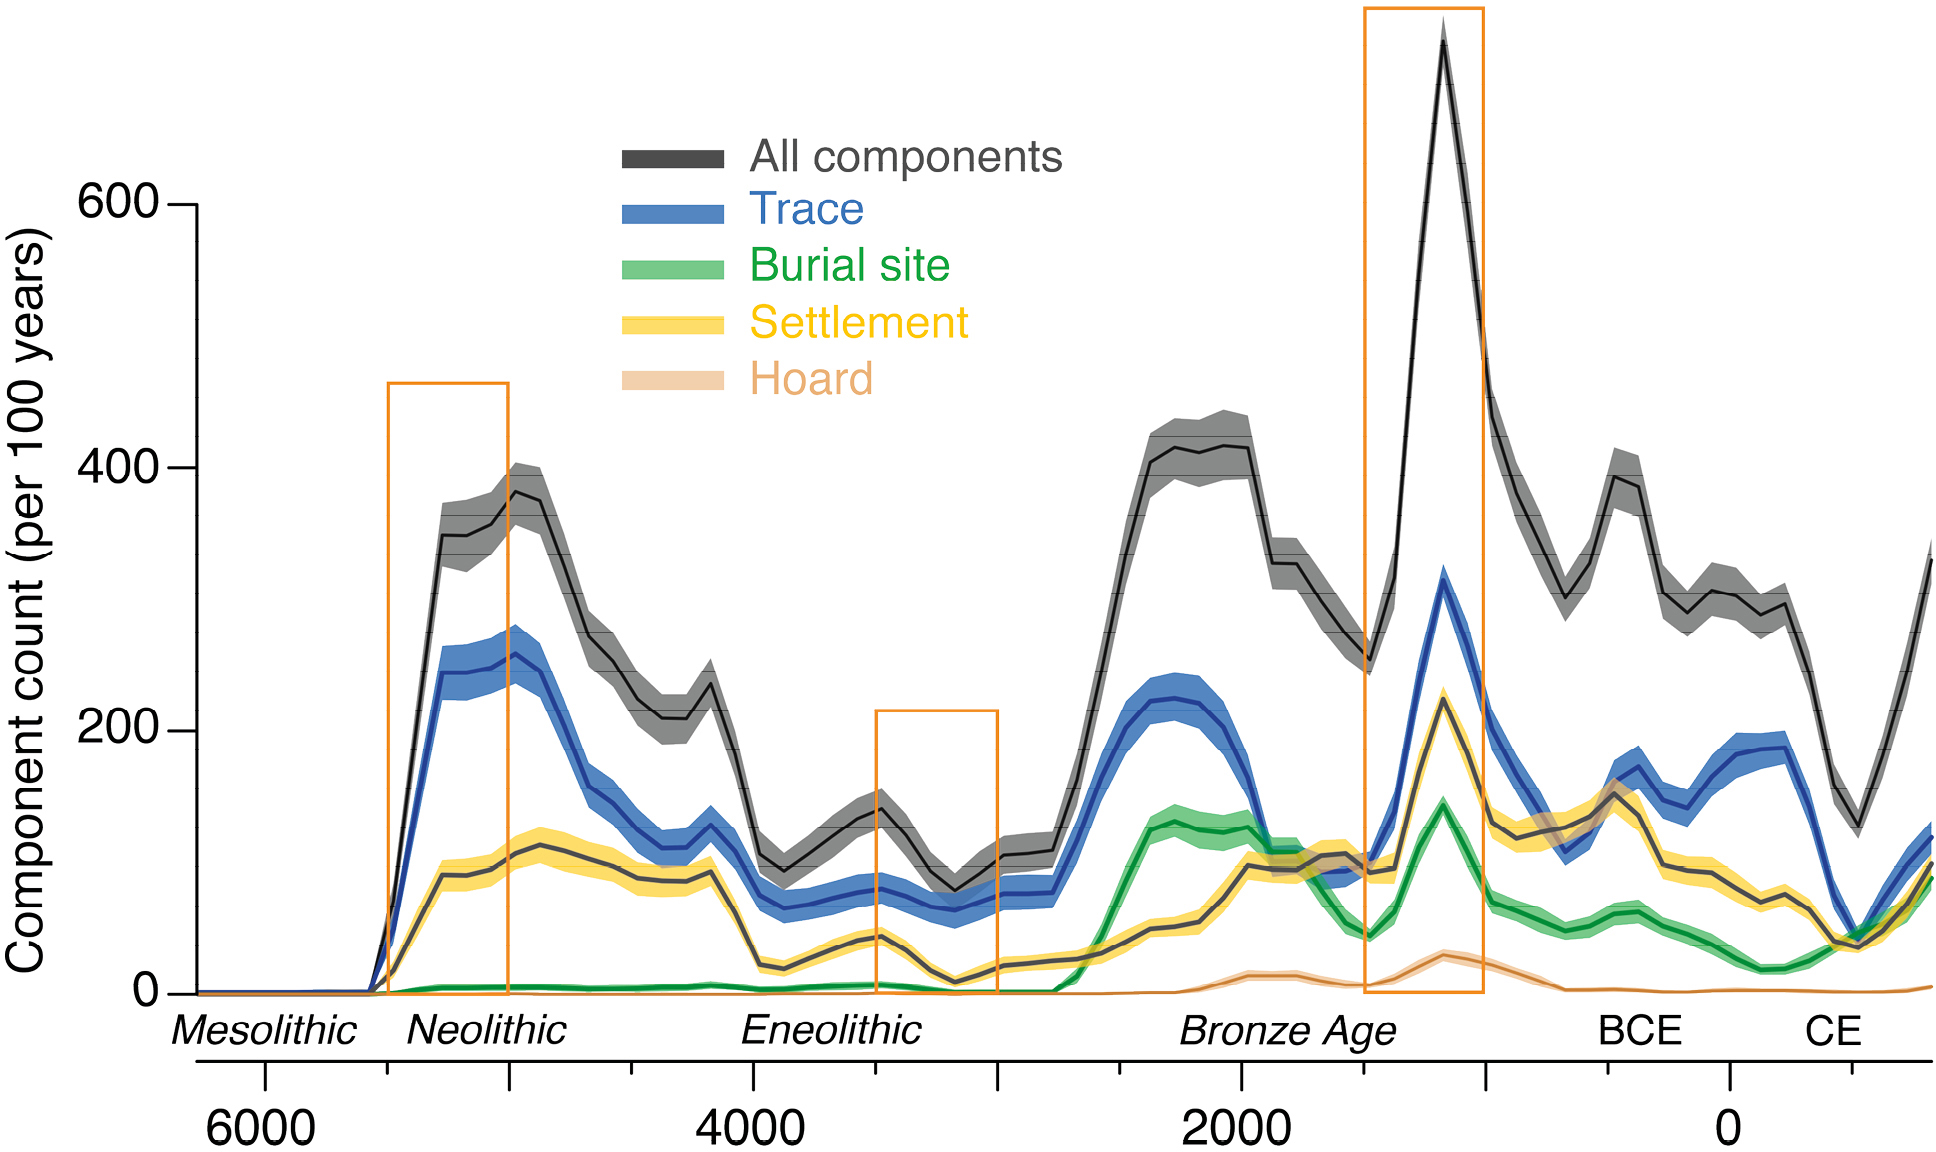
Figure 1: Human-activity model for Moravia (26,804 km2; Czech Republic) based on Monte Carlo simulations, classified according to the origin of activity. |
Adopting the relative approach to understand population dynamics in time, we used several modeling procedures (for details, see Kolář et al. 2016b). Monte Carlo simulations helped us to quantify the uncertainty in the temporal density of components. One thousand potential time series were simulated, where every archaeological component was assigned to a random single year from within its time span. We created a cumulative plot of these simulation runs for each dated component (Fig. 1). In Figure 1, the thickness of the data category envelopes indicates the temporal uncertainty for each category.
We see a rapid increase of archaeological evidence at the beginning of the Neolithic, which was connected with a change in lifestyle and the adoption of agriculture and animal herding. The subsequent period shows a decrease in evidence, which ends during the transition to the Bronze Age. This long-term quantified model of human activities can be readily compared to paleoecological and climatic models, as we showed in Kolář et al. (in press).
 |
|
Figure 2: Spatial patterns of human activities in Moravia in specific time blocks of Neolithic (5500-5000 BCE), Eneolithic (3500-3000 BCE) and Later Bronze Age (1500-1000 BCE). |
The spatial modeling of past human activities is based on parish occupancy likelihood, which is calculated as the proportion of simulation runs in which a parish was considered occupied (for details see Kolář et al. 2016b). These values were later interpolated with the natural neighbor method in a geographic information system (GIS). Land use comprising cereal cultivation and animal herding covered a much larger extent at the beginning of the Neolithic, around 5500 BCE, than centuries later during the Central European Eneolithic (3500-3000 BCE; Fig. 2). Later in the Bronze Age, especially after 1500 BCE, human activities became much more intense, and human communities settled in most of the available lowlands.
What can archaeology offer?
Population estimates and land-use reconstructions based on archaeological data at a global level depend on the existence of specialized databases of radiocarbon dates or sites. The quality of available datasets varies regionally. The observed dynamics in archaeologically detected human activities most probably reflect population dynamics in general, but possible sources of bias must be acknowledged and addressed. The most significant qualitative and quantitative transformations of anthropogenic remains are caused by pre- and post-depositional taphonomic processes. The way people built their dwellings or buried their dead, the scale of erosion, and intensity of surveys and excavations all have an impact on available datasets. As such, we need to exercise caution in our use of these reconstructions. However, these diverse existing datasets and regional models, including knowledge about past existing social organization and farming technologies, can be incorporated into the assessment of past land use and population dynamics on a global level, enabling the study of relationships between environmental changes and social aspects of past populations.
acknowledgements
This work was supported as a long-term research development project no. RVO 67985939 and by a grant of the Fulbright Commission.
affiliations
1Department of Vegetation Ecology, Institute of Botany of the Czech Academy of Sciences, Brno, Czech Republic
2Institute of Archaeology and Museology, Masaryk University, Brno, Czech Republic
3Department of GIS and Remote Sensing, Institute of Botany of the Czech Academy of Sciences, Průhonice, Czech Republic
4Department of Botany, Charles University, Prague, Czech Republic
contact
Jan Kolář: jan.kolaribot.cas.cz
references
Bevan A et al. (2017) PNAS 114: E10524-E10531
de Noblet-Ducoudré N et al. (2012) J Climate 25: 3261-3281
Gaillard M-J, LandCover6k Interim Steering Group members (2015) PAGES Mag 23: 38-39
Kolář J et al. (2016a) Archaol Korresp 46: 539-554
Kolář J et al. (2016b) Archaeometry 58: 513-528
Kolář J et al. (in press) Archaeol Anthrop Sci
Pongratz J et al. (2010) Geophys Res Lett 37: L08702
Shennan S et al. (2013) Nat Commun 4: 2486
Marc Vander Linden1 and Fabio Silva2,3
We review modeling approaches and meta-analyses of the archaeology on the introduction of domesticated plants and animals across Europe. Variation in the rates of diffusion, human demography and farming systems suggest complex patterns of land-use and land-cover changes.
The European Early Neolithic is defined by the introduction and subsequent diffusion across Europe of numerous plants and animals originally domesticated in the Levant. We offer here an overview of the archaeological literature focusing on (1) measures of the rate of spread; (2) the demographic background; and (3) the variability of early farming systems. The research strategy benefiting from these various literature reviews aims to, first, analyze large-scale datasets (i.e. meta-analysis) to detect patterns in the archaeological record, and, second, identify the variables responsible for these regularities using models. Particular attention is paid to the interplay between climatic, environmental and human factors.
A question of time, not speed
 |
|
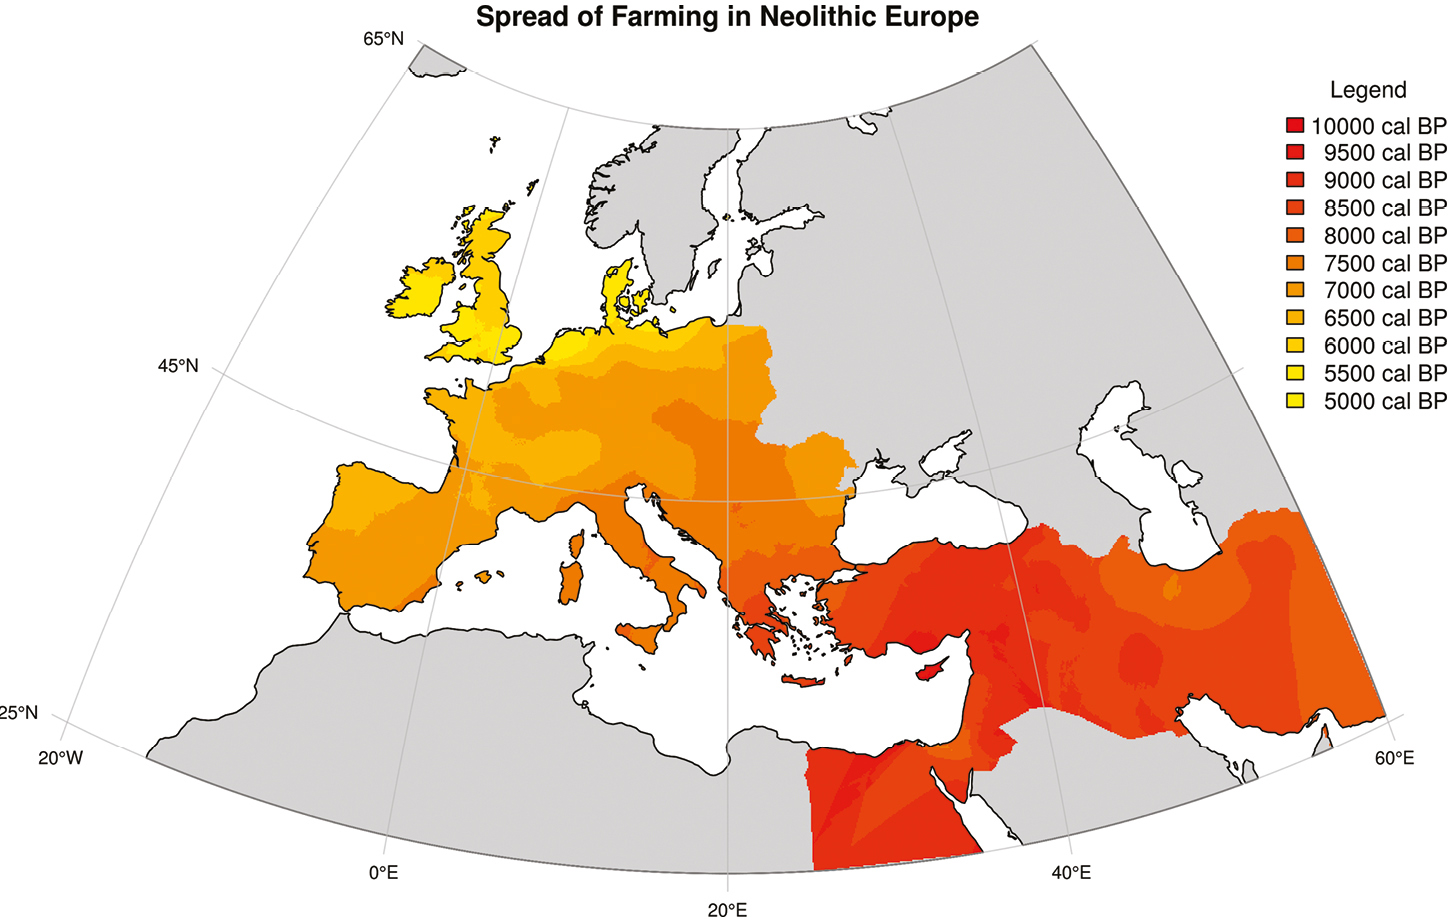
Figure 1: Geostatistical interpolation of radiocarbon dates related to the spread of early farming across the Near East and Europe. Note that the interpolation for Egypt in solely based on a few dates from the Sinai, and therefore should be considered with care for the rest of the region. |
Seminal work by Ammerman and Cavalli-Sforza (1971) showed a correlation between the local date of introduction of farming across Europe, and the distance from the source of domesticates i.e. older sites in the Near East and gradually younger ones as the spread proceeded through Europe. They also calculated that this progression operated at a mean rate of 1.08 km per year, explained through a model of demic diffusion, wherein the next generation of farmers would move, on average, 25 km away from their birthplace. Ancient DNA studies have recently confirmed that the introduction of domesticates is indeed linked to the dispersal of a new human population, with a limited contribution of the last local foraging communities, though the picture changes regionally (Lazaridis et al. 2016). Several papers have since adjusted Ammerman and Cavalli-Sforza's original estimate, but also pointed to regional variation in this movement estimation. For instance, Bocquet-Appel et al. (2009) showed that, while an average rate of 1.09 km per year can be calculated, it masks considerable variation, concluding that the spread of early farming across Europe was a discontinuous process, with successive episodes of expansion and stasis. Figure 1 illustrates this spatio-temporal structure: early domesticates reached Greece by ca. 8600 ka BP. After a standstill of a few centuries, the spread of early farming occurred along two axes across Europe, firstly along the northern Mediterranean coast and reaching the Iberian Peninsula by the mid 7th millennium before present (7.5 ka BP), and, secondly, along the Rhine-Danube corridor up to the Paris basin by the early 7th millennium before present (7 ka BP). After a long standstill in central and parts of continental NW Europe, the spread resumed once again by the early 6th millennium before present (6 ka BP), when the expansion happened into southern Scandinavia, Britain and Ireland.
Several factors affect these rates of dispersal. For instance, rapid extreme climatic episodes linked to the 8.2 ka BP “cold event” shaped the spread of farming in the southern Balkans (Krauss et al., in press), and Warden et al. (2017) have argued for a relationship between climatic amelioration and the introduction of farming in southern Scandinavia. Another approach lies in comparing radiocarbon dates to computational simulations of the diffusion process and associated parameters, especially the mean spatial dispersal rate, and population growth rate. Such recent models incorporate important geographic features such as river valleys and coastlines and include the acceleration of the spread along them. These models also take into account the “slowing down” of dispersal related to high elevations and latitudes. The resulting simulations are shown to better match empirical data than simulations from earlier models (Silva and Steele 2014).
Agriculture and demography
The introduction of early farming in Europe is related to the inception of a new human population, and recent work points to the complex demographic history of Neolithic Europe. Fluctuations in population density have been inferred through statistical analyses of radiocarbon dates, assuming that the extent of past populations and their activities is reflected in the number of samples dated by archaeologists. Shennan et al. (2013) identified an apparent recurrent pattern of “boom-bust” (increases and decreases of the number of radiocarbon dates) in several regions of western Europe. The local introduction of farming corresponds to a rise in the radiocarbon record linked to demographic growth assumed from the introduction of farming; it is followed by a decline in the density of radiocarbon dates interpreted as a depletion of the population. In Britain and Ireland, fluctuations in the radiocarbon record match changes in vegetation cover, where the “boom” is related to deforestation, and the “bust” to woodland regeneration. This sequence occurs during worsening climatic conditions, and is associated with transformations in agricultural regimes, though the precise interplay between all factors is complex (Whitehouse et al. 2014; Woodbridge et al. 2014). It must be stressed that the identification, characterization and interpretation of these fluctuations remain debated. For instance, Silva and Vander Linden (2017) observed that the “bust” in one area sometimes matched the “boom” in the adjacent region during the spread, suggesting that the demographic depletion may also partly correspond to the outgoing migration of a fraction of the local population.
Describing farming variability
 |
|
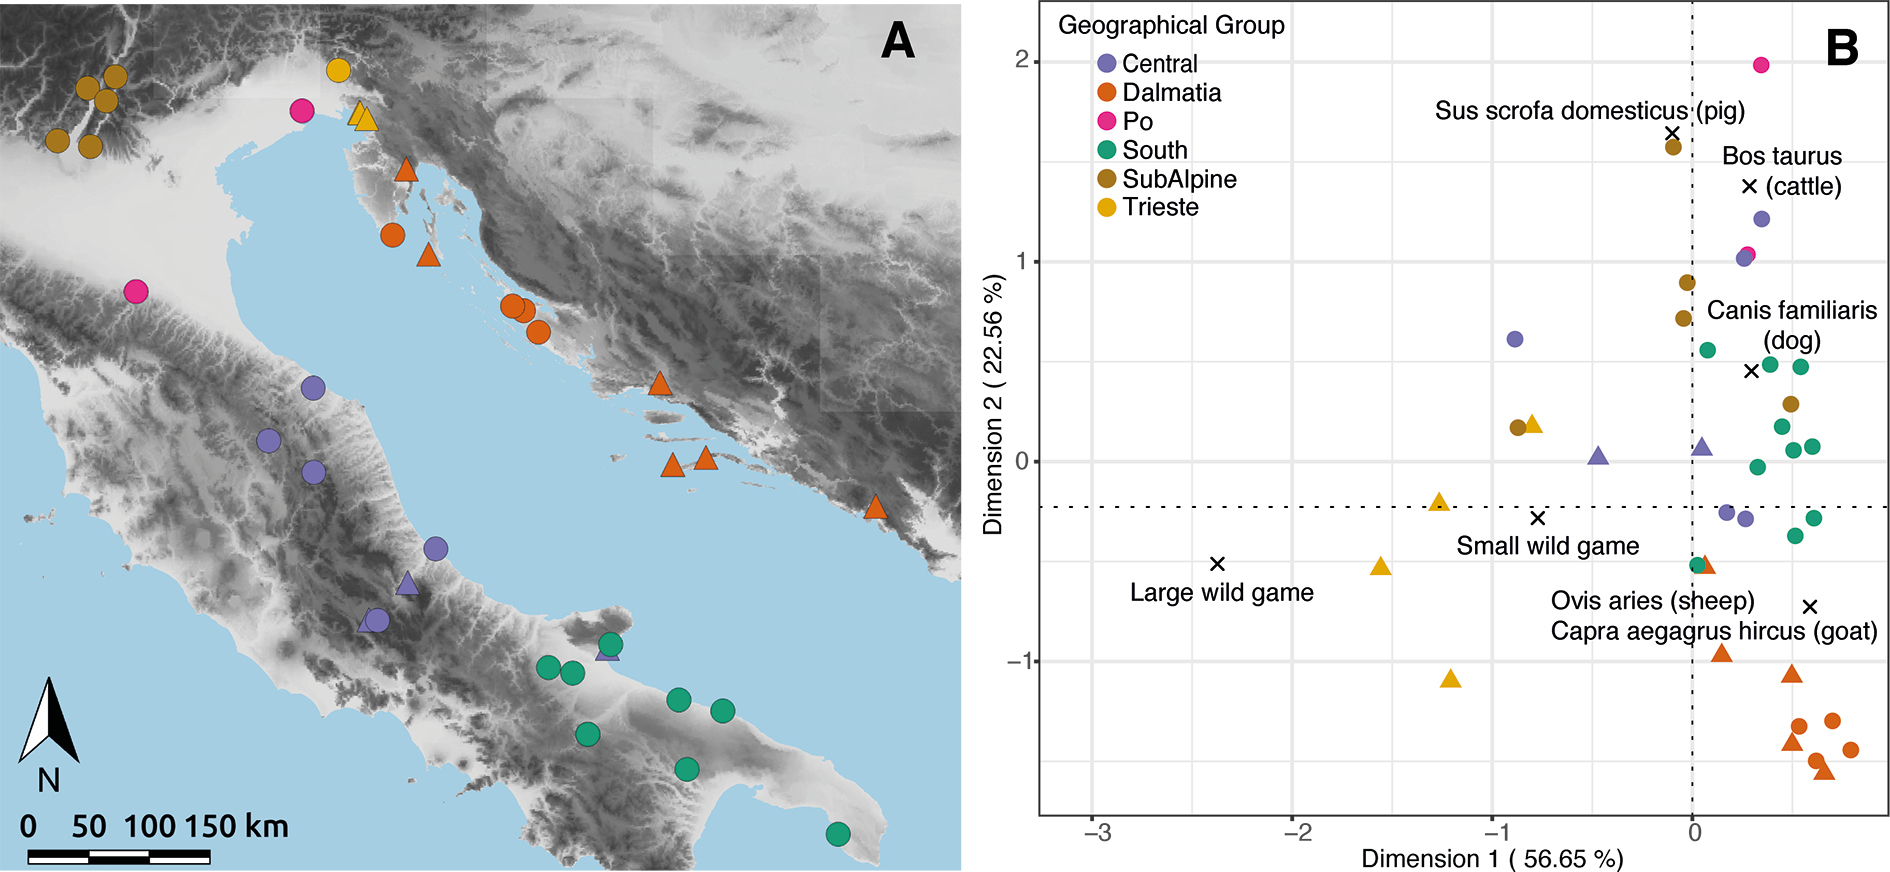
Figure 2: (A) Map of the earliest regional Neolithic zooarchaeological assemblages in the Adriatic basin. (B) Correspondence analysis for the sites on the map (circle: open air site; triangle: cave site). |
Less attention has been paid to land-use patterning in archaeobotanical and zooarchaeological assemblages, due to limited systematic sampling and reporting. Europe sees the introduction of cattle (Bos taurus), pigs (Sus scrofa domesticus), sheep (Ovis aries) and goats (Capra aegagrus hircus) and early Neolithic zooarchaeological assemblages present extensive variations in their respective proportions. Cattle and pigs dominate in central, northern and northwestern Europe, and sheep/goats in the Mediterranean (Manning et al. 2013). Multi-linear regression suggests that environmental factors account for 23-30% of the variation in domesticated animals and cultural factors for a further 10%, with the rest of the variation being left unexplained, at least at this scale (Manning et al. 2013). Indeed, these broad patterns mask extensive regional diversity. Figure 2 presents a correspondence analysis of the earliest regional Neolithic zooarchaeological assemblages across the Adriatic basin. Neolithic sites in southern Italy and Dalmatia are dominated by sheep and goats. Their dominance gradually decreases in central and northern Adriatic in favor of more water-demanding cattle and pigs, mirroring the gradient in precipitation observed across the Adriatic (Gaastra and Vander Linden, in press).
Existing meta-analyses point to a gradual loss of diversity in plant domesticates, especially as farming spreads from the Balkans into Central Europe during the late 7th to early 6th millennium before present (7-6 ka BP; Colledge et al. 2005). As changes in environmental factors alone cannot account for this pattern, two alternative hypotheses are considered: either this narrower crop package corresponds to a cultural preference by early farmers, or is the outcome of neutral drift, a stochastic process linked to what is being transmitted within a small population undergoing expansion. Competing agent-based models indicate that both hypotheses cannot be rejected, leaving open the interpretation of this pattern observable in archaeobotanical data (Conolly et al. 2008; Pérez-Losada and Fort 2011).
Conclusion
The diffusion of early farming across Europe corresponds to the introduction of several plant and animal domesticates, and of a new human population. This process lasted nearly three millennia and comprised cycles of expansion and stasis. Meta-analyses of archaeobotanical and zooarchaeological records demonstrate large variations in the types of cultivars and domesticates in use, shaped by a combination of environmental, climatic, and human factors, which remain difficult to disentangle. This variety of rates of diffusion, associated demographic signals, and crop-domesticated animal packages suggests likely significant differences in land use across the continent, and associated land-cover changes. Hopefully, future work will address the imbalance between the extensive efforts in analyzing and modeling radiocarbon dates, and the relative scarcity of similar approaches for in-depth analysis of plant and animal remains to improve the understanding of spatial and temporal patterning of animal and crop cultivation practices.
affiliations
1Department of Archaeology, University of Cambridge, UK
2Catalan Institute of Human Paleoecology and Social Evolution, Tarragona, Spain
3Department of Historical Sciences, Rovira i Virgili University, Tarragona, Spain
contact
Marc Vander Linden: mv297cam.ac.uk
references
Ammerman AJ, Cavalli-Sforza L-L (1971) Man NS 6: 674-688
Bocquet-Appel J-P et al. (2009) J Archaeol Sci 36: 807-820
Colledge S et al. (2005) Eur J Archaeol 8: 137-156
Conolly J et al. (2008) J Archaeol Sci 35: 2797-2804
Gaastra J, Vander Linden M (in press) Holocene
Krauss R et al. (in press) Quat Int
Lazaridis I et al. (2016) Nature 536: 419-424
Manning K et al. (2013) Antiquity 87: 1046-1059
Pérez-Losada J, Fort J (2011) J Archaeol Sci 38: 1294-1299
Shennan S et al. (2013) Nat Commun 4: 2486
Silva F, Steele J (2014) J Archaeol Sci 52: 609-620
Silva F, Vander Linden M (2017) Sci Rep 7: 11985
Warden L et al. (2017) Sci Rep 7: 15521