PAGES Magazine articles
Alfredo Martínez-García1 and Gisela Winckler2
We review the hypothesis that the increased supply of iron-bearing dust to high-nutrient, low-chlorophyll regions of the ocean stimulated phytoplankton blooms that sequestered climatically relevant amounts of carbon and contributed to lowering atmospheric CO2 during ice ages.
The concentration of major inorganic nutrients nitrate and phosphate is perennially high in one quarter of the surface ocean. However, despite this excess in macronutrients available for phytoplankton growth, biomass production still remains fairly low in the Southern Ocean, the equatorial Pacific and the subarctic North Pacific.
The causes of the incomplete use of macronutrients by marine organisms and hence of the existence of these high-nutrient, low-chlorophyll (HNLC) regions have been subject to intense oceanographic research in the past decades. In the late eighties John H. Martin and his team reported evidence suggesting that phytoplankton growth in these regions was chronically limited by iron deficiency (Martin and Fitzwater 1988; Martin et al. 1990). Martin immediately realized that one important consequence of this discovery was that changes in the availability of Fe in HNLC regions could have large effects on marine phytoplankton productivity and organic carbon export to the subsurface ocean, and therefore could influence the efficiency of the global biological pump in sequestering atmospheric CO2 (Martin and Fitzwater 1988).
Iron fertilization in the Southern Ocean
 |
|
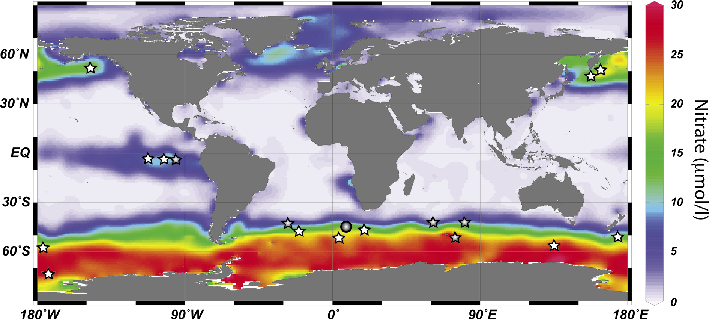
Figure 1: World ocean surface nitrate concentrations from the World Ocean Atlas (Garcia et al. 2010) indicating the three high-nutrient, low-chlorophyll (HNLC) areas (Southern Ocean, equatorial Pacific, Subarctic North Pacific). The gray circle marks the location of ODP Site 1090 and the stars mark locations where iron fertilization experiments (white stars) and iron enrichment experiments (gray stars) have been performed (Blain et al. 2007; Boyd et al. 2007; Smetacek et al. 2012). |
The Southern Ocean is the largest HNLC region (Fig. 1) and represents the area of the ocean where variations in iron availability can have the largest impact on Earth’s carbon cycle through its fertilizing effect on marine ecosystems. In 1984, several years before Martin’s discovery of iron limitation, a series of papers postulated the potential role of the Southern Ocean in driving changes in atmospheric CO2 concentrations during ice ages (Knox and McElroy 1984; Sarmiento and Toggweiler 1984; Siegenthaler and Wenk 1984). Combining these ideas with his discovery of iron limitation in the modern Southern Ocean, and the first observations of increased glacial dust deposition recorded in Antarctic ice cores, Martin proposed that the enhanced supply of Fe from dust could have stimulated marine productivity during ice ages, increasing carbon sequestration in the deep ocean and leading to a decrease in atmospheric CO2 levels (Martin 1990).
Iron enrichment experiments
 |
|
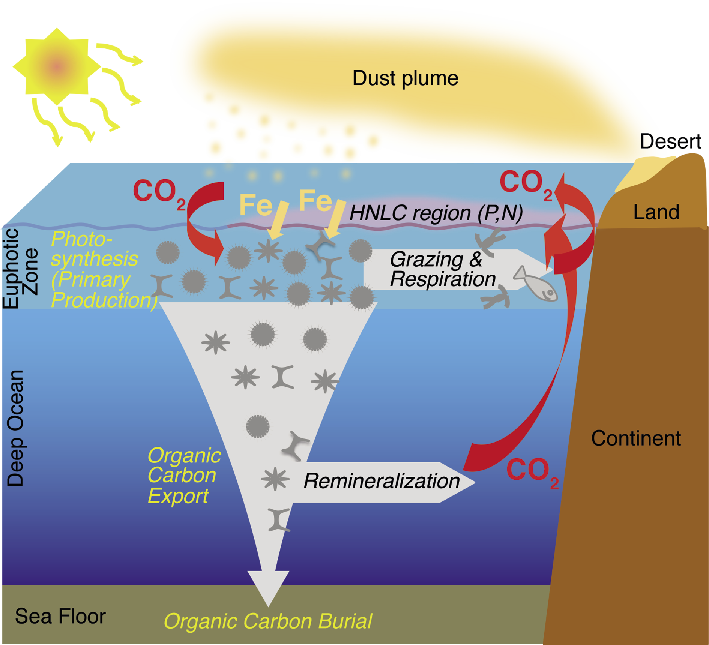
Figure 2: Schematic representation of the iron fertilization process. |
Since the seminal work of Martin, the effect of iron on marine ecosystem structure and productivity has been extensively studied through a series of short-term in situ iron enrichment experiments performed in the different HNLC regions of the ocean, but also by observing phytoplankton blooms induced by natural iron fertilization (Fig. 1).
Artificial iron fertilization experiments have provided unambiguous evidence that iron addition generates phytoplankton blooms in HNLC regions (Boyd et al. 2007; Smetacek et al. 2012). These findings are consistent with the observations of natural phytoplankton blooms in these regions stimulated by Fe input from different sources including continental dust (Cassar et al. 2007), volcanic ash (Hamme et al. 2010), free-drifting icebergs (Smith et al. 2007) and the upwelling of iron-rich deep waters (Blain et al. 2007). However, the efficiency of the iron fertilization process in removing CO2 from the atmosphere ultimately depends on the depth at which sinking organic matter is remineralized. For example, in the Southern Ocean, the fraction of carbon retained within the deep winter mixed layer (upper 200 m) would return to the atmosphere within months, but organic matter sinking to the deep ocean and sediments, could be sequestered for centuries, millennia or longer (Smetacek et al. 2012). Unfortunately, the results of iron fertilization studies in the modern ocean with respect to the efficiency of organic carbon export to the deep ocean are still ambiguous, limiting our understanding of the potential efficiency of large-scale iron fertilization for atmospheric CO2 sequestration.
Paleoceanographic records
Paleoceanographic studies provide an excellent opportunity to directly test the influence of continued large-scale iron fertilization on marine phytoplankton production and downward export of biomass, and its potential effect on atmospheric CO2 levels.
Paleoceanographic reconstructions attempting to test the iron hypothesis have mainly focused on the Southern Ocean. Data indicate a heterogeneous response of Southern Ocean productivity during ice ages, characterized by an increase in productivity in the Subantarctic zone and a decrease in the Antarctic zone (Kohfeld et al. 2005). The decrease in Antarctic zone productivity was first interpreted as a challenge to the iron hypothesis raising doubts about the sensitivity of marine ecosystems to atmospheric iron supply (Mortlock et al. 1991). However, subsequent studies have proposed that the Antarctic Ocean was more strongly stratified during ice ages, reducing major nutrient supply from upwelling waters, and consequently explaining the lower glacial marine productivity in the Antarctic zone of the Southern Ocean (Francois et al. 1997).
In addition, in the Subantarctic zone, which is located downwind of major Southern Hemisphere dust sources, several studies have indeed found a remarkable correlation between iron deposition and marine productivity as predicted by the iron fertilization hypothesis (Kohfeld et al. 2005; Kumar et al. 1995; Martínez-García et al. 2009). The productivity increase occurred consistently in the later part of the glacial cycle, when atmospheric CO2 concentrations were below a threshold of about 225 ppm and dust fluxes peaked (Kohfeld et al. 2005; Martínez-García et al. 2009). In addition, a recent study has shown that in the Subantarctic Atlantic (ODP Site 1090; Fig. 1) the high dust and productivity intervals of the last ice age are also characterized by an increase in the degree of nitrate consumption by marine phytoplancton, a combination that is only consistent with iron fertilization (Martínez-García et al. 2014).
These findings suggest that the iron fertilization process in the Subantarctic Southern Ocean may have been particularly important to explain the last 40 ppmv of the atmospheric CO2 decrease observed during the ice age cycles of the last million of years (e.g. Martínez-García et al. 2011; Martínez-García et al. 2014). In fact, a CO2 drawdown of up to 40 ppmv from Subantarctic iron fertilization is consistent with estimates obtained using geochemical box models and Earth system models, which in most cases range between 20 and 40 ppmv (e.g. Hain et al. 2010; Brovkin et al. 2007). In addition, recent studies suggest that dust flux, productivity and nutrient consumption also increased during the Antarctic millennial-scale cold events that characterize the last ice age (Martínez-García et al. 2014; Anderson et al 2014). These findings indicate that iron fertilization can also contribute to explain the millennial-scale CO2 oscillations associated with these Antarctic cold events.
Although reconstructions of the effect of iron fertilization in the Southern Ocean have, so far, been largely limited to the Atlantic sector of the Southern Ocean, new sediment cores and dust flux reconstructions from the Pacific sector of the Southern Ocean (Lamy et al. 2014) will soon allow the hypothesis to be tested also in the South Pacific, the largest subbasin of the southern Ocean.
Implications for the future
Paleoceanographic data and models suggest that iron fertilization of the Subantarctic zone of the Southern Ocean stimulated marine export production and that this process increased carbon sequestration into the deep ocean, contributing to explain part of the atmospheric CO2 decrease observed during ice age cycles. However, its potential application as a geoengineering strategy to mitigate anthropogenic CO2 emissions is highly controversial, not only due to doubts about the limited efficiency of artificial iron fertilization for long-term atmospheric CO2 sequestration, but also because of the potentially dangerous side-effects of large scale iron addition such as deoxygenation of intermediate waters or changes in phytoplankton community composition that may cause toxic blooms or promote changes further along the marine food chain (e.g. Buesseler et al. 2004; Johnson and Karl 2002).
affiliations
1Geological Institute, ETH Zurich, Switzerland
2Lamont-Doherty Earth Observatory, Columbia University, Palisades, USA and Department of Earth and Environmental Sciences, Columbia University, New York, USA
contact
Alfredo Martínez-García: alfredo.martinez-garcia erdw.ethz.ch
references
Full reference list under: http://pastglobalchanges.org/products/magazine/ref2014_2.pdf
Boyd PW et al. (2007) Science 315: 612-617
Kohfeld KE et al. (2005) Science 308: 74-78
Lamy F et al. (2014) Science 343: 403-407
Daniel R. Muhs1, M.A. Prins2 and B. Machalett3
Loess (aeolian silt) is widespread in Eurasia and the Americas. Paleowind direction and wind strength can be reconstructed from spatial and temporal trends of loess thickness and particle size. Fossil land snails in loess can reveal much about past climate and vegetation.
 |
|
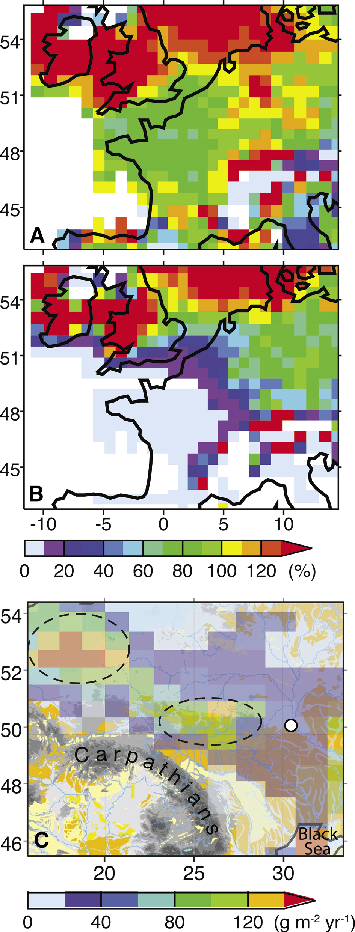
Figure 1: Distribution of loess in (A) Eurasia, (B) North America and (C) South America. Redrawn from Muhs (2013) and Muhs et al. (2014), and sources therein. |
Loess is aeolian sediment that is dominated by silt-sized particles. Unlike either coarser dune sand or finer-grained, long-range-transported dust, loess is relatively poorly sorted, reflecting a combination of transport processes, including saltation, low suspension, and high suspension. Loess can be readily identified in the field; deposits range in thickness from a few centimeters to many tens of meters, and are found over large areas of Eurasia, South and North America (Fig. 1), and smaller areas of New Zealand, Australia, Africa and the Middle East. Loess covers approximately 10% of the Earth’s land surface and is therefore one of the most important terrestrial archives of paleoenvironmental change during the Quaternary. In many regions, loess sections consist of deposits of mostly unaltered sediment with intercalated paleosols. Paleosols represent periods of landscape stability when loess deposition ceased altogether, or at least slowed significantly. Loess can be dated directly using luminescence, radiocarbon, and amino acid geochronology methods.
Paleoclimatic interpretation
Loess property changes yield clues about the prevailing paleowinds during deposition. Thickness, particle size, and carbonate content, in general, decrease away from sources (e.g. Muhs 2013; Muhs et al. 2014). Thus, reduction in sediment load downwind from a source can be inferred from decreases in loess thickness. Paleowind direction and intensity can also be determined from the decrease in mean particle size away from a source, reflecting a winnowing of the coarse load in regions proximal to the dust source. Here we present some recent examples where paleoclimatic conditions in the Quaternary were inferred from loess deposits.
Determining source areas
 |
|
Figure 2: (A) Trends in thickness (upper plot) and abundance of fine silt particles (modal size of ~22 µm; lower plot) shown as a function of distance along a north-south transect in the Loess Plateau region of China, for last-glacial-aged loess (unit L1-1 in the Chinese loess stratigraphic system). Redrawn from data in Prins and Vriend (2007). (B) Stratigraphy of loess deposited during the past two glacial periods and ratio of coarse-plus-medium silt to fine silt (the "U-ratio") at a thick loess section at Remisowka, Kazakhstan. Note that while loess sedimentation occurs at a greatly diminished rate during interglacial or interstadial periods, allowing soil formation, it does not cease completely. Redrawn from data in Machalett et al. (2008). |
A good example of the spatial variability of loess properties that can be used to infer paleowinds comes from the Chinese Loess Plateau region (Fig. 1a). Prins and Vriend (2007) conducted detailed measurements of loess stratigraphy, loess unit thicknesses, and particle size in a transect of loess sections across this region. Their results indicate that loess dating to the last glacial period, ~25-12 ka, referred to as the "L1-1" unit, shows a systematic decrease in thickness and an increase in the abundance of fine silt (modal size of ~22 µm) from north to south (Fig. 2a). This implies that loess source areas during the last glacial period lay to the north of the Chinese Loess Plateau, in the desert basins situated to the north and northwest of the region, which is consistent with various previous findings (see Muhs 2013; Muhs et al. 2014). Northerly or northwesterly paleowinds inferred from these observations indicate longer residence of the Siberian and Mongolian high-pressure systems (dominant in winter today) during the last glacial period and a shorter East Asian and Indian summer monsoon season.
Changes in wind strength
Changes in wind strength over time can be inferred from the particle size spectrum through a loess section. A number of researchers have used the ratio of coarse-to-fine silt as an indicator of wind strength at single sites over time in loess sections of Asia, Europe, and North America. Higher abundances of coarse silt imply stronger winds, which are capable of entraining and transporting coarser particles. Machalett et al. (2008) provide an example from a thick loess section in Kazakhstan, Central Asia (Fig. 2b). Glacial periods are recorded as thick, relatively unaltered sections of loess, whereas interglacial and interstadial periods are recorded as paleosols. The loess of Kazakhstan is, however, an excellent example of the kind of depositional system where aeolian particle transport and deposition do not "turn off" completely during interglacial and interstadial periods. Instead, deposition of the very fine-grained loess particles continued throughout the interglacials, but pedogenesis proceeded at rates greater than the loess sedimentation. The continued loess accumulation implies that loess source areas still existed during interglacial or interstadial periods, but wind strength was too low to transport coarse-silt-sized particles. This variation in wind strength over time is documented by changes in the "U-ratio", a measure of coarse-plus-medium silt to fine silt (Fig. 2b). During the last glacial period (marine isotope stage or MIS 2 and 4) and the penultimate glacial period (MIS 6), high U-ratios indicate strong winds capable of transporting coarse particles, similar to modern winters. Conversely, in interglacial and interstadial periods (MIS 1, 3, and 5) aeolian silt was deposited concurrently with pedogenesis, but was dominated by fine-silt-sized particles, resulting in lower U-ratios. This interglacial pattern is due to weaker winds under a different synoptic-scale atmospheric circulation pattern, much more like that during modern summers.
Land snail fossils
Loess lacks many of the Quaternary paleoecological indicators commonly used in lacustrine or marine sediments, such as pollen, diatoms, ostracodes, radiolaria, or foraminifera. Furthermore, it is rare for mammalian fossils to be preserved in loess, although the deposits in Alaska (USA) and Siberia (Russia) are important exceptions to this generalization. Fortunately, it is common for the shells of land snails to be preserved in-situ in loess, most abundantly in China, Europe, and North America. Most of these snails are extant species, and their modern zoogeography is reasonably well established. Thus, it is possible to infer past climates during the times of loess deposition through the identification of extralimital taxa, i.e. those species that do not currently live in a locality but can be found there as fossils. Many of the land snail shells can be radiocarbon dated (Pigati et al. 2013). In North America, loess deposited during the last glacial period revealed a number of extralimital species of land snail fossils. For example, in the Great Plains region, the upper part of last-glacial loess contains several boreal (extralimital northern) or Cordilleran (western mountain) species of snails that do not live in the region today. The presence of these northern-forest and mountain-forest species implies a much cooler glacial climate with forest vegetation, as opposed to the temperate grassland dominating the region today.
Conclusions
Loess is found over large areas of Europe, Asia, South America, and North America. Loess has the distinct advantages over other Quaternary sediments for documenting climate change in that it provides a direct record of atmospheric circulation. It can be dated directly by luminescence, radiocarbon, and amino acid geochronology methods. The direction and strength of paleowinds can be reconstructed from spatial and temporal trends of loess thickness and particle size. Paleosols are common in loess and represent periods of little or no loess deposition. Fossil land snails that are often well-preserved in loess can provide paleontological information on past climate and vegetation.
acknowledgements
We thank the guest editors for inviting us to contribute this short piece and Margaret Berry, Randy Schumann, and Janet Slate for helpful reviews.
affiliations
1US Geological Survey, Denver, USA
2Faculty of Earth and Life Sciences, VU University Amsterdam, the Netherlands
3Institute of Geography, Humboldt-Universität zu Berlin, Germany and Department of Natural and Applied Sciences, Bentley University, Waltham, USA
contact
Daniel R. Muhs: dmuhsusgs.gov
references
Machalett B et al. (2008) Geochem Geophys Geosys 9, doi:10.1029/2007GC001938
Muhs DR (2013) Treatise Geomorph 11: 149-183
Pigati JS et al. (2013) Quat Sci Rev 76: 114-128
Prins MA, Vriend M (2007) Geochem Geophys Geosys 8, doi:10.1029/2006GC001563
Denis-Didier Rousseau1,2 and Adriana Sima1
The glacial-interglacial and orbital-timescale oscillations imprinted in loess records have been studied for a long time. Researchers have recently started to investigate millennial and sub-millennial variations by means of high-resolution field studies and data analyses combined with modeling experiments.
 |
|
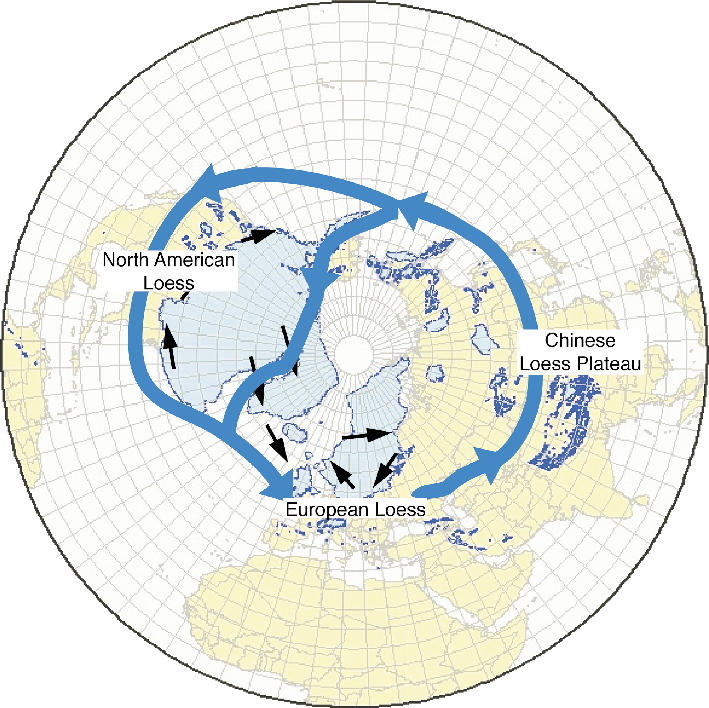
Figure 1: The Northern Hemisphere ice-sheets (in light blue) and glaciers (dark blue dots) at the Last Glacial Maximum (map compiled by Jürgen Ehlers, available at www.qpg.geog.cam.ac.uk/lgmextent.html), the schematic location of the polar jet stream (blue arrows), wind patterns (black arrows) generated by the presence of the ice sheets (Kutzbach 1987), and (labeled) the loess regions discussed in the text. |
The terrestrial sediments known as “loess” represent an important archive of paleoclimatic variability. Mineral material mobilized by wind at the ground surface was transported over distances from a few hundred to thousands of kilometers and deposited back on the ground where it underwent a gradual transformation into loess sediment. The largest loess deposits are found in the Northern Hemisphere, primarily because the continental surface is much larger than in the Southern Hemisphere. Depending on their location on the globe (Fig. 1), the deposits have formed under the influence of different climate factors, and contain more or less detailed records of regional climate change. Here we review the current knowledge about the three main loess regions of the Northern Hemisphere. The many underlying references are provided in an extensive online archive of references, listed by regions.
European loess
An almost continuous loess band stretches, along approximately 50°N, from western Europe to the Dnieper valley in Ukraine. In this band, loess sequences mainly record the North-Atlantic millennial-scale climate changes of the last glaciation (between ca. 110-15 ka BP): the Dansgaard-Oeschger (DO) events and Heinrich stadials (Rousseau et al. 2007, 2011). The DO events correspond in the Northern Hemisphere to abrupt warmings, of about 10°C in Greenland within 50-100 years, and are followed by a more gradual return to cold (stadial) conditions. The Heinrich stadials represent particularly cold climate episodes caused by massive iceberg discharges from the Northern Hemisphere ice sheets known as Heinrich events.
Multidisciplinary loess studies and detailed chronological analyses indicate a strong correlation between these climate variations and European loess sedimentation. In the 50°N European loess band, the alternating warm and cold episodes are clearly imprinted in the stratigraphy as a succession of doublets of paleosol-loess units, in particular during marine isotope stages 3 and 2 (between approx. 60-15 ka BP). The soils were formed during the relatively warm North-Atlantic phases (Greenland interstadials) associated with DO events, when the eolian sedimentation was reduced or even absent. The degree of development of each soil depended on the duration of the corresponding warm episode. The loess units correspond to the cold North-Atlantic phases (Greenland stadials and Heinrich stadials), when the dust cycle was very active and the sedimentation rates were high. Other loess deposits can be found in Europe at lower latitudes, but the millennial climate variations represented by the alternation of paleosols and loess units are absent in the stratigraphy, suggesting drier conditions than in the 50°N loess band.
Recent studies have employed numerical modeling to investigate the mechanistic link between the North-Atlantic millennial climate signal and the loess sedimentation variations in Europe around 50°N (Sima et al. 2009, 2013). These studies focused on variations in dust mobilization, reasonably assuming that the deposition fluxes strongly depended on the emission fluxes. An important aspect of modeling the formation of loess deposits in Europe is to identify the geographical areas that were potentially subject to deflation during glacial times, but are not anymore under present-day climate conditions.
 |
|
Figure 2: (A) Simulated dust emission fluxes for Western Europe for a “Greenland interstadial” (GIS) are relatively close to those for a “Greenland stadial” (GS) when the GIS and GS fluxes are computed without taking the vegetation effect into account (GIS/GS flux ratio between 70-130%); (B) the flux ratio GIS/GS strongly decreases when the vegetation effect of inhibiting eolian erosion is taken into account (modified from Sima et al. 2009). (C) Simulated dust emission fluxes for Eastern Europe for a GIS, superimposed on a topographic map; the most active spots (indicated with dotted lines) have probably been important sources for some Eastern European loess deposits (in yellow, in background), such as those around Stayky (white dot) in NW Ukraine (modified from Sima et al. 2013). |
For Western Europe, data-based studies have shown that the continental shelf that emerged during glacials (when sea-level dropped), especially in the English Channel and the North Sea, used to be a strong dust deflation area. Transported from there by westerly winds, fine material must have reached loess deposits located many hundreds of kilometers away, together with coarser material from nearer sources, such as large river valleys or periglacial outwash plains. Modeling results (Sima et al. 2009) point to vegetation changes in response to the millennial climate variations as a key factor in modulating dust emission, and hence ultimately also in controlling loess sedimentation (Fig. 2). They also show the strong seasonality of the dust cycle. Dust emission was mainly active in springtime when the snow cover had melted, the topsoil layer had begun to thaw, the surface winds were still strong (even though weaker than in winter), and the vegetation had not yet developed enough to completely protect the surface from wind erosion. The colder the climate, the later the emission season started, and the later it ended. Numerical experiments generated about one month of delay for a given region between the warmest (“Greenland interstadial”) and the coldest (“H stadial”) simulated climate state.
For Eastern Europe, previous data-based studies only suggested the general direction in which the source areas should have been located with respect to the investigated loess deposits. Numerical modeling results (Sima et al. 2013) now show the likely dust source areas (Fig. 2). They also suggest that Heinrich stadials, even though generally colder and drier than the other stadials, were not necessarily dustier. Dust storms appeared to be generally less frequent during Heinrich stadials, but individual events could become stronger than during non-Heinrich stadials. These modeling results are in agreement with findings of relatively coarser-grained layers in loess sequences interpreted as Heinrich-Stadial signature.
Asian loess
In the eastern part of Eurasia, the sedimentation in the Chinese Loess Plateau (Fig. 1), which commenced about 22 Ma ago, strongly depended on fluctuations of the Southeast Asian monsoon. Initial investigations on loess sequences from this area have identified orbital timescale variations related to changes in the three astronomical parameters: eccentricity, obliquity, and precession. Some series from the north of the Chinese Loess Plateau also exhibit particle-size variations with millennial frequency, similar to the DO oscillations observed in North Atlantic records. A correlation, mainly based on luminescence dates, has been established between intervals of coarse loess layers and Greenland stadials (without particularly distinguishing the Heinrich stadials), while intervals of fine-grained loess were associated with the DO warming events. The grain size changes are interpreted as reflecting variations in the strength of the atmospheric circulation during the SE Asian winter monsoon over the deserts of Mongolia and northern China, the main dust suppliers to the Chinese Loess Plateau.
The Chinese loess sequences do not contain any paleosols related to DO events, because the corresponding climate is too dry to allow pedogenesis. Alternating paleosol-loess units similar to those observed in Europe along 50°N can, however, be found in Siberian loess deposits north of Lake Baikal. The available radiocarbon dates allow the Siberian paleosols to be correlated with the DO events and suggest that the impact of the North-Atlantic millennial climate variations reached at least as far east as Lake Baikal.
North American loess
The North American loess deposits have recorded various influences, mostly related to climate changes originating in the North Atlantic and Pacific regions. According to climate simulations run with an Earth system model of intermediate complexity, the eastern part of North America should have been affected by the DO and Heinrich abrupt climate changes, but very few loess deposits can be found there to verify this model result. On the other hand, modeling results indicate that much of the Great Plains, where the thickest North American loess deposits are located, and the western part of the continent were not influenced by DO and Heinrich events. Indeed, the succession of paleosol-loess units in sediments in the state of Illinois, 120 km south of the Laurentide ice sheet margin at its maximum extent, is interpreted (using radiocarbon dates) as reflecting sub-millennial timescale inflow of air from the Gulf of Mexico, with a periodicity of about 450±100 yr. Loess sequences located further west, mainly in the state of Nebraska, show bedded mineral layers corresponding to even finer timescales. These were formed as a result of the transport of material during the Last Glacial Termination (~23-12 ka BP) from nearby areas, including the outwash areas of the southwest margin of the Laurentide ice sheet and the east margin of the Cordilleran ice sheet.
Outlook
Many loess deposits, especially across the Northern Hemisphere, have recorded past climate changes at millennial and sub-millennial timescales. Some loess sequences also contain evidence of particularly strong dust events with a much shorter characteristic timescale. Thus, during Marine Isotopic Stage 5, European sequences (especially from Central Europe) have recorded dust storms of continental magnitude in response to atmospheric blocking episodes (Rousseau et al. 2013). More effort is needed, on the data side, to better quantify the past dust-cycle variations at these different timescales, and on the modeling side, to more realistically simulate them.
acknowledgements
The authors were supported by the ANR ACTES project (ANR-08-BLAN-0227). DDR was supported by the Alliance program for a Visiting Professorship at Columbia University. This is LDEO contribution 2014-7803.
affiliations
1Laboratoire de Météorologie Dynamique & CERES-ERTI, CNRS - Ecole Normale Supérieure, Paris, France
2Lamont-Doherty Earth Observatory of Columbia University, Palisades, USA
contact
Denis-Didier Rousseau: denis.rousseaulmd.ens.fr
references
Full reference list under: http://pastglobalchanges.org/products/magazine/ref2014_2.pdf
Rousseau DD et al. (2007) Geophys Res Lett 34, doi:10.1029/2007gl031716
Rousseau DD et al. (2011) Clim Past 7: 221-234
Rousseau DD et al. (2013) Clim Past 9: 2213-2230
François De Vleeschouwer1,2, M. Ferrat3, H. McGowan4, H. Vanneste1,2 and D. Weiss3
Peatlands are formidable geochemical archives of atmospheric dust and are increasingly being used to address major paleoclimatic questions. Here, we provide an insight into the recent advances.
Peatlands are increasingly used as terrestrial archives of atmospheric dust deposition. Peat records mostly cover the Holocene, although some may extend beyond 10 ka (e.g. Kylander et al. 2007). The global occurrence of peatlands makes them a good alternative for making inter-hemispheric comparisons of paleoclimate when other terrestrial records are not available. Europe, for example, lacks long Holocene atmospheric archives such as ice cores, but it contains widespread peat deposits. Similarly, in the Southern Hemisphere, peatlands provide an opportunity to probe the entire Holocene, a period for which dust records from polar ice and marine cores are generally absent or offer lower resolution.
Peatlands have two key advantages over many other paleoenvironmental archives: they are relatively easy to access and sample and their high accumulation rates allow records of sub-decadal scale to be developed. Ombrotrophic (i.e. atmosphere-fed) peatlands, or bogs, offer the greatest insights into past climate as they only receive input through the atmosphere, such as aerosols and rain, and thus truly reflect local to regional-scale atmospheric conditions (Le Roux et al. 2010; Marx et al. 2009). Minerotrophic (i.e. stream-fed) peatlands, or fens, can also provide valuable information in terms of dust sources (e.g. Kylander et al. 2007; Muller et al. 2008a,b).
Earlier studies on peatland chemistry focused on atmospheric trace metal contamination to reconstruct pollution histories (e.g. Lee and Tallis 1973; Shotyk et al.1998). Today, studies focus more on the paleoclimatic and paleoenvironmental information of the dust trapped in peat. This includes developing tools to assess the integrity of the record (i.e. effects of post depositional element movements or groundwater input), to identify the origin of mineral dust particles and to quantifying flux changes through time.
Flux calculation
Atmospheric dust fluxes in bogs are reconstructed from the vertical distribution of lithogenic trace elements such as Ti, Sc, Zr, Y or REE (Rare Earth Elements) in bulk peat samples. These elements are not affected by post-depositional processes and do not have a significant anthropogenic source. In addition, it is essential to develop robust chronologies for the peat profiles based, for example, on 14C and 210Pb dating, and on age modeling that takes into account dating and accumulation rate uncertainties (Blaauw and Christen 2011). Robust chronologies allow dust fluxes to be calculated accurately, and to establish specific tie-points and correlate them to known climate events. Dust flux records have been successfully used to pinpoint abrupt events such as the Younger Dryas (Shotyk et al. 2002; Weiss et al. 2002), the 8.2 ka event (Shotyk et al. 2002; Le Roux et al. 2012), and the Little Ice Age (De Vleeschouwer et al. 2009). Furthermore, with good knowledge of the geochemical properties of potential dust source areas it is possible to distinguish distal from local (sub-)catchment sources, and apportion their contributions through time, thereby providing insight into regional scale environmental change (Marx et al. 2009, 2010).
Using dust records in modeling
The deposition rates determined from peat records offer a tool for validating atmospheric circulation model simulations, which in turn provide a platform for investigating the interactions between the atmospheric dust cycle and environmental change. Model validation of aerosol components is, however, still limited by the scarcity of past dust flux records.
A regional atmosphere-chemistry/aerosol climate model (REMOTE) has recently been successfully applied to simulate dust emissions and transport from the major Chinese deserts to its subsequent deposition over the Central Tibetan Plateau (Ferrat el al. 2013). This study showed that numerical modeling has the potential to reveal more about past and present dust cycles. The study also concluded, however, that further refinement of the dust and soil surface property parameterization is in particular needed in order to improve the climate model.
Another opportunity of data-model symbiosis lies in quantifying abrupt changes (or change points). The dust deposition record is normally represented as a function of depth or time. Trans-dimensional Markov chain Monte Carlo analysis has recently been explored to infer probability distributions on the number, position and age of change points, the mean distance between change points, and the noise variance associated with each dust record (Gallagher et al. 2011; Kylander et al. 2013). Simulating noise in dust records from bogs or ice cores can complement the observational information. Noise estimates of proxy records are normally limited to the measurement uncertainty, and in most cases it is not practical to repeat sampling and measurements to experimentally assess noise. Gallagher et al. (2011) analyzed several sets of geochemical dust data from peat cores taken from Australia, Sweden and Tibet. They showed that their model-based analyses are consistent with those previously inferred qualitatively from independent data and interpretations. Moreover, this approach provides quantitative estimates of the relative probability of the inferred change points, allowing an objective assessment of the significance of each change.
Sources
Lead isotopes were first used to identify sources of anthropogenic and natural dust in bogs (Shotyk et al. 1998). This opened a field of investigation aimed at developing proxies that better constrain the relative contributions of local and regional dust sources to peat deposits. However, lead has been emitted by anthropogenic activities for more than 5000 years (Nriagu 1983). This has limited the potential of lead as a natural dust tracer for the Holocene and has resulted in uncertainty in dust provenance reconstructions (Kamber et al. 2010).
 |
|
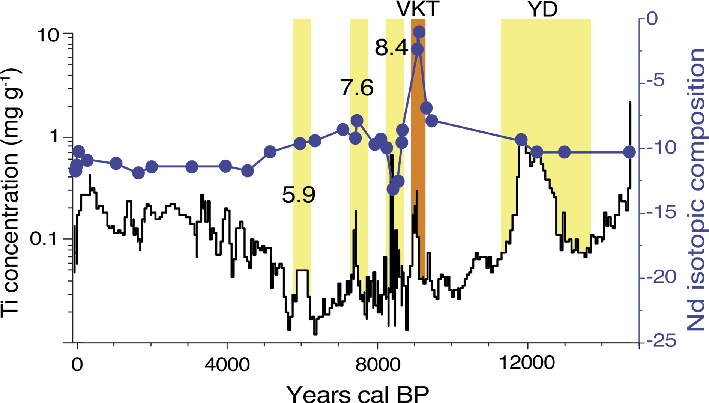
Figure 1: Ti concentration and Nd isotopic composition (εNd) in a bog profile in Switzerland. The Younger Dryas (YD) is characterized by an increase in local dust input, reflected by high Ti concentrations. Early Holocene Vasset-Kilian eruptions (VKT) in the French Massif Central result in high εNd. Saharan dust input is identified by negative εNd around 8.4 ka. The progressive desertification of the Sahara during the Holocene decreases εNd progressively from 7.5 to 3.5 ka cal BP, when local erosion becomes dominant. The two dust peaks (yellow bars) at 5.9 and 7.6 ka remain unexplained. Modified from Le Roux et al. 2012. |
In order to define the provenance of dust with greater certainty, other geochemical tracers are increasingly used. Coupling REE and Pb isotopes or lithogenic elements allows us to determine shifts between wet and dry climate (Kylander et al. 2007), to discriminate local from distal dust (Marx et al. 2009), and to reconstruct wind strength and changes in atmospheric circulation (Marx et al. 2011). In Europe, where Holocene atmospheric archives are rare, Le Roux et al. (2012) combined lithogenic elements, REE and Nd isotopes to reconstruct the dust flux and sources over the last 14 ka from a bog in Switzerland (Fig. 1). In this study, the interplay between climate and natural dust draws a complex picture of the Holocene dust sources, which are the Sahara desert, volcanism in France, and local erosion. Dust during the Younger Dryas dominantly originated from strong local erosion and mineral input, while during early Holocene volcanic eruptions and abrupt Saharan dust input around 8.4 ka BP were the main sources. In addition, the progressive desertification of the Sahara, already suggested by Kylander et al. (2005) using lead isotopes in a Spanish peat core, was identified through a progressive increase in Ti and a shift in εNd from 8 to 4 ka BP. With the same approach using REE and Nd isotopes, Allan et al. (2013) identified increased dust fluxes during cold periods and large supplies from distal (Saharan dust and Icelandic volcanism), regional (European Loess) and local sources during the Holocene.
Outlook
 |
|
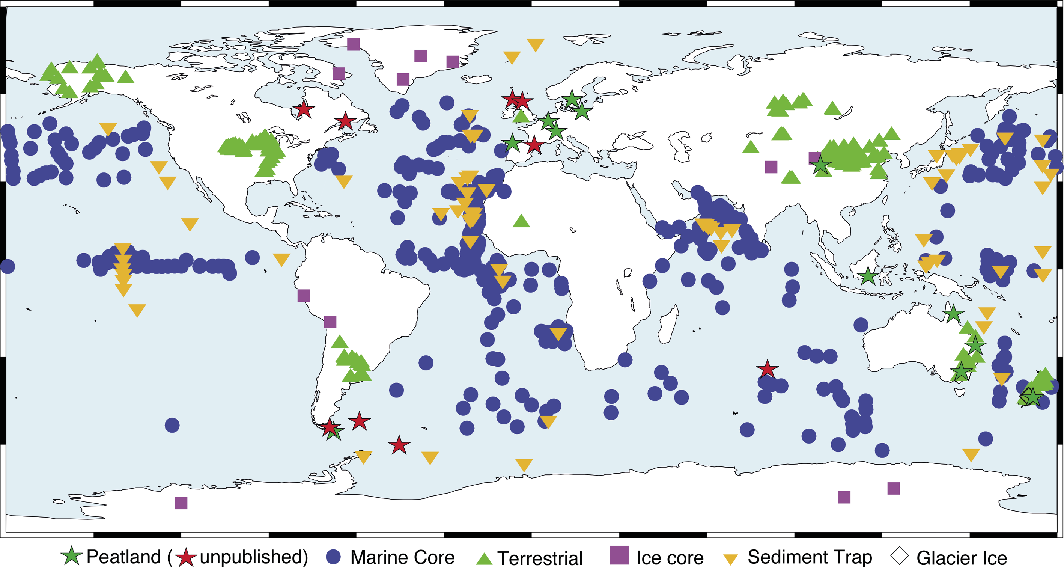
Figure 2: World coverage of dust records in peat, including already published peatland records (green stars) and ongoing works (red stars). Map drawn from Kohfeld and Tegen (2007), Mahowald et al. (2006) and Kohfeld and Harrison (2001). |
As an increasing number of studies have shown, the geochemical separation of dusts in peat and their provenance offers the prospect of unmatched insight into paleo-atmospheric circulation, its variability and the environmental consequences, primarily from synoptic to macro-scales, and associated environmental changes (McGowan et al 2008; Petherick et al. 2009). Accordingly, using dusts as tracers of paleoclimate provides an opportunity to calibrate and validate climate models. Efforts are now being made to refine the spatial coverage of peat dust records from the high latitudes to the tropics (Fig. 2) and extend the records back into the Quaternary. Peat researchers are now focusing on covering areas where dust records are lacking such as Canada, India and the Southern Hemisphere (Patagonia, Tierra del Fuego, South Africa, Falkland Islands, Amsterdam Island).
affiliations
1EcoLab (Laboratory for Functional Ecology and Environment), Université de Toulouse, INP, UPS, ENSAT, Castanet Tolosan, France
2EcoLab, CNRS, Castanet Tolosan, France
3Department of Earth Sciences and Engineering, Imperial College London, London, UK
4Climate Research Group, The University of Queensland, Brisbane, Australia
contact
François De Vleeschouwer: francois.devleeschouwerensat.fr
references
Full reference list under: www.pages-igbp.org/products/magazine/ref2014_2.pdf
Allan M et al. (2013) Clim Past 9: 2285-2298
De Vleeschouwer F et al. (2009) Holocene 19: 625-637
Ferrat M et al. (2012) Geochim Cosmochim Acta 91: 7-31
Barbara A. Maher and David T. Leedal
The influence of airborne dust on climate, through changes in the radiative properties of the atmosphere and through iron fertilization of oceans, remains a poorly quantified element of the Earth’s climate system, both in the present and in the past. Key dust properties include fluxes, mineralogy, and particle size and shape. However, dust-cycle models presently employ a relatively simple representation of dust properties (e.g. assuming spherical particles); these simplifications severely limit the realism of simulations of the impact of changes in dust loading on radiative forcing and biogeochemical cycling. One way to overcome this limitation and complement and validate these modeling efforts is to use records of dust deposition to assess what effects dust had in the past under different climatic conditions. This is where DIRTMAP, a dust database tailored for such interdisciplinary mineral dust research, could prove a valuable resource. Recently, the original DIRTMAP database (Kohfeld and Harrison 2001) was re-developed into a readily accessible web-based archive which allows interactive interrogation and visualization of the data.
DIRTMAP’s evolution
The Dust Indicators and Records of Terrestrial and MArine Palaeoenvironments (DIRTMAP1) database was originally developed in Lund, Sweden in 1997, as a product of the Mineral aerosols and glacial-interglacial cycles project, led by Sandy Harrison, Colin Prentice and Henning Rodhe. It was designed to enable mapping of mass accumulation rates (MARs) of dust at the Last Glacial Maximum compared with the late Holocene.
DIRTMAP2, subsequently developed by Karen Kohfeld and colleagues at Jena, Germany, included dust information from more sites, encompassing dust fluxes in ice cores, marine sediments, marine sediment traps, and loess sediments. Archived at the World Data Center for Paleoclimatology (ftp://ftp.ncdc.noaa.gov/pub/data/paleo/loess/dirtmap/), it also provided information on site age models (e.g. layer counting, radiocarbon, oxygen isotope stratigraphy), methods used for calculation of aeolian accumulation rate (e.g. isolation of terrigenous components, Al concentration measurements, number or mass concentrations), and marine sites with non-aeolian sedimentary contributions (e.g. IRD, sediment redistribution).
Other than the incorporation of some additional loess data, the underlying database for the next version, DIRTMAP3 (Maher et al. 2010), underwent relatively little change, as the multi- and inter-disciplinary dust research communities debated their future aims, methodologies, time-slices, dynamics and environments of enquiry. It became clear that any new version of DIRTMAP had to be not only more easily accessible but also more flexible in order to accommodate more diverse research objectives.
DIRTMAP4
Funded through the International Union for Quaternary Research (INQUA), the “Dust and Climate Working Group”, led by Lancaster University (www.lancaster.ac.uk/lec/sites/dirtmap/INQU), is currently developing a new website for the development of DIRTMAP4. The aim is to provide the opportunity for rapid updating and quality control of data, and the subsequent development of a new data archiving and access protocol, e.g. enabling archiving of data for additional time slices, and new meta-data fields (e.g. proxy data; particle mineralogy, size distribution, particle shape; bioavailable elements).
 |
|
Figure 1: Detail from DIRTMAP4 website showing map and querying controls. |
As part of this work on DIRTMAP4, we created a web interface to access the database and take advantage of the power of modern browsers and Asynchronous JavaScript and XML (AJAX) technology, thereby eliminating the need for users to install additional software to access the database. The aim is to provide the dust research community with instant access to the data and allow interactive interrogation and visualization (Fig. 1). A prototype version of the website is presently online at www.lancaster.ac.uk/lec/sites/dirtmap/hw.html.
The design has intentionally been kept simple to make it easy for other researchers to get involved. Indeed, extension of the database is actively encouraged under the terms of the MIT license (a permissive, free software license which originated at the Massachusetts Institute of Technology). We hope that the user interface and functionality is intuitive and self-explanatory.
affiliations
Centre for Environmental Magnetism & Palaeomagnetism, Lancaster University, UK
contact
Barbara A. Maher: b.maherlancaster.ac.uk
references
Kohfeld KE, Harrison SP (2001) Earth Sci Rev 54: 81-114
David Anderson, K. Horlick and R. Lingo
Your input is needed to produce a new, comprehensive, and openly accessible catalog of paleogeoscience resources, including databases, sample repositories, and shared software.
 |
Imagine a world where the global community of Earth scientists are well-connected, where resources such as data, software, sample repositories, journal articles, and social networking combine efficiently to accelerate the pace of discovery, where the infrastructure enables new approaches, where the time needed to manage data is reduced enabling more time to do science. This is the world envisioned by EarthCube, a US National Science Foundation sponsored long-term effort to develop cyberinfrastructure, bridge disciplines, and unlock the power of sharing tools, data, and information.
EarthCube was launched in 2011. Over 2500 scientists have contributed to the current structure and program development (Richard et al. 2014). EarthCube hopes the planned changes to Earth Science will be comparable in speed and breadth to the spread of the Internet or other basic Infrastructures. The EarthCube system will enable data intensive science, become an integral part of everyday research, and provide access to people, tools, and data.
The data management component will improve the availability and documentation of scientific data, enabling synthesis and re-use. Resource catalogs will put lists of software, data, and sample repositories on your desktop. Data and software will be integrated to simplify access, analysis, and visualization. Results will be piped between processes in reproducible workflows. Stovepipes constraining narrow disciplines will be removed enabling data and tools originating in one discipline to be applied in another.
One of the first steps to create this new world is to develop a catalog of resources. So the World Data Center for Paleoclimatology is now reaching out to PAGES scientists and educators, to help you add information about databases, software, and repositories to a central and comprehensive catalog of paleogeoscience resources.
Project history
The National Oceanic and Atmospheric Administration (NOAA) is spearheading the catalog development for the EarthCube project titled “C4P: Research Coordination Network for Paleogeosciences”. The C4P project connects with an Earth-Science-wide cataloging effort titled CINERGI that has the goal to build a comprehensive system linking geoscience resources, users, publications, usage information, and cyberinfrastructure components. The initial CINERGI catalog, with some paleoclimate entries, can be found at http://hydro10.sdsc.edu. A pivot table view exists at http://hydro10.sdsc.edu/c4pviewer/CommunityPivot.html. Both C4P and CINERGI produce resources that can be shared worldwide beyond the Earth Science discipline, for example through resource sharing platforms such as SciCrunch (scicrunch.com). In the future, informatics experts hope to create a catalog of resources that embraces all scientific disciplines.
The catalog idea
The guiding idea of the cataloguing effort is to help scientists discover samples, software, and data and use these resources in new and creative ways. Some PAGES-relevant resources are well known, for example the IMAGES and IODP marine sediment core collections, the PANGAEA and NOAA databases, and various radiocarbon calibration software packages. However, many resources that could be shared to the benefit of providers and users are instead hidden or hardly traceable. Cores and sample collections sometimes remain in the laboratories of individual investigators long after projects have been completed. Software that could be shared is used only by one team of investigators. Sharing resources accomplishes several goals that accelerate the pace of science and advance discovery. One goal is to identify best practices and unusually significant samples and data sets. Pilot studies made on already-existing samples can provide crucial evidence needed to secure research funding. Another goal is to enable resources used in one field, or for one scientific question, to be applied to other problems. For example, mosquitos collected and preserved by entomologists years ago, their skeletons affixed with pins to a board, have been sampled by epidemiologists to understand the spread of the West Nile virus using the DNA found in the mosquito’s bodies (Kaufmann et al. 2003).
Feed the catalog
We need your input and suggestions to produce the catalog of paleogeoscience resources. Input from scientists in the PAGES community is vital to make the catalog a comprehensive and truly international resource. We want your suggestions of software and databases focused on or relevant to paleogeosciences.
• Software should be non-commercial, and should be paleogeoscience-specific, such as radiocarbon calibration code or CoreWall (corewall.org).
• Databases for the catalog are defined as having an online searchable interface.
Paleogeosciences encompasses both paleoenvironmental and paleobiological research, including paleoclimatology, paleoecology, paleogeography, geochronology, and geochemistry. Conceptually these topics focus on past Earth and life processes.
To contribute a resource, email paleonoaa.gov with the name of the software or database resource, the URL, and a two-sentence description, with “EarthCube” in the subject line.
affiliations
World Data Center for Paleoclimatology, NOAA's National Climatic Data Center, Boulder, USA
contact
Kaleb Horlick: kaleb.horlicknoaa.gov
references
Zicheng Yu1, D. Charman2, D.W. Beilman3, V. Brovkin4 and D.J. Large5
Peatlands represent the largest carbon (C) pool in the terrestrial biosphere. In the form of peat (organic soils) they store at present ~600 Pg C, accumulated mostly since the Last Glacial Maximum. We know that peatlands played an important role in the global C cycle during the Holocene as also recognized by the IPCC AR5 (Ciais et al. 2013); however, we still lack a full understanding of how sensitive these C-rich ecosystems are in responding to climatic changes. Also, the lack of data and understanding on some fundamental processes, such as peatland lateral expansion, hinders large-scale synthesis and global modeling efforts. Furthermore, we have little idea about the C pool size and dynamics of peat deposits further back in time, such as during previous interglacials, the Pliocene and beyond, and their sensitivity to climate conditions outside the range of the Holocene.
C-PEAT’s goals
The formation of the PAGES' C-PEAT working group follows on the success of community-wide efforts sponsored by PAGES, INQUA, US NSF and UK NERC over the last five years. The effort was initiated with two workshops in 2009 (Jackson and Charman 2010) that resulted in a synthesis paper on northern peatland C during the last millennium (Charman et al. 2013). A recent workshop at Lehigh University in October 2013 (Yu and Loisel 2014) focused on synthesizing our knowledge on northern peatland C dynamics during the entire Holocene. This ongoing effort is built on an expanded database of Holocene peat C records described in Loisel et al. (2014), as part of a special issue in The Holocene on Holocene circum-Arctic peatland carbon dynamics guest-edited by Yu et al. (2014).
C-PEAT aims to synthesize data and knowledge on the evolution of peat C stocks through Earth’s history through collaborations between international peat C researchers working on peat of all locations and ages. We will continue to focus on Holocene peatlands because of abundant information being available, but we will also extend our attention to timeframes beyond the Holocene.
The ultimate goal of the working group is to understand the climatic sensitivity and contribution of peat deposits to the global C cycle by looking at peat dynamics in the past. Paleo peat data are essential not only for documenting C sequestration histories but also for evaluating global climate-carbon cycle models and for projecting future changes.
Planned activities during Phase 1
 |
|
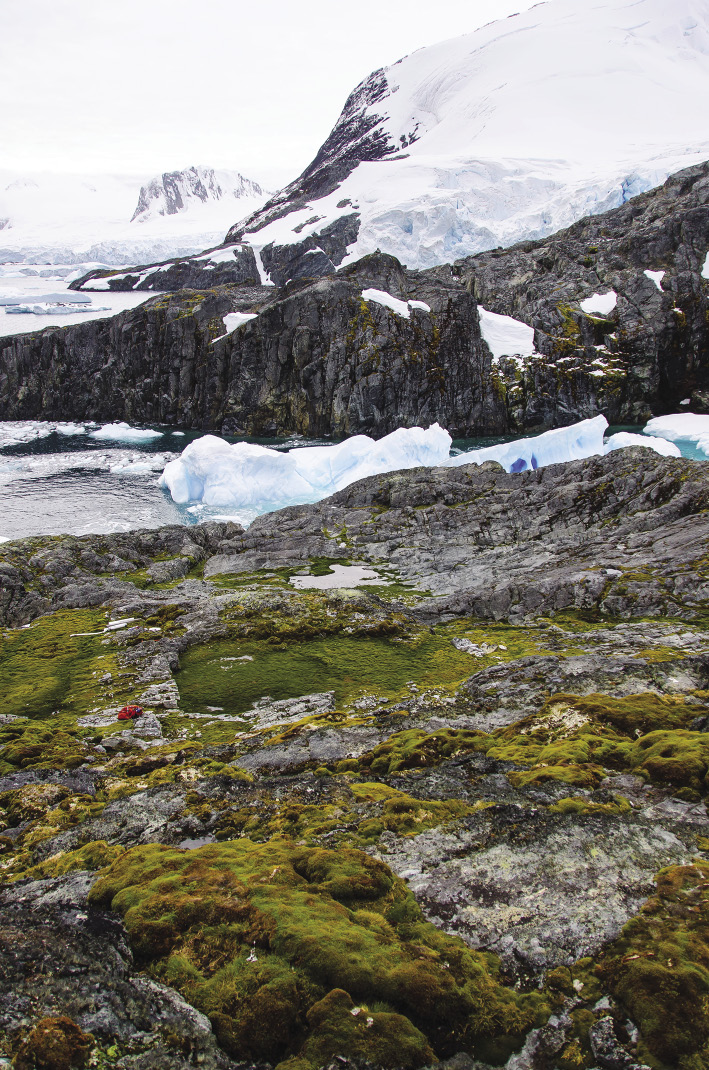
Figure 1: Peat-accumulating systems in Antarctica. Two waterlogged “peatlands” (center left) and aerobic moss peatbanks (foreground) at Rasmussen Hut on mainland Antarctic Peninsula around 65°S (photo by Zicheng Yu, February 2014). |
In the next three years, the working group proposes the following synthesis activities that will allow us to approach a first comprehensive assessment of peat C stocks on Earth through time.
(1) Antarctica and southern peatlands. A workshop held in England in October 2014 was focusing on the processes of peat inception and preservation in Antarctica, and comparisons of waterlogged peatlands versus aerobic peatbanks. This process understanding is critical to projecting future dynamics of peat-forming systems in Antarctica as more ice-free land becomes available in a warming climate. We also plan to synthesize peat C accumulation records in and around Antarctica, including sub-Antarctic islands, Patagonia and other southern high-latitude regions.
(2) Tropical peatlands. We encourage researchers working on tropical peat C history to lead and participate in the effort to synthesize peatland records to reconstruct peatland initiation and C accumulation histories. That effort would contribute to a unified understanding of processes controlling C accumulation.
(3) Pre-Holocene peat and coal. What were peat C stocks before the Holocene? How do the pre-Holocene and Holocene peat C accumulation rates compare? What switched global peat formation on and off in the past? What are the implications of extending peat growth models over time periods that greatly exceed those of the Holocene? What were the impacts of peat C on Earth’s carbon cycle and climate?
(4) Process understanding and modeling. There is an ongoing effort to understand the peatland lateral expansion process, especially for data-rich northern peatlands. This understanding will provide more robust estimates of peatland area change over time and of regional and global peatland C stocks. Also, understanding long-term decomposition is essential for reconstructing peat net C balance and its impact on the global C cycle in the past and in the future. Gaining a better understanding of these processes will contribute to global peat C modeling efforts as well as reconstructions of C sequestration history.
We welcome and invite anyone who is interested in peat C to get in touch with us to lead, contribute to and participate in these community-wide synthesis efforts. Visit the C-PEAT website: https://pastglobalchanges.org/science/wg/peat-carbon/intro
affiliations
1Department of Earth and Environmental Sciences, Lehigh University, Bethlehem, USA
2School of Geography, University of Exeter, UK
3Department of Geography, University of Hawaii at Manoa, Honolulu, USA
4Max Planck Institute for Meteorology, Hamburg, Germany
5Department of Chemical and Environmental Engineering, University of Nottingham, UK
contact
Zicheng Yu: ziy2lehigh.edu
references
Charman D et al. (2013) Biogeosciences 10: 929-944
Jackson ST, Charman D (2010) PAGES news 18, 52 pp
Loisel J et al. (2014) The Holocene 24: 1028-1942
Anne Hormes1 and Jostein Bakke2
The Arctic is characterized by a high diversity of paleoclimate archives, resulting in reconstructions that integrate multiple proxy evidence. At a workshop in San Francisco, USA, on 8 December 2013, Arctic2k took stock of its status and discussed scientific objectives and organizational structures for the coming phase of the project.
Phase I: Mission completed
In 2013, Arctic2k reached a milestone by contributing a data collection and 2000-year long temperature reconstruction to the benchmark paper by the PAGES2k Consortium (2013). Since then, the Arctic2k temperature reconstruction has been revised based on updates and corrections to the dataset. The revisions result in more pronounced decadal-scale variability and in amplification of the pre-20th century cooling trend (McKay and Kaufman 2014). The dataset now also includes the geochronologic data for the sedimentary records and age models based on a uniform approach for all records.
Here we would like to thank Atte Korhola and Sami Hanhijärvi (Helsinki, Finland) for their leadership, data management and analysis during Phase I, as well Nalân Koç (Tromsø, Norway) for initiating Arctic2k back in 2008.
Phase II: Hydroclimate and temperature
Jostein Bakke and Anne Hormes, the co-authors of this article, were designated as the new co-leaders of Arctic2k. They are supported by the data managers and proxy-specific coordinators helping with the inclusion of new records. For activities beyond the data collection, points of contact were established for specific methods and regions (see Arctic2k website).
 |
|
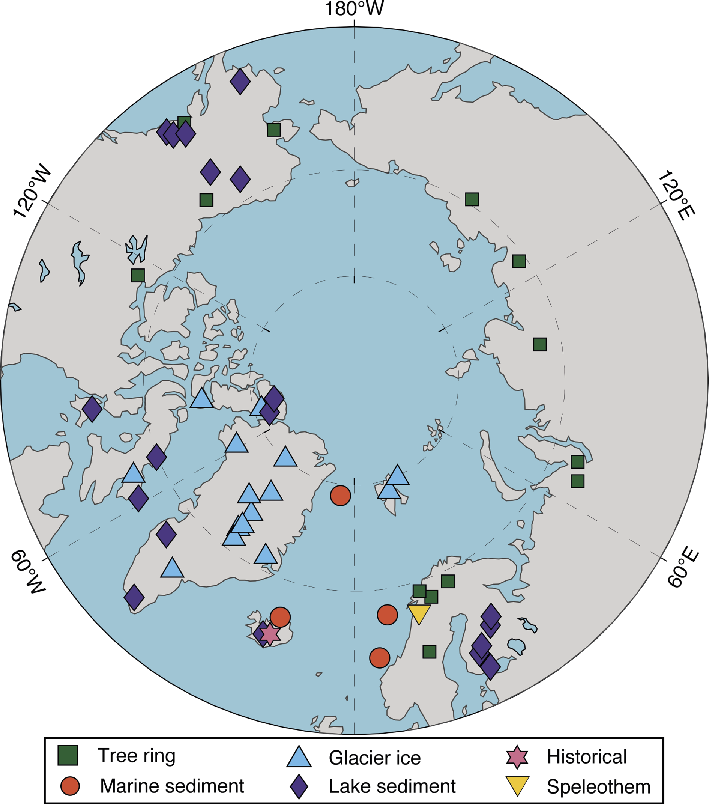
Figure 1: Map of the Arctic showing the location and type of temperature proxy records in the PAGES Arctic2k database. Modified from McKay and Kaufman (2014). |
The goal for Phase II is to produce multi-proxy based spatial reconstructions for temperature, precipitation and humidity for comparison with the model output of PMIP3 simulations. The first step towards this goal is to expand the Arctic proxy data collection with precipitation and humidity records.
The following goals and timeline were defined:
• Arctic2k meeting in April 2015 at EGU in Vienna
• Final version of the T and P database by 2015
• Regional temperature field reconstructions in 2015
• Comparison of spatial sea ice and climate reconstructions in 2015
• Hydroclimate reconstructions in 2015-2016
• Atmospheric pressure field reconstructions in 2015-2016
• Forcing vs climate signal analysis in 2015-2016
Three papers focusing on the following topics are in preparation:
1. Temperature field reconstruction using annually resolved records in the North-Atlantic region (J. Werner, M. Debret, H. Linderholm et al.).
2. Methods for hydro-climate reconstruction in the Arctic (A. Hormes, J. Bakke, W. d’Andrea, F. Lundqvist, J. Werner, H. Linderholm et al.).
3. Integration of marine and terrestrial paleoclimate records from the Svalbard-Barents Sea (E. Isaksson, D. Divine, K. Husum, J. Werner, M. Debret, A. Hormes, A. Miettinen et al.).
Please let us know if you would like to contribute to these publications or if you are planning additional papers using the Arctic2k database.
Arctic2k needs your input!
Temperature records currently in the Arctic2k database are shown in Figure 1. Some regions, such as the Russian or Canadian Arctic still yield few temperature records, while precipitation and humidity records still need to be collected for all regions. The task for the community of Arctic paleo-researchers over the coming months is therefore to complete the database with temperature or hydroclimate records fulfilling the following criteria:
• Demonstrated plausible mechanistic relation to climate
• At least one numerical age per 500-year interval
• At least one analysis every 200 years
• Must span at least 500 years during the past 2k
• Must be published in a peer-reviewed journal
• Must be made available once used for a PAGES2k publication
If you are aware of records that fulfill these criteria, please contact the Artic2k data managers Dmitri Divine or Johannes Werner. All new data will first be used internally by the PAGES 2k Network and be archived publicly once a product is published.
Finally, if you would like to participate in Arctic2k and contribute to our scientific objectives and publications, please contact us. You can also subscribe to the Arctic2k mailing list.
Visit http://pastglobalchanges.org/science/wg/2k-network/former-2k-activities/regional-2k-groups/arctic2k/intro for more information. The updated Arctic2k database is available here: www.ncdc.noaa.gov/paleo/pages2k/pages-arctic-2k.html
affiliations
1Department of Earth Sciences, University of Gothenburg, Sweden
2Department of Earth Science and Bjerknes Centre for Climate Research, University of Bergen, Norway
contact
Anne Hormes: anne.hormesgvc.gu.se
references
Hanhijärvi S et al. (2013) Clim Dyn 41: 2039-2060
Kaufman DS et al. (2013) Global Change 81: 17-23
McKay N, Kaufman D (2014) Sci Data 1, doi:10.1038/sdata.2014.26
Dunia H. Urrego1,2, J.P. Bernal3, C.M. Chiessi4, F.W. Cruz5, M.F. Sanchez-Goñi2, M. Power6, H. Hooghiemstra7 and LaACER participants8
The Latin American Abrupt Climate Changes and Environmental Responses (LaACER) initiative aims to assess the geographical extent and climatic signature of millennial-scale climate variability in the American tropics and subtropics by combining atmospheric, vegetation and oceanic records, and model simulations.
Millennial-scale climate variability such as Dansgaard-Oeschger cycles (Dansgaard et al. 1993) and Heinrich Events (Heinrich 1988) are characterized by a rapid onset and a duration ranging between 200 and 2500 years (Wolff et al. 2010). Open questions relate to the expression of these events in the tropics, the oceanic and atmospheric mechanisms involved, and the interaction with other forcings (e.g. ice volume, greenhouse gases and insolation changes). Modeling these rapid changes in the tropics has proven difficult, partly because modeling targets and constraints from well-documented paleoenvironmental observations of vegetation, fire, precipitation, oceanic processes and biogeochemical cycles remain scarce. Understanding how tropical systems have been affected by, or may have triggered, rapid climate variability in the past is valuable, as the impacts recorded in natural archives might offer some insights into anthropogenic climate change.
The LaACER initiative
The INQUA International Focus Group, ACER (Abrupt Climate Changes and Environmental Responses), has promoted considerable advances in the understanding of millennial-scale climate variability and environmental responses. However, in its global synthesis, ACER also emphasized the scarcity of millennial-scale paleoclimatic records from the tropical regions (Harrison and Sanchez-Goñi 2010). The Latin American ACER (LaACER) project was conceived to fill this gap. LaACER sits within the Palaeoclimate Commission of INQUA, and has held two workshops to date, both co-supported by PAGES (www.ephe-paleoclimat.com/acer/LaACER.htm).
LaACER’s main objective is to improve our understanding of millennial-scale climate variability by investigating its geographical extent and environmental signature in the American tropics and subtropics. Climate in these two regions is influenced by both the Pacific and Atlantic oceans, and by several atmospheric features including the Intertropical Convergence Zone (ITCZ), the North American Monsoon (NAM), the South American Summer Monsoon (SASM), and El Niño-Southern Oscillation (ENSO; Garreaud et al. 2009). The convergence of multiple climatic features in the focus region of LaACER makes it essential for our understanding of the whole climate system.
A consistent chronology
 |
|
Figure 1: Sampling sites and schematic representation of a Heinrich event. White spots depict iceberg discharge in the Ruddiman belt (Ruddiman 2001). Gray areas represent the boreal-winter configuration of the ITCZ and the SASM based on average January rainfall measured between 1998-2009 (NASA TRMM). Locations of records mentioned in the text are numbered as follows: 1. Peten-Itza (Correa-Metrio et al. 2012; Escobar et al. 2012), 2. Fúquene (Bogotá et al. 2011; Groot et al. 2011; Hooghiemstra 1984), 3. Cariaco (González and Dupont 2009; Peterson et al. 2000), 4. M772-059 (Mollier-Vogel et al. 2013), 5. Junin (Hansen et al. 1994), 6. Titicaca (Baker et al. 2001; Fritz et al. 2010; Paduano et al. 2003), 7. Consuelo (Urrego et al. 2010), 8. La Gaiba (Whitney et al. 2011), 9. Lapa Sem Fim, and 10. Paixão (Strikis et al., pers. comm.), 11. Botuverá (Cruz et al. 2005), 12. GeoB6211–2 (Chiessi et al. 2008, 2009), 13. Chaplin (Mayle et al. 2000), 14. Cueva del Diamante (Cheng et al. 2013), 15. Santiago (Mosblech et al. 2012), 16. GeoB 3104-1 (Arz et al. 1998). |
Understanding the signature of millennial-scale events requires a tight chronological framework that not only permits consistent identification of the events, but also the accurate determination of leads and lags. In their review paper, Sanchez-Goñi and Harrison (2010) define a Heinrich Stadial (HS) as the cold interval triggered by a Heinrich Event (HE). HEs are defined as the periods when large amounts of ice-rafted debris (IRD) were deposited in the Ruddiman belt, a region in the North Atlantic influenced by the Laurentide and Scandinavian ice-sheets (Fig. 1). In absence of the characteristic IRD layers, defining the timing of climate phases related to HEs in the American tropics and subtropics is challenging, but nevertheless critical for advancing our understanding of the processes underlying abrupt climate changes.
As an example, the various chronological approaches used to date the onset of HS1 in the LaACER region result in age discrepancies of up to 800 years. In marine records off the coast of Brazil (GeoB6211-2; Chiessi et al. 2008, 2009; Fig. 1) HS1 is correlated with the chronostratigraphy of HE1 in the North Atlantic (McManus et al. 2004), whereas in the eastern Equatorial Pacific (M772-059; Mollier-Vogel et al. 2013) HS1 is tied to Iberian Peninsula records (Bard et al. 2000). Pollen records are correlated with the HS chronozones as defined in Sanchez-Goñi and Harrison (2010), others with the interstadials of the North Greenland Ice Core Project or from the Iberian Margin (Martrat et al. 2007). Finally, speleothem records are U-Th dated, but the HS are identified via abrupt stratigraphic changes in the δ18O record (Botuverá, Cruz et al. 2005; Santiago, Mosblech et al. 2012; Fig. 1).
Speleothem records show clear abrupt δ18O stratigraphic changes that coincide, within age uncertainty, with the timing of radiocarbon-dated Heinrich layers from the Ruddiman belt. These changes can be directly dated with U/Th, avoiding radiocarbon calibration uncertainties and reservoir corrections. Outside the Ruddiman belt, and specifically in the tropics, the timing of abrupt stratigraphic changes in speleothem records can probably provide the most accurate ages for HS. However, it is important to note that ages derived from speleothem records cannot provide a direct age for HE, as the definition of these climatic events is based on the identification of IRD layers in marine records from the Ruddiman belt. Additionally, assuming synchronicity between high and low latitude records invalidates any analysis of leads and lags.
State of the art
The LaACER workshops have highlighted well-documented climatic intervals in the American tropics and subtropics, available terrestrial and marine records, and spatial and temporal priorities for future research. The importance of high-resolution records has been illustrated through the development of new speleothem and pollen records that provide some of the best paleoclimate archives from the region. These records reach back to Marine Isotope Stage (MIS) 5 in Botuverá, MIS7 in Lake Fúquene, and MIS8 in the Cueva del Diamante (Fig. 1). Modeling efforts have focused on transient climate simulations and data-model comparisons (Groot et al. 2011; Nace et al. in press). Available paleovegetation records with decadal to centennial resolution are concentrated in the Northern Hemisphere (e.g. Fúquene, Peten Itza, Cariaco). In the Southern Hemisphere, paleovegetation records have centennial to millennial resolution (e.g. Junin), and only a handful reach back to MIS 3 (e.g. Consuelo, Titicaca, Chaplin, La Gaiba).
 |
|
Figure 2: Average outgoing long-wave radiation for the period 1950-2008 (May-November) for the American tropics and subtropics as an indicator for convective activity (NCEP Reanalysis) showing the average position of the ITCZ and the NAM. Circles indicate the structure and signature of millennial-scale North Atlantic cooling stadials at different sites. |
The structure of millennial-scale events in the American tropics and subtropics is one of the main foci of LaACER for the coming years (Fig. 2). A multi-phased structure of HSs in the region is becoming apparent from available records. HS1 in particular has been the focus of paleoceanographic research in the Atlantic (Chiessi et al. 2008) and the Pacific (Mollier-Vogel et al. 2013), and was studied in a series of yet-to-be-published speleothem records from the Lapa Sem Fim and Paixão caves in eastern Brazil (Fig. 1). Overall, records consistently indicate reduced precipitation in the northern American tropics and enhanced precipitation in the southern American tropics during HSs, with two sub-events identified mostly in eastern Brazil (Fig. 2). High-resolution speleothem records from Brazil also reveal two discrete peaks in monsoon activity forming a “double-plunge” structure during the 8.2-ka event (Cheng et al. 2009).
Ways forward
To gain an improved understanding of millennial-scale events in the American tropics and subtropics, LaACER has identified the following research priorities.
• Modeling efforts should prioritize transient and snapshot simulations not only of ocean and atmospheric processes, but also integrate changes in vegetation and fire activity.
• More data-model comparisons will help disentangle the physical processes driving millennial-scale climate variability.
• High-resolution records of vegetation change and fire activity are needed to discern abrupt shifts in environmental conditions.
• The lack of independent proxy records from sedimentary archives for which pollen sequences already exist has been recognized as a limitation, and future work should focus on the generation and integration of such records.
• Existing marine records could possibly be used to extend the sea surface temperature evolution of the Brazil Current beyond HS1.
• New marine records could help characterize the North Brazil Current and its direction during other HSs.
• Marine records with well-preserved terrestrial markers could allow us to directly relate continental and marine changes without chronological ambiguity.
• Future work should also aim to understand ENSO dynamics during HS in the eastern tropical Pacific.
• A priority in the area of atmospheric research is to extend the spatial coverage of paleoclimate data with new high-resolution records that can reveal the dynamics of NAM and SASM.
• Finally, combining speleothem records with vegetation and fire records will reveal more about the dynamics of the ITCZ, NAM and SASM, and enable us to identify the environmental consequences of millennial-scale variability.
affiliations
1Geography, College of Life and Environmental Sciences, University of Exeter, UK
2Ecole Pratique des Hautes Etudes, University of Bordeaux, France
3Centro de Geociencias, Universidad Nacional Autónoma de México, Mexico
4Escola de Artes, Ciências e Humanidades, Universidade de São Paulo, Brazil
5Instituto de Geociências, Universidade de São Paulo, Brazil
6Natural History Museum of Utah, Department of Geography, University of Utah, USA
7Institute for Biodiversity and Ecosystem Dynamics, University of Amsterdam, The Netherlands
8http://ephe-paleoclimat.com/acer/LaACER.htm
contact
Dunia H. Urrego: D.Urregoexeter.ac.uk
references
Full reference list under: http://pastglobalchanges.org/products/magazine/ref2014_2.pdf
Dansgaard W et al. (1993) Nature 364: 218-220
Harrison SP, Sanchez Goñi MF (2010) Quat Sci Rev 29: 2957-2980
Heinrich H (1988) Quat Res 29: 142-152
Sanchez Goñi MF, Harrison SP (2010) Quat Sci Rev 29: 2823-2827
 |
Pascal Bohleber1, M. Cavitte2, B. Koffman3, B. Markle4, P. Pavlova5, M. Winstrup4 and H. Winton6
Following the International Partnerships in Ice Core Sciences (IPICS) 2012 conference in Giens, France, a small group of passionate early-career ice core researchers from Australia, Europe and the United States joined to form Ice Core Young Scientists (ICYS).
ICYS is intended to be an informal, international network of early-career scientists dedicated to the study of polar and alpine ice cores and ice core-related sciences. Our purpose is to foster personal connections among young scientists from around the world, in order to build a supportive ice core science community and to inspire future collaborations.
We are entirely self-organized and have been meeting on a regular basis since Giens to prepare for embracing new members to extend the network. One of our key tools is our LinkedIn page, an online environment where members can connect and exchange scientific ideas or advertise upcoming meetings. We also have an ICYS webpage on the PAGES website and a Facebook group.
 |
|
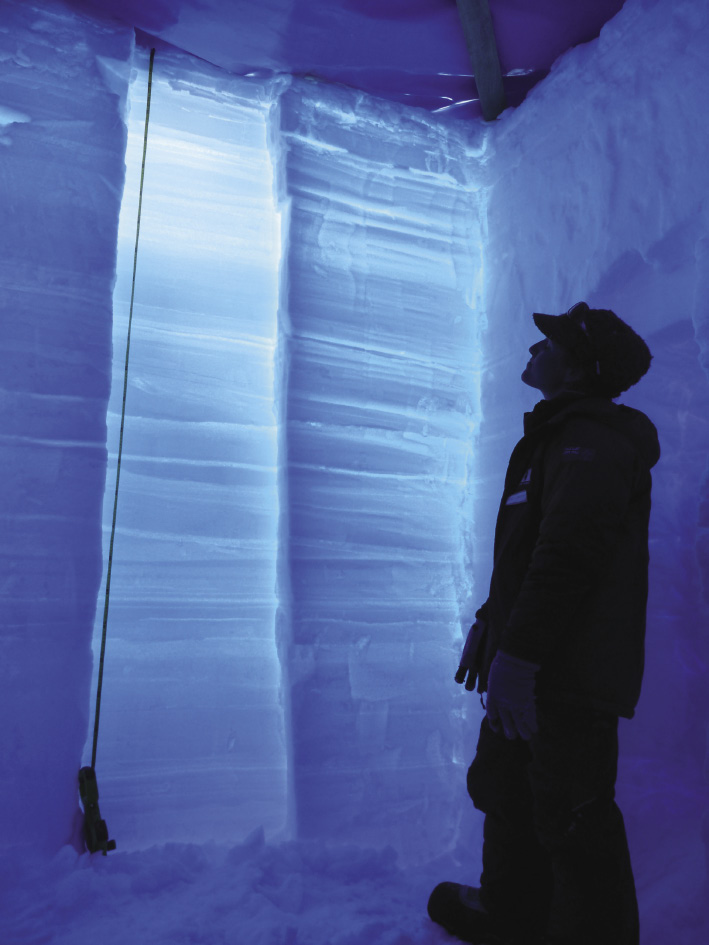
Figure 1: Lana Cohen (Victoria University of Wellington, New Zealand) examining storm layers in a snow pit on Roosevelt Island, Antarctica, 2010. Photo by Bradley Markle. |
Some informal networking events have taken place at recent conferences. The first was held during the 2013 AGU Fall Meeting where we organized an ice core dinner. Similar events took place during the recent SCAR Open Sciences conference in August and EGU General Assembly in April 2014 and were highly successful, with a turnout of more than 30 ice-core scientists of all ages.
In light of these successes, ICYS will continue organizing social events to facilitate networking among young ice core scientists, making them a regular tradition at future EGU and AGU annual meetings as well as at a number of other international conferences. We are also envisioning a series of early-career scientist workshops.
We are planning ICYS early-career events at AGU Fall Meeting (San Francisco, USA, 15-19 December 2014) and EGU General Assembly (Vienna, Austria, 12-17 April 2015). These will be great opportunities to meet fellow ice core young scientists from around the world. Stay tuned for details of these events.
We are aiming to build an online community for young ice core scientists to share ideas, ask questions, and collaborate with each other across the globe - a resource we all can share - so we encourage you to join us on LinkedIn and Facebook and subscribe to our email list by writing to: icecoreysgmail.com
Website: http://pastglobalchanges.org/science/end-aff/icys
LinkedIn: www.linkedin.com/groups?home=&gid=5053409&trk=anet_ug_hm
Facebook: https://www.facebook.com/groups/751731074891138/?fref=ts
affiliations
1Climate Change Institute, University of Maine, USA
2Institute for Geophysics, University of Texas of Austin, USA
3Lamont-Doherty Earth Observatory of Columbia University, Palisades, USA
4Earth & Space Sciences, University of Washington, Seattle, USA
5Paul Scherrer Institut, Villigen, Switzerland
6John de Laeter Centre for Mass Spectrometry, Curtin University, Bentley, Australia
contact
Holly Winton: icecoreysgmail.com