PAGES Magazine articles
Davide Zanchettin1, C. Timmreck2, M. Khodri3, A. Robock4, A. Rubino1, A. Schmidt5 and M. Toohey2,6
Simulating volcanically-forced climate variability is a challenging task for climate models. The model intercomparison project on the climate response to volcanic forcing (VolMIP) defines a protocol for idealized volcanic-perturbation experiments to improve comparability of results across different climate models.
Stratospheric aerosols originating from volcanic sulfur emissions are a critical part of the natural forcing driving interannual-to-multidecadal climate evolution. In its 2013 assessment report, the Intergovernmental Panel on Climate Change (IPCC) affirms strong advances had been made in understanding volcanic aerosols and constraining associated forcing estimates compared with previous assessments (Myhre et al. 2013). Challenging the high confidence in volcanic forcing estimates reported by the IPCC (see Table 8.5 in Myhre et al. 2013), climate model results show some gaps in our understanding of the climate’s response to volcanic eruptions. For example the largest uncertainties in the estimates of radiative forcing from historical simulations performed using state-of-the-art climate models occur during periods of strong volcanic activity (Santer et al. 2014); climate models generally do not produce robust dynamical responses to volcanic eruptions (e.g. Driscoll et al. 2012; Ding et al. 2014) and tend to overestimate the observed post-eruption global surface cooling (Marotzke and Forster 2015); and simulated temperatures around major volcanic events of the last millennium often disagree with corresponding reconstructed changes (e.g. Mann et al. 2012; Anchukaitis et al. 2012).
The key question then is whether the lack of robustness in models’ behavior mostly depends on insufficient representation of climate processes, or other substantial sources of uncertainty, such as the imposed volcanic forcing. The lack of agreement between model results is mainly due to differences in the model’s characteristics, such as spatial resolution and implementation of volcanic forcing (e.g. Timmreck 2012). Nevertheless, whereas recent volcanic eruptions have been well observed and forcing estimates relatively well constrained, uncertainties grow considerably for events that occurred in the more remote past. For such eruptions, which contribute substantially to our understanding given the few instrumentally observed events, forcing characteristics must be reconstructed based on indirect evidence. This implies a lack of detail and large uncertainties regarding the climatically relevant parameters related to the source (especially the magnitude of the eruption), and to the stratospheric aerosol properties such as spatial extent of the cloud, optical depth, and aerosol size distribution (e.g. Timmreck 2012). All these large uncertainties are reflected in the occasionally substantial inconsistencies between available volcanological datasets (Sigl et al. 2014). Furthermore, internal climate variability and the presence of other forcing factors contribute to determine which mechanisms are activated in response to individual events (e.g. Zanchettin et al. 2013). It is therefore difficult to constrain the simulated responses to eruptions that occurred before the instrumental period, for which knowledge about the background climate conditions is poor.
 |
|
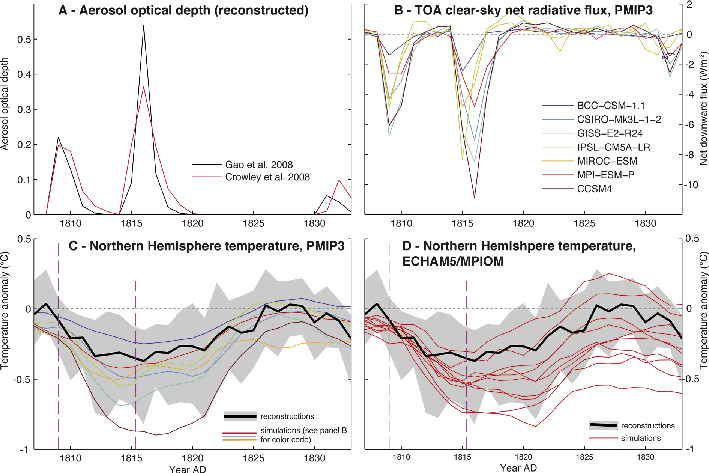
Figure 1: Uncertainty in radiative forcing and climate response for the early-19th-century eruptions. (A) Two estimates of annual-average global aerosol optical depth at 550 nm (AOD). (B) Top-of-atmosphere (TOA) annual-average net clear-sky radiative flux anomalies for a multi-model ensemble of last-millennium simulations (PMIP3; Braconnot et al. 2012). (C) Comparison between simulated (PMIP3, 11-year smoothing, colors) and reconstructed (black line: mean; shading: 5th-95th percentile range) Northern Hemisphere average summer temperature anomalies (from 1799-1808). (D) Same as (C), but for a single-model ensemble (ECHAM5/MPIOM; Zanchettin et al. 2013). The models tend to overestimate the reconstructed early-19th-century cooling, yet both simulation ensembles are compatible with the reconstruction; different models and forcing inputs (C) and internal climate variability (D) similarly contribute to simulation-ensemble spread. |
It is thus unsurprising that different simulations, either performed with different climate models or with the same climate model, and climate reconstructions tell different, often divergent stories about the post-eruption climate evolution. This occurred, for instance, in the case of the 1815 Tambora event, the largest-magnitude volcanic eruption of the past five centuries (Fig. 1).
Coordinated model intercomparisons
The continuing development of more accurate histories of past eruptions (e.g. Sigl et al. 2014) and more realistic volcanic forcing datasets (e.g. Arfeuille et al. 2013) promises to improve climate model simulations of past volcanic events. This alone, however, is not enough to discern the individual contributions to uncertainty from the bulk of the varied factors illustrated above. It is also necessary to frame modeling activities within standardized experiments designed to systematically tackle specific uncertainty factors.
The ongoing Model Intercomparison Project on the climatic response to Volcanic forcing (VolMIP) has defined a common protocol to subject coupled climate models to the same volcanic forcing, thus aiming for negligible across-model differences in the applied radiative forcing (e.g. Fig. 1b) in order to focus on the climate response. The coordinated experiments will assess the causes of across-model spread linked to the different treatment of physical processes, and separate such model uncertainties from uncertainties in the forcing and internal variability.
VolMIP focuses on the simulated processes that determine two main aspects of climate response to large volcanic eruptions: (i) the immediate dynamical alteration of atmospheric circulation triggered by the volcanically-induced stratospheric thermal anomaly and the associated variations in regional near-surface responses; and (ii) the decadal-scale response of the oceanic thermohaline and gyre circulations and associated long-term changes in heat transport and ocean-atmosphere coupling.
The VolMIP experiments
VolMIP defines a set of idealized volcanic perturbations based on historical eruptions. In this context, “idealized” means that the volcanic forcing is derived from radiation parameters of documented eruptions and the experiments do not include information about the actual climate conditions when these events occurred. The experiments are designed as ensemble simulations, with sets of initial climate states sampled from an unperturbed preindustrial simulation. By exploring very different initial conditions, VolMIP aims to constrain the range of post-eruption evolutions that arise from the interplay between ongoing internal climate variability and the imposed radiative perturbation, thus clarifying how much an accurate knowledge of background climate conditions matters when reproducing past volcanic events. Specific attention is given to the concomitant phasing of two dominant modes of climate variability: the El Niño-Southern Oscillation, the most important source of interannual climate variability, and the Atlantic meridional overturning circulation, a measure of the strength of the oceanic thermohaline circulation.
 |
|
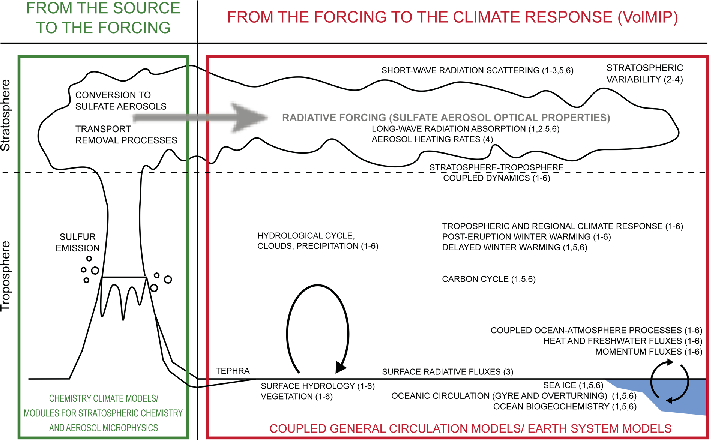
Figure 2: Dominant processes illustrating the link between volcanic eruptions and climate response, with an overview of VolMIP experiments as submitted to the World Climate Research Program for CMIP endorsement (1-4: mandatory; 5,6: non-mandatory). VolMIP experiments: (1) Tambora-like tropical eruption [VolLongS60EQ]; (2) Pinatubo-like tropical eruption [VolShort20EQfull]; (3) Pinatubo-like eruption, prescribed perturbation to shortwave radiative flux [VolShort20EQsurf]; (4) Pinatubo-like eruption, prescribed perturbation to aerosol heating rates [VolShort20EQstrat]; (5) Laki-like high-latitude eruption [VolLongS100HL]; (6) 19th century-like cluster of tropical eruptions [VolLongC19thC]. |
The proposed core and sensitivity experiments (Fig. 2) reflect VolMIP’s twofold strategy:
• VolShort: a set of experiments focusing on the seasonal-to-interannual atmospheric response to a 1991 Pinatubo-like volcanic eruption. The goal is to discriminate between the uncertainties that are due to internal variability (within-model spread) and those due to model characteristics (across-model spread). The core full-forcing experiment is supported by sensitivity experiments designed to determine the roles of surface cooling and stratospheric warming – the two main features of short-term post-eruption climate variability – in controlling the dynamical response of the atmosphere. Additional experiments address the impact of volcanic forcing on seasonal-to-interannual climate predictability.
• VolLong: a set of experiments addressing the long-term (up to the decadal time scale) climate response to volcanic eruptions featuring a high signal-to-noise ratio in the global-average surface temperature response. Focus is on the signal propagation pathways of volcanic perturbations within the coupled atmosphere-ocean system, the associated determinant dynamical processes and their representation across models. The 1815 Tambora eruption is chosen as reference for the core experiment, as available climate-proxy data provide information on both eruption characteristics and climate response. A 1783 Laki-like, high-latitude eruption and idealized volcanic clusters (close successions of large volcanic eruptions) are also contemplated in this set of experiments. Provision of forcing input data for these simulations is an integral part of VolMIP.
Conclusions
Improvement in understanding the dominant mechanisms behind simulated post-eruption climate evolution crucially depends on coordinated modeling activities that address the individual sources of uncertainty separately. By subjecting different models to well-constrained volcanic forcing, VolMIP promises to make significant progress in our knowledge of the physical processes that determine the climate’s response to volcanic forcing. By further clarifying the relative role of internal and externally-forced climate variability during periods of strong radiative forcing, VolMIP can enhance our ability to accurately simulate past, as well as future, climates.
affiliations
1Department of Environmental Sciences, Informatics and Statistics, University of Venice, Italy
2Max-Planck-Institute for Meteorology, Hamburg, Germany
3IRD/IPSL/Laboratoire d'Océanographie et du Climat, Paris, France
4Department of Environmental Sciences, Rutgers University, New Brunswick, USA
5School of Earth and Environment, University of Leeds, UK
6GEOMAR Helmholtz Centre for Ocean Research Kiel, Germany
contact
Davide Zanchettin: davide.zanchettin unive.it
references
Anchukaitis K et al. (2012) Nat Geosci 5: 836-837
Arfeuille F et al. (2013) Atmos Chem Phys 13: 11221-11234
Braconnot P et al. (2012) Nature Clim Change 2: 417-424
Crowley TJ et al. (2008) PAGES News 16: 22-23
Ding Y et al. (2014) J Geophys Res 119: 5622-5637
Driscoll S et al. (2012) J Geophys Res 117, doi:10.1029/2012JD017607
Frank DC et al. (2010) Nature 463: 527-530
Gao C et al (2008) J Geophys Res 113, doi:10.1029/2008JD010239
Mann ME et al. (2012) Nature Geosci 5: 202-205
Marotzke J, Forster P (2015) Nature 517: 565-570
Santer BD et al. (2014) Nature Geosci 7: 185-189
Sigl M et al. (2014) Nature Clim Change 4: 693-697
Carley E. Iles, G.C. Hegerl and A.P. Schurer
Large, explosive volcanic eruptions cause a decrease in global precipitation and shifts in the position of the Intertropical Convergence Zone. Regionally, the most significant changes include decreases in precipitation in monsoon areas, and more precipitation in dry tropical ocean regions.
Large, explosive volcanic eruptions are an important driver of climate variability. For instance, the 1815 eruption of Mount Tambora in Indonesia was followed, by “the year without a summer” in Europe and North America (Stothers 1984). Volcanic eruptions have also caused decreases in hemispheric and regional temperature over the last millennium, particularly over the Little Ice Age (e.g. Schneider et al. 2009; Schurer et al. 2013), and are even speculated to have contributed to its onset (Miller et al. 2012). Climatically relevant eruptions operate through injecting SO2 into the stratosphere, where it is oxidized into sulfate aerosols, which reflect incoming solar radiation. These aerosols spread out globally following tropical eruptions, or over the hemisphere of eruption for high latitude ones, with a lifetime in the stratosphere of a couple of years. The result is a global cooling response lasting a few years (e.g. Robock 2000 and references therein).
Global precipitation decrease
Volcanic eruptions also affect other components of the climate system, by changing atmospheric circulation, increasing sea ice extent, and reducing global precipitation (e.g. Robock 2000; Timmreck 2012). Precipitation decreases have been found in both observational records and in climate model simulations forced with observed records of volcanic aerosols (e.g. Iles et al. 2013; Iles and Hegerl 2014; Trenberth and Dai 2007). They occur because less short-wave radiation reaches the surface, thereby reducing evaporation and stabilizing the atmosphere, whilst the cooler atmosphere contains less water vapor. This pattern is modulated on regional scales by circulation changes, for example weakened monsoon winds can result from larger post-eruption cooling of the land relative to the ocean, reducing precipitation in monsoon regions (e.g. Joseph and Zeng 2011; Schneider et al. 2009).
Isolating the effect of volcanic eruptions is more difficult for precipitation than for temperature because it demonstrates less spatial and temporal coherence. A technique used to overcome this is termed “superposed epoch analysis” and involves averaging the precipitation response across multiple eruptions in order to reduce climate noise (e.g. Fischer et al. 2007).
 |
|
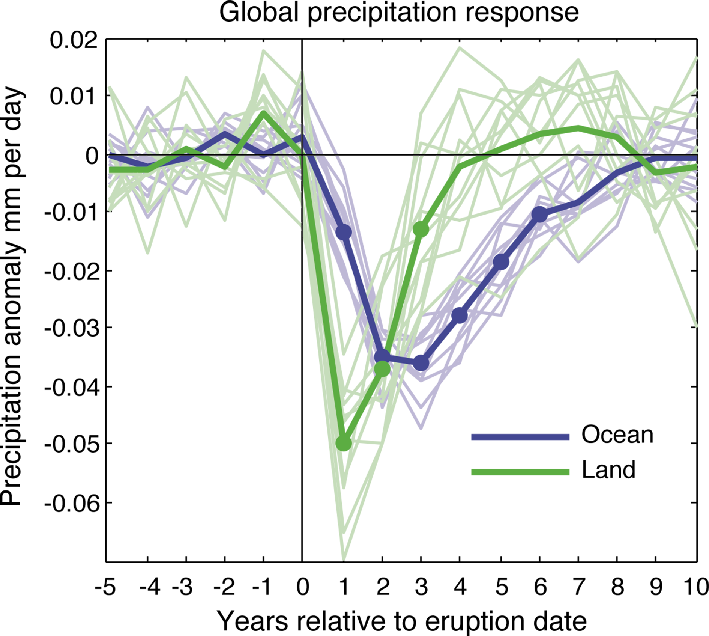
Figure 1: Global land and ocean precipitation response averaged over 18 low latitude eruptions and 11 ensemble members of the climate model HadCM3. Thick lines are ensemble means and thin lines are individual ensemble members. Dots indicate where the ensemble mean response is significant against internal variability at the 5% level. Figure modified from Iles et al. 2013. |
Iles et al. (2013) examined the precipitation response to volcanic eruptions using this technique in both observational data and simulations of the last 600 years using the climate model HadCM3. Figure 1 shows that the model simulated precipitation response over the ocean is longer lived than that over land. Further investigation showed that this is a phenomenon that occurs in all historical simulations of the coupled climate models submitted to CMIP5 (Coupled Model Intercomparison Project Phase 5; Iles et al. 2014). Iles et al. (2013) found that the timing of the ocean precipitation response matched the timing of the post-eruption cooling response over the oceans, implying that precipitation changes could be driven through changing sea surface temperatures. Over land, precipitation reacted faster than temperature, its timing instead consistent with a reduction in land-ocean temperature gradient and the increase in aerosol optical depth, suggesting links to weakening monsoons and a directly forced component respectively.
Spatial pattern of the precipitation response
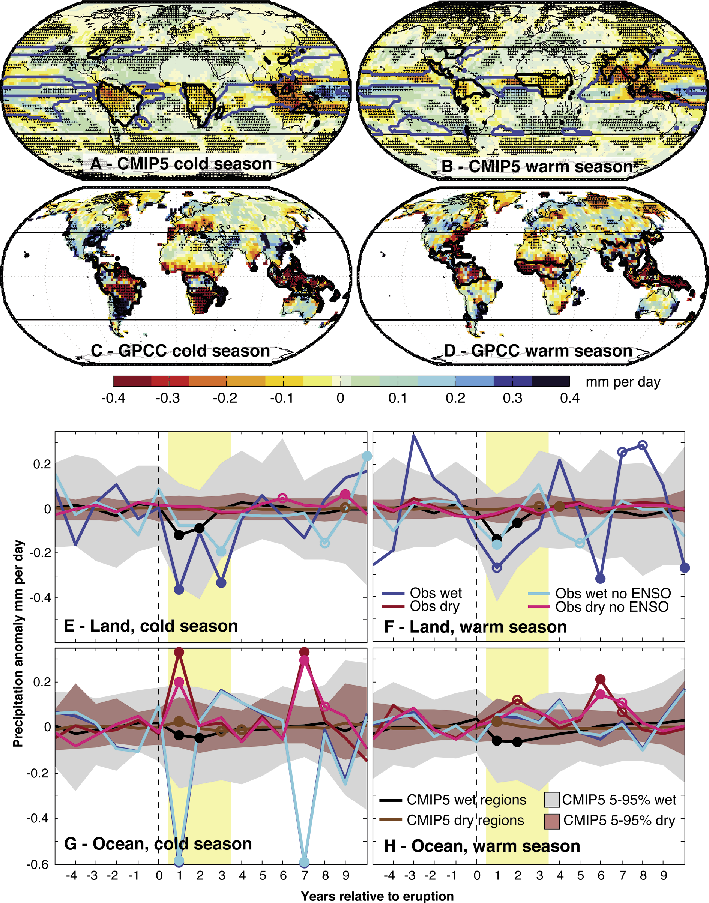
Figures 2a-d show the spatial patterns of precipitation response to five 20th-century eruptions (1902 Santa Maria, 1912 Novarupta, 1963 Agung, 1982 El Chichón, and 1991 Pinatubo) for the CMIP5 multi model mean (a,b) and observational gauge data (c,d) for the cold (Nov-April) and warm (May-Oct) seasons. Model simulated precipitation decreases strongly in tropical-subtropical wet regions (contour lines), including in monsoon regions in their summer season (including SE Asia, central Africa, Northern South America, and Indonesia-northern Australia). Surrounding areas get wetter, and high latitudes get drier (Fig. 2a,b). The tropical drying response shifts between seasons, following the migration of the Intertropical Convergence Zone (ITCZ) and monsoon regions. Observational records also show a drying response in monsoon regions, with the exception of Southeast Asia (Fig. 2c,d).
 |
|
Figure 2: Average precipitation response across the first two years following five volcanic eruptions for (A) and (B) CMIP5 multi model mean, (C) and (D) observational data over land. Stippling indicates significance at the 90% level. Contour line denotes tropical-subtropical wet regions, blue for ocean and black for land. (E-H) Precipitation response averaged across wet and dry tropical-subtropical regions. Black line denotes the CMIP5 multi model mean over wet regions; brown for the dry regions. Shading denotes the 5-95% range of the results for individual ensemble members. Blue and red lines are the observed response over the wet and dry regions, respectively, with (darker line) and without (lighter line) the influence of ENSO. Circles indicate significance at the 80% level (open) and 90% level (filled) for post-eruption years. Yellow shading indicates when a response is expected. (A-F) are averaged over 5 eruptions and (G-H) over two (1982, 1991 eruptions). Figure modified from Iles et al. 2014. |
Figures 2e-f show the precipitation response averaged across the wet tropical-subtropical regions and dry regions over land and ocean separately. Wet regions get significantly drier in models and observations over both land and ocean, with the exception of observed ocean precipitation in the warm season. This observational decrease is robust to the removal of the influence of the El Niño Southern Oscillation (ENSO), which also has a large influence on precipitation, tending to shift it from land to ocean during El Niño years. Three of the five 20th-century eruptions examined are followed by El Niño events. Conversely, dry ocean regions get wetter in both the models and the observations, although this phenomenon is less detectible over land. Models appear to underestimate the size of the response in the cold season, with the observations lying outside of the 5-95% range of the ensemble members (Fig 2e,g), a finding confirmed through a detection analysis by Iles et al. (2014). In response to individual eruptions, Iles et al. (2014) found that in the CMIP5 multi model mean, the ITCZ shifts away from the hemisphere with the higher concentration of volcanic aerosols.
A positive phase of the North Atlantic Oscillation (NAO) has been observed on average in the winters following tropical eruptions, with associated winter warming over northern hemispheric continents (e.g. Robock and Mao 1992). Figure 2c shows a positive NAO precipitation pattern in observational data, with drying over southern Europe and wetter conditions over Northern Europe. However, consistent with other studies (e.g. Driscoll et al. 2012), this is not captured in the CMIP5 models (Fig. 2a).
Volcanic eruptions have also been found to affect global streamflow, with a significant decrease observed following the 1991 eruption of Mount Pinatubo, and more moderate decreases following the 1963 Agung and 1982 El Chichón eruptions (Trenberth and Dai 2007). Flow in the Nile and Niger rivers has been observed to decrease following high latitude eruptions (Oman et al. 2006). Recent research suggests a discernible influence of eruptions on observational streamflow records at regional scales over the instrumental period, largely consistent with model-simulated patterns of the precipitation response (Iles and Hegerl 2015).
Conclusion
Volcanic eruptions have caused detectible changes in precipitation. The response appears to be larger than simulated by present climate models, at least in some regions, which contrasts evidence that the temperature response in observations is smaller than simulated (e.g. Schurer et al. 2013), a discrepancy that needs to be understood. When analyzing regional precipitation change, it has proven useful to consider the expected pattern of volcanic response in climate models in order to make best use of the noisy response in observational records. Better understanding of the water cycle response to volcanic eruptions is important in understanding past variations in precipitation and to improve predictions of the impact of future eruptions, as well as that of shortwave geoengineering schemes (e.g. Tilmes et al. 2015), on global water availability.
affiliation
School of Geosciences, University of Edinburgh, UK
contact
Carley E. Iles: carley.ilesed.ac.uk
references
Driscoll S et al. (2012) J Geophys Res 117, doi: 10.1029/2012JD017607
Fischer EM et al. (2007) Geophys Res Lett 34, doi: 10.1029/2006GL027992
Iles C, Hegerl G (2014) Environ Res Lett 9, doi: 10.1088/1748-9326/9/10/104012
Iles C et al. (2013) J Geophys Res Atmos 118: 8770-8786
Miller G et al. (2012) Geophys Res Lett 39, doi:10.1029/2011GL050168
Oman LA et al. (2006) Geophys Res Lett 33, doi:10.1029/2006GL027665
Robock A (2000) Rev Geophys 38: 191-219
Robock A, Mao J (1992) Geophys Res Lett 19: 2405-2408
Schneider D et al. (2009) J Geophys Res Atmos 114, doi: 10.1029/2008JD011222
Schurer AP et al. (2013) J Clim 26: 6954-6973
Stothers R (1984) Science 224: 1191-1198
Tilmes S et al (2015) Geosci Model Dev 8, doi:10.5194/gmd-8-43-2015
Timmreck C (2012) WIREs Clim Change 3: 545-564
Trenberth K, Dai A (2007) Geophys Res Lett 34, doi:10.1029/2007GL030524
Chaochao Gao
High-resolution hydrological reconstructions incorporating multiple proxies from diverse monsoonal regions provide improved understanding of how monsoon precipitation responds to volcanic eruptions and the underlying mechanisms.
Large volcanic eruptions inject sulfate gases into the stratosphere to form aerosols and cool the Earth's surface by reflecting sunlight. This effect on temperature has been well acknowledged and has inspired proposals for stratospheric sulfate aerosol injection as a potential way to reduce global warming. However, precipitation responses to volcanic perturbation, especially in monsoon regions, are just as crucial. Land precipitation and runoff showed a substantial reduction after the 1991 Pinatubo eruption, causing widespread drought for a large number of people in the world (Trenberth and Dai 2007). The 1912 Katmai and 1982 El Chichón eruptions preceded three of the four driest Sahelian summers during the last century, with the last drought attributed to up to 250,000 deaths and 10 million refugees (Haywood et al. 2013).
Ice-core reconstructions (Gao et al. 2008; Sigl et al. 2014) suggest that over the past 2000 years, volcanic eruptions can be even larger than the aforementioned events. For example, the 1257 Samalas, 1452-53 Kuwae and 1815 Tambora eruptions are estimated to have produced three to eight times more sulfate aerosols than Pinatubo. What impact did these historical eruptions have on the monsoon system? And what are the underlying mechanisms at work?
Multi-proxy evidence of volcanic monsoon influence
Recent progress on paleo-hydrological reconstructions provides a great opportunity to tackle these questions. Derived from over 300 precipitation, sensitive tree-ring records, the Monsoon Asia Drought Atlas (MADA; Cook et al. 2010) offers a major reconstruction of summer monsoon precipitation over the past seven centuries in Asia. Using MADA, Anchukaitis et al. (2010) found conditions drying significantly in eastern and northern China, but wetter conditions in Southeast Asia, after large volcanic eruptions. The South Asian summer monsoon index (SASMI; Shi et al. 2014), based on 15 tree-ring chronologies, also shows that volcanic perturbations lead to a weak South Asian summer monsoon in the second post-eruption year. This, in combination with temperature reductions, may be responsible for 69% of the historical droughts and famines in India over the last millennium (Shi et al. 2014).
 |
|
Figure 1: A Compendium of Chinese Meteorological Records of the Last 3,000 Years compiles the most comprehensive collection of Chinese official records including state annals, provincial annals, and county annals. |
 |
|
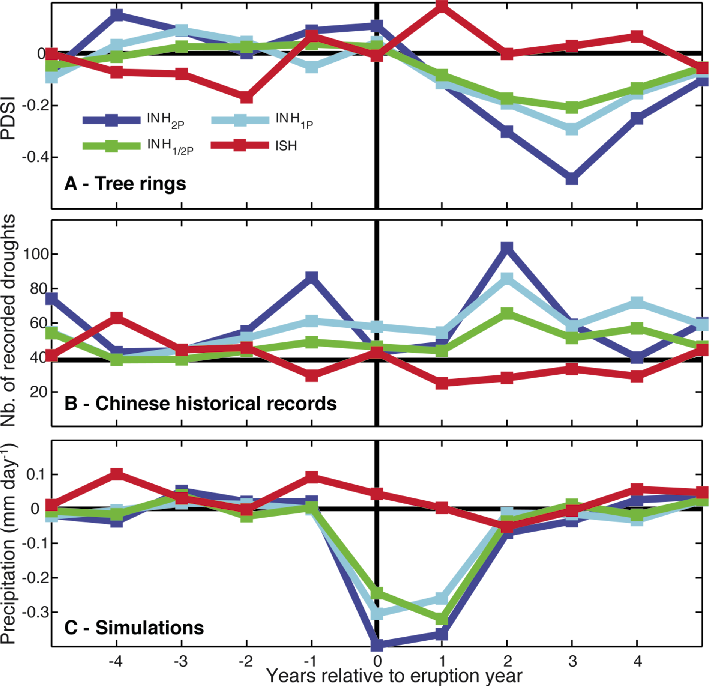
Figure 2: Average summer rainfall response in China to volcanic perturbations, revealed from (A) tree rings (Monsoon Asia Drought Atlas), (B) Chinese historical records (CHI), and (C) CESM and CCSM4 millennium simulations. Plotted are the superposed epoch analysis results for eruptions with Northern Hemisphere sulfate injection of more than half (INH1/2P), equal (INH1P), and double (INH2P) that of the 1991 Pinatubo eruption and SH-only (ISH) injection during AD 1300-1850. (A) and (B) are adapted from Zhuo et al. (2014); (C) is the precipitation anomaly with respect to the AD 1300-1850 mean. |
Historical documents offer another independent line of evidence, and one of the best-preserved historical archives can be found in China. Shen et al. (2007) compiled a 500-year drought and flood index from historical rainfall descriptions in 120 stations across China, and found that the three most severe drought events in eastern China were triggered or amplified by volcanic eruptions. Zhuo et al. (2014) took the disaster records from a comprehensive collection of county, provincial, and state annals, and compiled an annual and county specific drought index over China for the past 700 years (Fig. 1). Overlapping MADA and this human archive with two independent multi-ice-core reconstructions of past volcanism, they studied the effects of volcanic eruptions on monsoon China over the past seven centuries. They found that large Northern Hemisphere eruptions cause notable drought in eastern China, and the severity increases with the injected amount of sulfate aerosols (Fig. 2). These Chinese annals adopt uniform recording standards and are rich in precipitation records, and therefore are a direct complement to the tree ring data. Similar studies utilizing historical records were conducted in various monsoon regions such as Sri Lanka and India (Sinha et al. 2011).
Proxy-model comparison and hints about the underlying mechanisms
Iles and Hegerl (2014) showed monsoon regions dried significantly after large volcanic eruptions in the Coupled Model Intercomparison Project Phase 5 (CMIP5-model ensemble results), and Man et al. (2014) reported a coherent summer precipitation reduction centered in central eastern China in the Max Plank Institute Earth System Model. In a preliminary superposed epoch analysis with the Community Earth System Model (CESM) and the Community Climate System Model (CCSM4) millennial outputs, we found a notable (significant at 95% confidence level) summer precipitation decrease in year 0-1 following the eruptions (Fig. 2). Therefore, proxy reconstructions and model simulations tend to agree on the average sign of monsoon response to large eruptions.
The summer monsoon contributes about 70% of the annual rainfall in eastern China, and it is affected by three airflows at 850 hPa: strong southwesterly winds from the Indian summer monsoon, a moderate southeast Asian monsoonal airflow from the west Pacific, and a weak cross-equatorial airflow from Australia. Model simulation shows significant reduction in water-vapor transport by both the southwesterlies and the southeasterlies after large tropical eruptions, therefore suggesting that the mechanism may be that volcanic-induced cooling reduces the zonal and meridional land–sea thermal contrast which leads to a weaker summer monsoon circulation.
Proxy evidence of a volcano-monsoon mechanism
A rapidly emerging body of proxy data (Sinha et al. 2011) suggests that, in addition to acting like a continental scale thermally-driven sea breeze, regional monsoons are interactive components of a singular global system tied to the seasonal migration of the intertropical convergence zone (ITCZ). Cooler temperature anomalies in the extratropical Northern Hemisphere could strengthen the NE trade winds in the Atlantic and Pacific basins, and force a southward shift of the ITCZ (Broccoli et al. 2006). The shift of ITCZ not only suppresses the mean state of the monsoon, but also intensifies the ENSO variability that further weakens the Asian Monsoon (Sinha et al. 2011).
The drying tendency after the Northern Hemisphere eruptions and wetting tendency after Southern Hemisphere ones (Haywood et al. 2013; Zhuo et al. 2014) indicate that volcanic aerosols may move the ITCZ toward the warmer hemisphere. A 500-year stalagmite δ13C reconstruction of rainfall in southern Belize (Ridley et al. 2015) identified nine drying events associated with large Northern Hemisphere eruptions, and conversely increased rainfall after Southern Hemisphere eruptions. As the site is located near the northern edge of the ITCZ and therefore sensitive to even minor shifts in the ITCZ’s position, these results tend to confirm that asymmetric distribution of volcanic aerosols could cause short-lived ITCZ migration to the warmer hemisphere.
On the other hand, Hong et al. (2015) synthesized diverse rainfall archives from both the Asian and Australian monsoon regions and found synchronized retreat of ITCZ in both areas during the Little Ice Age. The authors suggested that a reduction in effective solar irradiance, including volcanically-induced events, supplemented by the unique continent-marine distribution in the west Pacific, could cause a contraction of the ITCZ and reduced seasonal extremes in monsoon moisture transport.
Outlook
Analyzing proxy records provides a valuable approach to exploring the monsoonal response to volcanic perturbations, and for the pre-instrumental period, the only approach. The monsoon region is home to more than half of the world's population, and results from the proxy analyses reveal how damaging volcanic monsoonal responses could be. Nevertheless, proxy reconstructions can be limited by spatial-temporal coverage and the sensitivity towards the parameters under examination. Integrating multiple proxies, including tree rings, ice and lake sediments, speleothems, and historical records, from all of the monsoon regions is therefore crucial to obtaining a better understanding of the impact of volcanic events on the monsoon regime, before the next big eruption or prior to any attempts at climate engineering through deliberate release of sulfate aerosols into the stratosphere.
acknowledgements
This work is supported by the National Key Basic Research Program of China (2015CB953601). Thanks to Alan Robock for his help editing this paper.
affiliation
Department of Environmental Science, Zhejiang University, Hangzhou, China
contact
Chaochao Gao: gaocczju.edu.cn
references
Anchukaitis KJ et al. (2010) Geophys Res Lett 37, doi: 10.1029/2010GL044843
Broccoli AJ et al. (2006) Geophys Res Lett 33, doi:10.1029/2005GL024546
Cook ER et al. (2010) Science 328: 486-489
Gao C (2008) J Geophys Res 113, doi:10.1029/2008JD010239
Haywood J et al. (2013) Nature Clim Change 3: 660-665
Hong Y et al. (2015) Nature Geosci 8: 315-320
Iles CE, Gabriele CH (2014) Environ Res Lett 9, doi:10.1088/1748-9326/9/10/104012
Man W et al. (2014) J Climate 27: 7394-7409
Ridley HE et al. (2015) Nature Geosci 8: 195-200
Shen CM et al. (2007) Clim Change 85: 453-471
Shi F et al. (2014) Sci rep 4, doi: 10.1038/srep06739
Sigl M et al. (2014) Nature Clim Change 4: 693-697
Sinha A et al. (2011) Quat Sci Rev 30: 47-62
Trenberth KE, Dai A (2007) Geophys Res Lett 34, doi: 10.1029/2007GL030524
Scott St. George1 and Kevin J. Anchukaitis2
A debate about volcanic eruptions and missing tree rings has spurred new research into the integrity of tree-ring dating and the impact of exceptionally cold summers on arctic and alpine forests.
On 10 April 1815, Mount Tambora erupted, sending “three columns of flame” into the sky above Sumbawa, Indonesia (Stothers 1984). By the time the volcano returned to slumber, 50 km3 of rock had been vaporized, 71,000 people in Indonesia had died, and roughly 60 Mt of sulfur had been injected into the stratosphere (Oppenheimer 2003). In terms of total atmospheric loading, Tambora ranks as the third-largest volcanic event of the last 1500 years, eclipsed only by the 1257 Samalas and 1453 Kuwae eruptions (Gao et al. 2008).
The brilliant red, purple and orange sunsets seen in London during the following summer and autumn (Stothers 1984) were among the first signs the effects of this eruption would extend far beyond the Dutch East Indies. For many Europeans and North Americans in 1816, aberrant weather became the norm. Snow fell across Quebec, Maine, and New York state in June, mid-summer frosts extended as far south as New Jersey, and incessant cold and rain prevailed across England and central Europe (Oppenheimer 2003). The unseasonable weather, shortened growing season, and widespread crop failures led to 1816 being memorialized as the “Year Without a Summer”.
Exactly how much cooling occurred in 1816 and how much was due to Tambora remains a point of contention nearly two centuries later. Limited instrumental measurements suggest Northern Hemisphere temperatures dipped 0.7 to 0.8°C in 1816 (Stothers, 1984), but few weather stations were active at this time and most were in Europe (D'Arrigo et al. 2013). Both proxy reconstructions and climate simulations show strong cold anomalies in 1816, but some model experiments (Mann et al. 2012) produce more cooling than supported by proxies.
The Year Without a Ring?
The mismatch between proxy reconstructions and climate simulations could be due to one of several potential causes, including estimates of Tambora’s stratospheric aerosol loadings being too high or models exhibiting an excessively strong thermodynamic response to explosive volcanism. But one study proposed that proxies are the root cause of this disagreement and specifically called to question the ability of tree rings to track exceptionally cold years. Mann et al. (2012) argued the Year Without a Summer was so frigid that trees near their thermal limit in arctic and alpine forests remained dormant throughout the entire growing season and, as a result, did not form a ring for that year. If that were so, the ring for 1816 would be missing, paleotemperature estimates for 1816 would be incorrectly based on the 1815 ring, and prior to the Tambora eruption, tree-ring records would have a one-year chronological error.
The “missing 1816” scenario was initially criticized for its implementation of a tree-ring-growth model and a lack of empirical evidence for dating errors in tree-ring chronologies (Anchukaitis et al. 2012). More recently, this debate has provided the motivation for new research investigating how trees react to extreme cold and testing whether extraterrestrial influences on radiocarbon production can be used to corroborate or refute the current tree-ring timeline. In this Highlight article, we report on some of this latest work and discuss its implications for our understanding of Tambora and the sensitivity of the Earth’s climate system to major volcanic eruptions.
Hunting the invisible
Every year, trees in boreal and temperate forests produce a new growth ring. But acute environmental stress, such as moisture deficits, wildfire, or insect attacks, can sometimes cause a portion of the tree’s vascular cambium, the source of new wood, to remain dormant throughout the entire growing season. In those cases, the new growth ring will be discontinuous along the stem, present in some positions (usually near the crown) and absent at others (usually near the ground). The possibility that some years may be missing is one of the main reasons why tree-ring dating is accomplished through pattern-matching and not ring counting.
Perhaps because identifying missing rings is a routine step in chronology building, most tree-ring studies do not report how often they occur or where and when they are common. To address this shortcoming, St. George et al. (2013) produced a synthesis of locally absent rings across the Northern Hemisphere during the last millennium drawing upon 2,359 tree ring-width records. Absent rings did occur frequently across the American Southwest during severe droughts, but were extremely rare in tree-ring records from high-latitude or high-elevation sites. Based on their hemispheric survey, St. George et al. (2013) established that, in order for the “missing 1816” scenario to be valid, a wide swath of the boreal forest would have needed to exhibit a reaction to environmental stress that has never been observed anywhere at any time during the last millennium.
Validating the tree-ring calendar
But what if the 1816 rings were actually missing? Esper et al. (2012) conducted an experiment by modifying several tree-ring density records from Northern Scandinavia and the European Alps so that 1816 was entirely absent, the rings originally placed at 1816 were re-assigned to 1815, and the dates of all prior rings were shifted earlier by one year. The altered tree-ring sequences showed no correspondence with either temperature measurements from early weather stations or a five-century long summer temperature reconstruction for central Europe derived from documentary evidence. They concluded that, unless the tree-ring series, instrumental climate data, and historical reconstructions all share precisely the same dating error, the original tree-ring chronologies must be correct.
D’Arrigo et al (2013) also explored the consequences of making revisions to the tree-ring timeline. Density records from Labrador, Canada and the Scottish Cairngorms are excellent surrogates for summer temperature, but inserting a missing ring at 1816 destroys the correlation between local weather observations made in the late 1700s and early 1800s and the tree-ring series. They also pointed out that the lowest density value in the entire Labrador record occurred in 1816. If we assume that year was missing, this extreme value would be re-assigned to 1815, which was not a particularly cold summer.
The other novel line of evidence affirming the tree-ring calendar emanates from an extraterrestrial source. Miyake et al. (2012) announced that tree rings from two Japanese cedars exhibited a rapid increase in radiocarbon content from AD 774 to 775, and argued this enrichment was evidence of a short-lived global surge in atmospheric 14C production provoked by a cosmic-ray event. The AD 774-775 spike in radiocarbon content has subsequently been detected in Germany (Usoskin et al. 2013), Siberia and California (Jull et al. 2014), the Austrian Alps (Büntgen et al. 2014), and New Zealand (Güttler et al. 2015). Other researchers have argued this radiocarbon excursion was due to a different type of extraterrestrial event, such as an exceptional solar flare, a cometary impact on the sun, or a gamma-ray burst. But regardless of its origin, the fact that the same 14C signature is discernible in chronologies from both temperature- and moisture-limited settings confirms the accuracy of tree-ring dating over (at least) the last twelve centuries.
More tests for the trees?
There are still other ways to verify the fidelity of tree-ring dates prior to the Tambora eruption. Rutherford and Mann (2014) singled out specific tree-ring records they believed to have chronological errors caused by volcanic cooling: Tornetraesk (northern Sweden), Taymir (far-northern Siberia), and the Gulf of Alaska (United States). For those regions or records hypothesized to have been most strongly affected by the Tambora eruption, it may be worthwhile to verify their dating by testing for the presence of the radiocarbon excursion in their AD 775 rings. Dissecting complete trees along their stem, sampling trees that would have been juvenile in 1816, or tracing the 1816 ring from cold, marginal forests to more hospitable environments downslope or towards the forest interior, could also help confirm the integrity of the tree-ring timeline.
But at this point, it is questionable what will be gained by additional efforts expended to refute a hypothesis that 1816 is missing from any portion of the global tree-ring network. Trees growing in high-latitude and high-elevation forests are adapted to cool summers and short growing seasons, and almost never skip rings under any circumstances. Forcing a missing ring at 1816 causes the well-established association between summer temperature and tree-ring width and density at thermally-limited sites to vanish. The ubiquity of the 8th century 14C marker demonstrates the Year Without a Summer was not a year without a ring. It also refutes the proposition that the larger Samalas or Kuwae eruptions caused widespread shutdowns at treeline forests in the Alps, California or northern Siberia.
 |
|
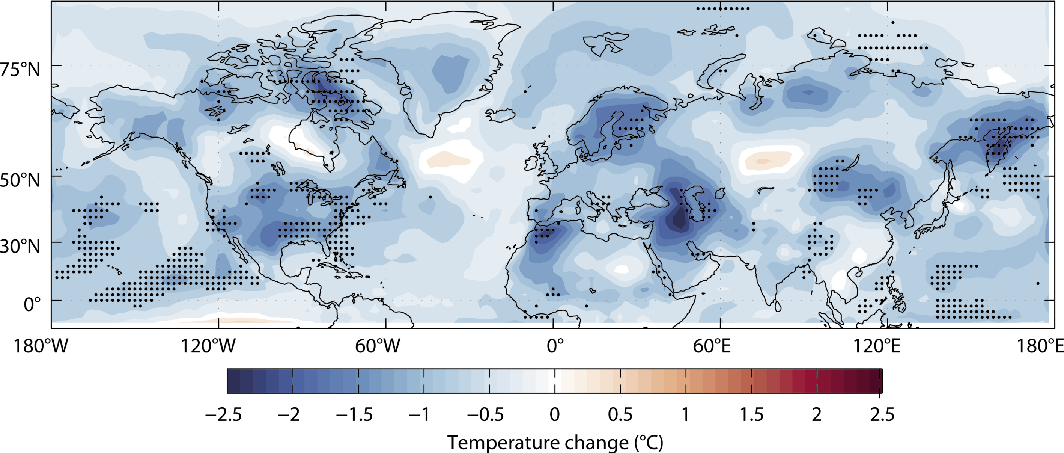
Figure 1: Simulated cooling during the northern summer (JJA) of AD 1816, as estimated by the Coupled Model Intercomparison Project Phase 5 (Taylor et al. 2012). The shading represents the multi-model mean temperature difference between the northern summer of 1816 and 1815, and stippling illustrates locations where at least seven of eight model ensemble members agree on the sign of the temperature change. |
There are many reasons why proxies and models might disagree on the magnitude of cooling caused by Tambora. All models show the Northern Hemisphere was cold during the summer of AD 1816 (Fig. 1) but, at a regional scale, they disagree on the pattern and magnitude of cooling and in some cases run counter to instrumental temperature measurements (for example, in Scandinavia). It is also true that trees are not solely influenced by one aspect of climate but instead integrate the influence of several environmental factors prior to and during the growing season. Because volcanic aerosols enhance the forward scattering of incoming solar radiation, major eruptions might actually cause trees to photosynthesize more efficiently, offsetting the negative effects of short-term cooling. But whatever the source of the apparent differences between proxies and models, an overwhelming body of evidence shows the Tambora eruption did not interrupt the yearly calendar kept by trees around the globe.
affiliations
1Department of Geography, Environment and Society, University of Minnesota, Minneapolis, USA
2School of Geography and Development & Laboratory of Tree Ring Research, Tucson, USA
contact
Scott St. George: stgeorgeumn.edu
references
Anchukaitis KJ et al. (2012) Nat Geosci 5: 836-837
Büntgen U et al. (2014) Nat Clim Chang 4: 404-405
DʼArrigo RD et al. (2013) J Geophys Res Atmos 118: 9000-9010
Esper J et al. (2012) Dendrochronologia 31: 216-222
Gao C et al. (2008) J Geophys Res Atmos 113, do:10.1029/2008JD010239
Güttler D et al. (2015) Earth Planet Sci Lett 411: 290-297
Jull AJT et al. (2014) Geophys Res Lett 41, doi: 10.1002/2014GL059874
Mann ME et al. (2012) Nat Geosci 5: 202-205
Miyake F et al. (2012) Nature 486: 240-242
Oppenheimer C (2003) Prog Phys Geog 27: 230-259
Rutherford S, Mann ME (2014) Nat Clim Change 4: 648-649
St. George S et al. (2013) Geophys Res Lett 40, doi: 10.1002/grl.50743
Stothers RB (1984) Science 224: 1191-1198
Taylor KE et al. (2012) Bull Am Meteorol Soc 93: 485-498
Usoskin IG et al. (2013) Astronom Astrophys 552, doi: 10.1051/0004-6361/201321080
Alexander R. Stine1, M.P. Tingley2 and P. Huybers3
Comparison of the signature of volcanism in tree rings with thermometers indicates that tree rings overestimate volcanic cooling. The timing and spatial expression of the tree-ring response indicate that decreased light availability contributes to the tree-ring response to volcanism.
Volcanic eruptions that loft aerosols into the stratosphere offer natural experiments by which to explore the response of the climate system to short-term changes in radiative forcing. In the one to two years following the largest volcanic eruptions of the past century, we observe a decrease in the solar radiation received at the Earth’s surface, as well as cooler than usual surface temperatures (Robock et al. 2007). Volcanic eruptions also offer an opportunity to explore the response of tree-ring proxies to changes in solar radiation and temperature. Most tree-ring chronologies from temperature-limited high-northern latitude regions show a decrease in tree-ring width or density following a major explosive volcanic eruption. This response has historically been interpreted as an exclusive result of the cooler summertime temperatures that are observed following such eruptions – a cooling that is understood to be induced by scattering from volcanic aerosols in the stratosphere that reduce the amount of shortwave radiation reaching the Earth’s surface.
An emerging line of evidence supports the hypothesis that high-latitude tree-ring growth also responds to variability in light, independent of the influence of light on temperature (Stine and Huybers 2014; Tingley et al. 2014). The notion that large-scale tree-ring growth may respond to changes in photosynthetic light availability is not new (Briffa et al. 1998). Indeed, the well-established Vaganov-Shashkin (VS) model of tree-ring growth includes a term whereby the growth rate is proportional to variations in daily average light intensity (Vaganov et al. 2006).
Here we discuss two lines of evidence for a direct tree-ring response to volcanic dimming. Each relies on aggregating the tree-ring response to large volcanic eruptions over distinct regions of the Arctic, so as to isolate the effects of reduced light from the effects of cooler temperatures (Stine and Huybers 2014; Tingley et al. 2014).
Evidence that light affects trees
 |
|
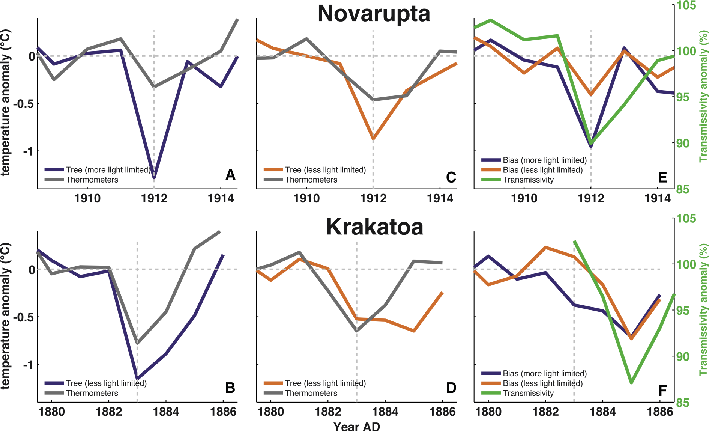
Figure 1: Comparison of the volcanic cooling recorded by boreal tree rings with volcanic cooling recorded by thermometers. Tree rings are calibrated into temperature units using a Bayesian approach (Tingley et al. 2014). Top row shows response for 1912 Novarupta eruption and bottom row for 1883 Krakatoa eruption. (A and B) Comparison for relatively strongly, and (C and D) for relatively weakly light-limited boreal regions. (E and F) The bias in the tree-ring response from regions of relatively strong (blue) and weak (orange) light-limitation compared with the anomaly in atmospheric transmissivity inferred from contemporary pyrheliometers (green; Kimball 1918). |
One line of evidence that tree rings respond to changes in the light environment is provided by comparing the volcanic temperature response inferred from tree rings to that measured by thermometers. Consider the response to the 1883 Krakatoa and 1912 Novarupta eruptions - the two largest eruptions that occurred late enough to be reasonably well-monitored by instrumental thermometers, but early enough to be unaffected by the late-20th century decline in Arctic tree-ring width and density relative to temperature referred to as the divergence phenomenon (Briffa et al. 1998). Both Krakatoa and Novarupta resulted in strong reductions in atmospheric transmissivity, leading to a reduction in surface solar radiation intensity which was recorded by contemporary pyrheliometer measurements (Kimball 1918). In both cases, post-eruption temperature anomalies inferred from tree-ring densities show a larger amplitude response than is consistent with the degree of cooling found in thermometer measurements (Fig. 1; Tingley et al. 2014). Furthermore, the cold bias is larger in magnitude in high-latitude regions where photosynthesis is inferred to be more limited by light (Nemani et al. 2003), supporting the hypothesis that trees respond directly to decreases in light availability. Pyrheliometer measurements indicate that the atmospheric transmissivity was reduced for substantially longer following Krakatoa (~3 years) than following Novarupta (~1 years; Kimball 1918). In both cases the tree-ring cold bias persists for a period similar to the period of reduced atmospheric transmissivity (Fig. 1e,f).
 |
|
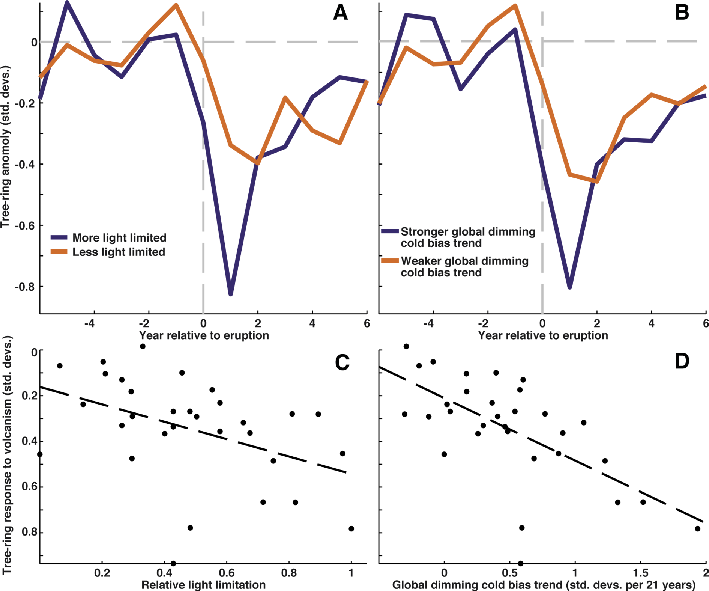
Figure 2: Comparison of the tree-ring density response to volcanic eruptions of the last 700 years with local estimates of light limitation and spatial variability in the response to global dimming (Stine and Huybers 2014). (A) Volcanic response in strongly (blue) and weakly (orange) light-limited regions. (B) Volcanic response in regions with strong (blue) and weak (orange) decline in density relative to temperature during period of global dimming. Comparison of volcanic tree-ring response to (C) light limitation and to (D) global dimming across the boreal region. |
Whereas the instrumental period contains only a small number of eruptions with a clear response in both the instrumental and tree ring records, 32 major eruptions were recorded in the northern hemisphere ice-core record in just the last 700 years (Gao et al. 2007). Across the high-northern latitudes a close correspondence exists between the magnitude of the tree-ring response to volcanism and estimates of the relative importance of light availability in limiting plant growth (Fig. 2c; Nemani et al. 2003). The reduction in tree-ring density following the major volcanic eruptions of the last 700 years was, on average, twice as large in high-northern latitude regions where light-limitation on photosynthesis is strong, compared with regions where light limitation on photosynthesis is weaker (Fig. 2a). Similar results are found for tree-ring widths (Stine and Huybers 2014). The concordance between the volcanic response and patterns of light limitation to growth suggests that, in the boreal regions that are more strongly light limited, tree growth responds directly to both the reduction in temperature and the reduction in photosynthetically available radiation.
Light and growth
There are a number of different frameworks for thinking about the role of light variability in modulating productivity, not all of which can be considered entirely consistent with each other. Manipulation studies have directly shown that tree-ring growth in the tropics increases in response to increased light availability (Graham et al. 2003). The Carnegie Ames Stanford Approach (CASA) carbon cycle model treats productivity as directly proportional to light availability, multiplied by a growth limitation term which may be controlled by temperature or moisture availability depending on local environmental conditions (Potter et al. 1993). The VS model of tree-ring growth incorporates this formulation as well (Vaganov et al. 2006). Satellite-based estimates of productivity assume proportionality to surface insolation and infer the efficiency at which this light is used from the spectra of surface reflectance (Running et al. 2004). Global climate models include light limitation as one of several competing forms of environmental limitation that can modulate carbon uptake. Laboratory-based studies of photosynthesis, in contrast, tend to emphasize the ability of photosynthesis to proceed at a constant rate across a broad range of light intensities (Long et al. 1994).
Global dimming
Two lines of evidence – the spatial pattern of the volcanic tree-ring response, and the difference between this response in tree rings and in thermometer measurements – support the notion that a reduction in solar radiation will lead to a decrease in growth in some tree-ring records.
From 1955-1975, a reduction in shortwave radiation was observed in many regions of the world, including at high-northern latitudes (Wild 2009). Over this same period, tree-ring density in many boreal regions exhibited a negative trend relative to temperature. Interestingly, the pattern of these trends in tree-ring growth relative to temperature is correlated with the pattern of tree-ring density anomalies following volcanic eruptions (Fig. 2b,d).
A competing interpretation exists, which indicates that divergence results from methodological and data treatment decisions (Esper et al. 2010). However, a simulation using synthetic data showed that the imprint of a global dimming on tree-ring growth is more clearly detectable when, instead of using a difference methodology (Esper et al. 2010), a regression approach is employed to isolate non-temperature components in the tree-ring record (Stine and Huybers 2014). This regression approach indicates a significant imprint of global dimming on Arctic tree-ring growth over the period of divergence. Further work testing for the presence of divergence and its characteristics is warranted.
Outlook
The signature of a changing light environment in the tree-ring record implies that tree rings reflect both the climatic cooling in response to volcanism, and, via dimming, the forcing itself. Tree-ring scientists have traditionally worked hard to isolate trees that respond primarily to a single environmental control, maximizing the ability to reconstruct that variable. Increasingly, however, advances in tree-ring science allow interpretation of multiple proxies from the same cores. For example, stable carbon isotope ratios record variability in stomatal conductance, which may be controlled by light availability and moisture stress (Gagen et al. 2011). Wood anatomy measurements of features such as cell lumen area and cell wall thickness, can reveal environmental information distinct from that inferred from tree-ring width. These indications of the contribution of light variability to high-latitude tree-ring records makes it only more important that tree-ring scientists continue to develop these new proxies, so that we can more fully separate the signature of light variability from temperature variability in the tree-ring record.
affiliations
1Department of Earth & Climate Sciences, San Francisco State University, USA
2Department of Statistics and Department of Meteorology, Penn State University, State College, USA
3Department of Earth and Planetary Sciences, Harvard University, Cambridge, USA
contact
Alexander Stine: stinesfsu.edu
references
Briffa K et al. (1998) Nature 391: 678-682
Esper J et al. (2010) Global Change Biol 16: 386-398
Gagen M et al. (2011) Geophys Res Lett 38: L05701
Gao C et al. (2007) J of Geophys Res 112, doi:10.1029/2006JD007461
Graham E et al. (2003) PNAS 100: 572-576
Kimball H (1918) Mont Weather Rev 46: 355-356
Long S et al. (1994) Annu Rev Plant Biol 45: 633-662
Nemani R et al. (2003) Science 300: 1560-1563
Potter C et al. (1993) Global Biogeochem Cycles 7: 811-841
Robock A (2007) Rev Geophys 45: 191-220
Running S et al. (2004) Bioscience 54: 547-560
Stine A, Huybers P (2014) Nat Commun 5, doi:10.1038/ncomms4836
Tingley M et al. (2014) Geophys Res Lett 41: 7838-7845
Vaganov E et al. (2006) Growth dynamics of conifer tree rings, Springer, 354pp
Olga V. Churakova (Sidorova)1,2,3,4, M. Saurer2, R.T.W. Siegwolf2, M.V. Bryukhanova4,6, T. Boettger5, M.M. Naurzbaev4, V.S. Myglan6, O.V. Naumova4,6, D.V. Ovchinnikov4, M. Stoffel1,7, E.A. Vaganov4,6 and M.K. Hughes8
The AD 536 volcanic eruption caused a drastic decrease in tree-ring widths, cell wall thickness, carbon and oxygen isotopic values in larch tree cellulose, and frost-ring formation, effects which are without an analogue over the past 2000 years in Siberia.
The new annual ice-core chronologies for volcanic sulfate in Greenland and Antarctica (Larsen et al. 2008; Sigl et al. 2014) can be compared with the annually dated Siberian (Russian) tree-ring chronologies to investigate the impact of major volcanic eruptions that occurred around AD 536.
 |
|
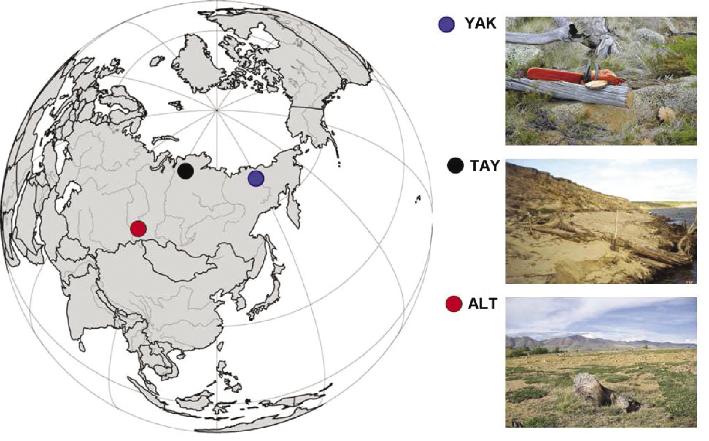
Figure 1: Map with locations and photos of the study regions in the high-latitude sites in northeastern Yakutia (69°N, 148°E; YAK), Taymir Penninsula (70°N, 103°E; TAY), and high-altitude site in the Russian Altai (50°N, 89°E; ALT). |
We discuss the effects of volcanic eruptions on trees growing in the permafrost zone in Siberia and the trees’ physiological response to such extreme environmental events. Using multiple lines of evidence, we discuss how tree-ring width (TRW), cell wall thicknesses (CWT), and stable carbon (δ13C) and oxygen (δ18O) isotopes in tree-ring cellulose of larch trees were affected by extreme climate conditions during the period AD 516-560. We analyze the response of Siberian trees growing at the high-latitude sites in northeastern Yakutia (YAK; Sidorova and Naurzbaev 2002), eastern Taimyr Peninsula (TAY; Naurzbaev et al. 2002), and at a high-altitude site in the Russian Altai (ALT; Myglan et al. 2009; Fig. 1) to climatic changes after the major volcanic eruption of AD 536, which has no analogue over the past 2000 years in Siberia (Churakova (Sidorova) 2014), with the aim of improving our understanding of the physiological adaptation of trees to extreme environmental impacts.
Many scientists have investigated the “AD 536 dust-veil or unknown event” (e.g. Stothers 1984). This volcanic event likely lead to one of the most severe cold episodes in the Northern Hemisphere high-latitudes during the last two millennia (Briffa et al. 1998; Larsen et al. 2008), is despite the fact that ice-core acidity records from Antarctica suggest that, globally, much stronger volcanic peaks occurred at other times (Plummer et al. 2012).
 |
|
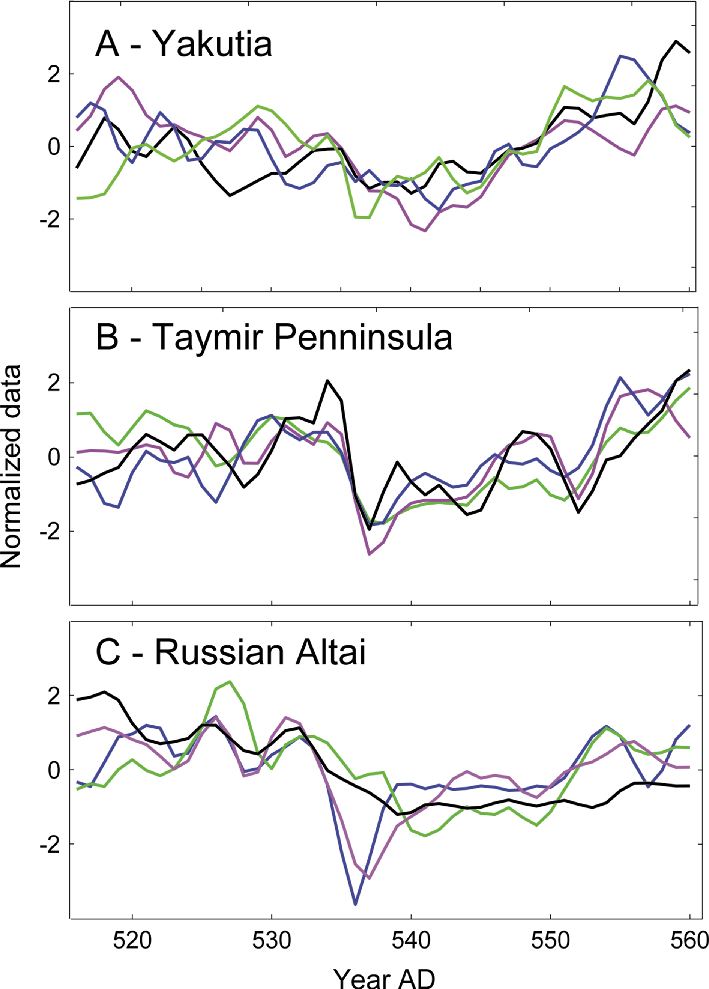
Figure 2: Normalized by 3-year smoothed δ13C (green), δ18O (blue), tree-ring width index (black), and cell wall thickness (pink) chronologies for the three study regions (A) Yakutia (YAK), (B) Taymir Penninsula (TAY), and (C) Russian Altai (ALT). |
Tree-ring width and stable carbon and oxygen isotope composition (δ13C and δ18O) are indicators for both temperature and moisture regime changes, where fractionation processes during CO2uptake are important for δ13C, while for δ18O changes in the soil and leaf water isotope ratio are determining factors (McCarroll and Loader 2004). We hypothesized that the volcanic eruption of AD 536 would lead to strong decreases in tree-ring width and cell wall thickness as a result of the combined effect of reduced incoming solar radiation and related temperature decrease. In addition, we assumed that the temperature decrease and reduced vapor pressure deficit could have led to decreased stable carbon and oxygen isotopic ratios in tree rings for both high-latitude and high-altitude sites. To test our hypothesis, we examined our tree-ring width chronologies from 21 years before and 24 years after the AD 536 event. They showed a pronounced narrowing of tree-ring widths from well-replicated, >2000 year-long chronologies. TRW, CWT, δ13C, and δ18O isotope chronologies were measured on four cross-sections of relict wood at each site (Fig. 2).
Differences in tree response among the study sites
At all three studied sites, we observed that the period AD 516-560 was characterized by the strongest decrease in tree radial growth over the past 2000 years (Churakova (Sidorova) et al. 2014). The strikingly low δ18O values at ALT in AD 536 (Fig. 2) reflect a low condensation temperature of precipitation water supplied to trees. Furthermore, low temperatures lead to low vapor pressure deficit and thus to low needle water enrichment. This δ18O leaf water signal is transferred to the cellulose, although part of the leaf oxygen isotope enrichment is lost in the stem during cellulose formation by the exchange with less enriched xylem water. Low δ18O values in cellulose associated with thin cell walls and a low numbers of cells (in AD 536 only two cells were counted) indicate that reconstructed June-July air temperatures dropped by ca. 4ºC relative to the mean June-July air temperature which was around 9ºC at YAK for the last 2000 years (Sidorova et al. 2005; Churakova (Sidorova) et al., unpublished data).
The tree's response to decreased light intensity and low temperatures caused by volcanic dust veils is also visible in ring width, but with a delay of three years, which may be due to the ability of the trees to use their carbohydrate reserves during early wood formation.
At the high-elevation ALT site, there was no clear reduction of TRW after AD 536, although the lowest values are observed in AD 539. There were reductions in CWT (AD 537) and, rather dramatically, in δ18O cellulose for the year of AD 536, which rebounded strongly the next year. This is a clear difference between the sites near the northern tree limit, and the more southern, high-elevation site. Although the AD 536 event has not been recorded immediately in the TRW series at ALT, it would be associated with low maximum latewood density given the observed low cell wall thickness in AD 536 and AD 537 (Churakova (Sidorova) et al., unpublished data).
The advantage of multi-proxy studies
The study of multiple parameters like tree-ring width, latewood density, cell wall thickness and stables isotopes in tree rings from markedly different locations provides new insight into understanding the effects of volcanic eruptions in eco-physiological and climatological aspects. In particular, increased δ13C indicates drought or high vapor pressure deficit, which is often coupled with limited water availability, while decreased δ13C is an indicator for cold and moist conditions during the growing season. Reduced light intensity, as produced by a volcanic dust veil, can reduce photosynthesis, which will lead to an increase in the leaf intercellular CO2 concentration, and thus also lower δ13C (Farquhar et al. 1989). Therefore, if we take reduced δ13C as an indication of stress in the trees, we can infer stressed growth conditions at both northern sites, but less so at ALT, in AD 536. This is consistent with the very low tree-ring widths in the North in those years, and frost rings at ALT in AD 536. The strikingly low cellulose δ18O values (20‰, compared with the mean value 28.1‰ for the period from AD 520 to AD 560) at ALT in AD 536, associated with thin cell walls, strongly indicates a very cold or short growing season, even though the response in ring width is delayed by three years.
At the two sites closest to the northern limit of tree growth on the Taimyr Peninsula and in northeastern Yakutia, sharp declines of already small tree-ring widths, latewood density, and cell wall thickness occur in AD 536, and are accompanied by simultaneous drops in cellulose δ13C. At the high-elevation, more southern Altai site, the reduction in TRW was delayed by three years, whereas very low values of δ18O in AD 536, and reduced cell wall thickness in AD 536 and AD 537 (Churakova (Sidorova) et al. 2014).
Tree-ring parameters such as tree-ring width, cell wall thicknesses, and stable carbon and oxygen isotopes in tree cellulose, compared with other multi-proxy records such as ice cores and historical archives are useful proxies and complement each other perfectly. Using a multi-proxy approach would help to improve the quality of climate reconstructions in the past.
acknowledgements
We dedicate this article to our co-author Mukhtar M. Naurzbaev, who sadly is not with us anymore. Not only will we remember him for his enthusiasm for subarctic forest ecosystem research, and for searching for and sampling long living trees in Taimyr and Yakutia, but, first and foremost, as a respected and helpful colleague and friend.
This research was supported by the grants Marie-Curie IIF EU_ISOTREC 235122 and ELVEC, ERA net RUS project to O. Sidorova, Scientific School 3297.2014.4 to E.A. Vaganov, and US NSF ATM-0308525 to M.K. Hughes.
affiliations
1Dendrolab.ch, University of Bern, Switzerland
2Paul Scherrer Institute, Villigen, Switzerland
3Institute of Terrestrial Ecosystem, ETH Zürich, Switzerland
4V.N. Sukachev Institute of Forest SB RAS, Krasnoyarsk, Russia
5Helmholz Zentrum, Halle/Saale, Germany
6Siberian Federal University, Krasnoyarsk, Russia
7Institute for Environmental Sciences, University of Geneva, Switzerland
8Laboratory of Tree-Ring Research, University of Arizona, Tucson, USA
contact
Olga Churakova (Sidorova): olga.churakovageo.unibe.ch
references
Briffa K et al. (1998) Nature 391: 678-682
Churakova (Sidorova) O et al. (2014) Global Planet Change 122: 140-150
Farquhar GD et al. (1989) Annu Rev Plant Physiol Plant Mol Biol 40: 503-537
Larsen LB et al. (2008) Geophys Res Lett 35, doi:10.1029/2007GL032450
McCaroll D et al. (2004) Quat Sci Rev 23: 771-801
Myglan et al. (2009) Seriya Geogr 6: 70-77
Naurzbaev et al. (2002) Holocene 12: 727-736
Plummer CT et al. (2012) Clim Past 8: 1929-1940
Sidorova OV, Naurzbaev MM (2002) Russian Forest Management 2: 73-75
Sidorova et al. (2005) Prob ecolo monit ecosys model 20: 60-72
Michael J. Puma1,2, S. Chon3 and Y. Wada1,2
A better understanding of volcanic impacts on crops is urgently needed, as volcanic eruptions and the associated climate anomalies can cause unanticipated shocks to food production. Such shocks are a major concern given the fragility of the global food system.
Our global food system will face great pressures in the coming decades due to increases in food demand, depletion of groundwater resources in major agricultural regions, and possibly more extreme weather anomalies as the climate changes (e.g. Godfray et al. 2010; Foley et al. 2011). A suite of strategies has been proposed to deal with these challenges, which includes increasing crop yields on underperforming lands, improving the efficiency of agricultural resources use (i.e. water, fertilizers and pesticides), changing diets, and reducing food waste (Foley et al. 2011). While these strategies are sound, they do not directly address the vulnerability of the global food system to major food supply disruptions.
Any substantial disruption to the world’s food supply would, all else being equal, lead to spikes in food prices. International food trade is vulnerable to such price fluctuations, especially because countries are likely to impose trade restrictions to protect domestic markets (as happened during the 2008 global food crisis). Such trade restrictions could propagate through the system, causing a systemic disruption to global food supply. Consequently, catastrophic shortages in national-level food supply can occur, because many countries depend on international trade for even their staple food supply (Puma et al. 2015). From this perspective, the global food system can be regarded as a fragile system that is susceptible to systemic disruptions.
Extremes and volcanic eruptions
Crops are highly sensitive to extreme climate anomalies including floods, droughts, and high and low temperatures. Farmers do have the ability to deal with some weather and inter-annual climate variability, depending on local farming practices, infrastructure, and experience (Gornall et al. 2010). However, there are important limits to their coping capacity. For example, if sudden temperature extremes coincide with critical stages of plant development (e.g. the flowering stage), crop yields reduce dramatically (e.g. Gornall et al. 2010). Likewise, regional precipitation shifts in monsoon Asia can lead to substantial crop losses, especially considering the highly concentrated rice production in this region.
Large volcanic eruptions are known to cause extreme climate and weather variations (e.g. Volcanic Explosivity Index, VEI ≥ 4); however, the climate response is known to vary substantially (e.g. Kasatkina et al. 2013), depending on numerous factors including the location of the volcanic eruption, the eruption’s VEI, the timing and duration of the eruption, and the baseline state of the climate system (e.g. El Niño Southern Oscillation (ENSO) or Pacific Decadal Oscillation phase).
Methods
We explore the potential impacts of historic volcanic eruptions on the contemporary global food system by: (1) selecting major volcanic eruptions over the past millennium that likely contributed to climate anomalies associated with significant crop failures; (2) identifying the geographic regions that were impacted by the associated climate anomalies; and (3) estimating present-day crop production that would potentially be affected based on the historical extent of these anomalies.
 |
|
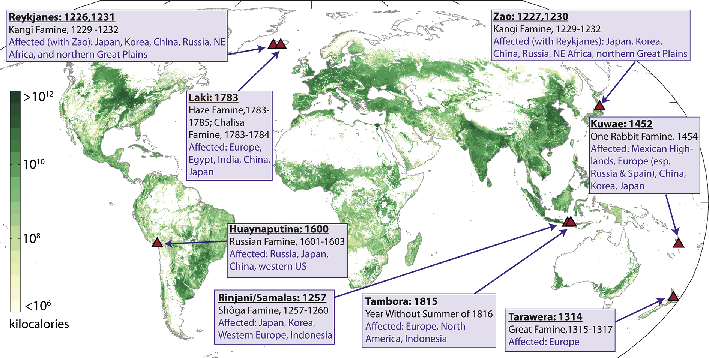
Figure 1: Crop production and select volcanic eruptions (with associated famines and crop failures) over the last millennium that had major impacts on food supplies. Global crop production for the year 2005 in kilocalories based on SPAM (You et al. 2014) and estimates of the caloric content of different crops from UN’s Food and Agriculture Organization. |
 |
|
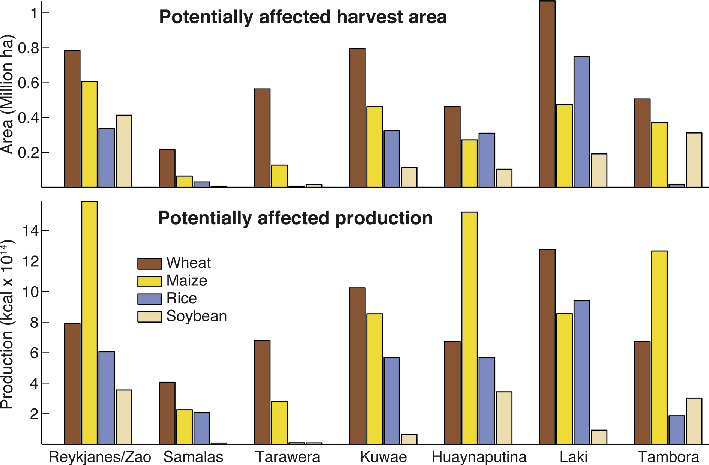
Figure 2: Potential impacts of historical volcanic eruptions on contemporary global wheat, maize, rice, and soybean. (Top) Harvest area and (bottom) crop production that would potentially be affected if the severe historical weather anomalies, associated with the identified historical volcanic eruptions, affected each crop. To put these numbers in perspective, the potential annual production losses from the Laki eruption are equivalent to the annual food consumption of 2.9 billion people on a caloric basis, assuming a diet of 2940 kcal per capita per day (world average for 2015; www.who.int/nutrition/topics/3_foodconsumption/en/). |
To estimate the potentially affected crop production, we use the Spatial Production Allocation Model (SPAM; You et al. 2014). This model produces an estimate of global harvest area and crop production for 42 crop groups at a five-minute resolution for the year 2005. These production estimates are in metric tons, which we then convert to calories in order to aggregate the different crop groups. In Figure 1, we present total crop production for the world’s main food crops (wheat, maize, rice, soybean, potato, cassava, etc.). Next, we compute the potential impacts by identifying regions that experienced historic crop failures and then summing modern-day country-level harvest area and production values for the set of affected countries (Fig. 2).
Selected historical events
We select a total of seven historical periods with widespread weather extremes and crop losses that have been linked to volcanic eruptions (Fig. 1). We emphasize that these volcanic eruptions were not likely the sole cause of the weather anomalies. The interactions of volcanic emissions with large-scale climate patterns such as ENSO are likely to have contributed to each event.
The earliest period of major crop losses and famine that we consider is AD 1227-1232 (Atwell 2001). Three volcanoes, in particular, are thought to have contributed to climate anomalies: Iceland’s Mt. Reykjanes and Mt. Reykjaneshryggur erupted in 1226 and 1231, respectively, and Japan’s Mt. Zao in Japan erupted in AD 1227 and 1230. Extreme flooding, drought, and temperature fluctuations impacted crop production throughout the Northern Hemisphere. Later in the 13th century, another period (AD 1257-1260) of anomalous climate occurred in response to the 1257 eruption of the Samalas volcano on Lombok Island, Indonesia (Lavigne et al. 2013). Contemporary historical sources reveal that an unprecedented cold summer and extreme flooding affected crops throughout Western Europe and part of Asia (Stothers 2000).
One of the more speculative connections is the link between the multi-year eruption episode of Mt. Tarawera (Nairn et al. 2004) and Europe’s Great Famine of AD 1315-1317. During this period, anomalous wet and cool conditions devastated crops throughout Europe, especially the torrential downpours of the summer of 1315 (Lucas 1930). A better link has been established between the eruption of Mt. Kuwae, Vanuatu and weather anomalies in Europe, East Asia, and Mexico, although a strong warm ENSO event and other volcanic activity could jointly be responsible for the anomalies (Briffa et al. 1998; Atwell 2001). Later, Peru’s Mt. Huaynaputina erupted in 1601, which likely contributed to what might have been the coldest Northern Hemisphere summer in the past 600 years (Atwell 2001).
The most recent volcanic eruptions considered here are Iceland’s Laki and Indonesia’s Tambora eruptions. The 1783 Laki eruption produced a dry fog veil that spread throughout much of the Northern Hemisphere, causing unusual and extreme weather throughout (Thordarson 2009). In 1815, Tambora erupted resulting in severe local and global impacts. In North America and Europe, the summer of 1816 was extremely cold, resulting in a devastating famine throughout Europe (Oppenheimer 2003).
Possible impacts on today’s crops
In Figure 2, we present the harvest area and production of the world’s major crops (wheat, maize, rice and soybean) that would be potentially affected by each of the historical volcanic eruptions should they happen today. Potential crop impacts vary substantially across the volcanic events, depending on spatial distribution of the climate anomalies and crop production. For example, the impacts of the Mt. Reykjanes and Zao eruptions would potentially be greatest for maize, while the Laki eruption would be largest for wheat and rice. Although we would generally not expect total crop failure, even if failure in the affected regions were a small percentage (say 10%), we should expect to see spikes in global food prices.
Outlook
Volcanic eruptions are a threat to the global food system. History has shown that these sudden, unpredictable events can severely disrupt crop production across the globe. Unfortunately, the global food system is not well-positioned to deal with such disruptions, especially considering the tight relationship between global food supply and demand (Rosegrant et al. 2013). New research is needed, which combines our understanding of the global food system as a complex interconnected network with our improving insight into volcanic impacts on climate and crops. These findings must then be incorporated into food policies at the national and global levels.
affiliations
1Center for Climate Systems Research, Columbia University, New York, USA
2NASA Goddard Institute for Space Studies, New York, USA
3Korea Volunteer Organization International, Jongno-gu Seoul, Republic of Korea
contact
Michael J. Puma: mjp38columbia.edu
references
Atwell WS (2001) J World Hist 12: 29-98
Briffa KR et al. (1998) Nature 393: 450-455
Foley JA et al. (2011) Nature 478: 337-342
Godfray HC et al. (2010) Science 327: 812-818
Gornall J et al. (2010) Phil Trans R Soc B 365: 2973-2989
Kasatkina E et al. (2013) Izv Atmos Ocean Phys 49: 432-438
Lavigne F et al. (2013) Proc Natl Acad Sci USA 110: 16742-16747
Lucas HS (1930) Speculum 5: 343-377
Nairn I et al. (2004) J Volcanol Geotherm Res 131: 265-294
Oppenheimer C (2003) Prog Phys Geogr 27: 230-259
Puma MJ et al. (2015) Environ Res Lett 10, doi: 10.1088/1748-9326/10/2/024007
Rosegrant MW et al. (2013) Am J Agric Econ 95: 303-309
Alan Robock
While we understand much about how the climate system responds to volcanic eruptions, there are still a number of outstanding research questions, including on aerosol microphysics, observational capabilities, and climate responses on seasonal to century time scales.
On the 200th anniversary of the largest volcanic eruption of the past 500 years, that of Mt. Tambora in Indonesia, it might be useful to summarize what we still do not know about the impacts of volcanic eruptions on climate. That the April 10, 1815 Tambora eruption was responsible for the 1816 “Year Without a Summer” is well accepted, as large volcanic eruptions produce stratospheric sulfate aerosol clouds that reflect sunlight and cool Earth. Lord Byron wrote Darkness, Mary Shelley wrote Frankenstein, and John Pollidori wrote The Vampyre that summer, inspired by the cold, gloomy weather in Geneva. As I pondered in a review (Robock 1994) of the book by Harington (1992, The Year Without a Summer? World Climate in 1816), “The purpose of the book reviewed here is to address the question of whether Shelley and Byron were making too much of the weather that summer. The summer in New England that year also had extreme weather. Was 1816 truly a ‘Year Without a Summer’ globally or just a local European and New England phenomenon? What were the causes of these extreme climate anomalies? Were they the result of the Tambora volcanic eruption in April 1815, in Indonesia, or caused by solar variations, El Niño/Southern Oscillation (ENSO) events, or random weather variations?”
Many of these details are still unknown. What exactly is the spatial and temporal pattern of response to a large volcanic eruption, and how well will we be able to predict that response in the seasons and years to come once the next one erupts? How well will our current observing system measure the important parameters needed to make this prediction, as well as to understand the important processes? These and many of the questions presented in Robock (2002) are still unanswered. So if you are looking for a Ph.D. dissertation topic or an important scientific question for your next proposal, in addition to the questions above, here are my candidates:
Are stratospheric sulfate aerosols larger following large SO2 injections? This is important because it determines their lifetime and their impact on radiation per unit mass, both of which make larger aerosols have a smaller negative radiative forcing and climate impact. Size also determines their ability to destroy ozone, which would be less for larger particles. This mechanism is also important to understand for evaluating proposals for stratospheric geoengineering. Pinto et al. (1989) provided the theoretical explanation for this process, which was used by Crowley (2000) and Crowley and Unterman (2013) to convert ice core records of sulfate deposition into volcanic radiative forcing, and a number of recent papers have assumed that this theory is true. However, there are no observations to support this theory. How can it be verified?
Did volcanic eruptions at the end of the 13th century, reinforced by the 1452 Kuwae eruption, produce the Little Ice Age? Miller et al. (2012) used observations of ice sheet persistence on Baffin Island and general circulation model (GCM) simulations to propose a mechanism whereby feedbacks between large volcanic cooling and oceanic energy transport into the Arctic Ocean resulted in a colder climatic state after a series of large eruptions. But this mechanism depended on the initial state of the climate model and does not occur in some simulations. So how robust is this mechanism and what are the details of the climate system response?
Why was the summer of 1783 so warm in Europe? Was it caused by the Laki eruption in Iceland? Was it just a coincidence that it was so warm in Europe during the summer of 1783? If it was caused by the Laki eruption, what was the mechanism? Was it radiative, or did the radiative forcing produce a strong southerly advection? How?
Why do climate models have such a hard time producing winter warming over Northern Hemisphere continents after large tropical eruptions? As Stenchikov et al. (2006) and Driscoll et al. (2012) have shown, GCMs have a hard time simulating the observed winter warming (Robock and Mao 1992) following large tropical volcanic eruptions. Why?
Are we ready to monitor the next big volcanic eruption, or geoengineering outdoor experiments or implementation? Specific scientific questions that can be addressed include the size distribution of sulfate aerosol particles, how the aerosols will be transported throughout the stratosphere, and how temperatures change in the stratosphere as a result of the aerosol interactions with shortwave (particularly near IR) and longwave radiation. What observational needs must be met to provide information that would help us produce seasonal and decadal forecasts? Is the total SO2 enough, or do we need more precise measurements of altitude, or the small tephra particles and subsequent sulfate aerosol clouds? If there is an influence on cirrus and other clouds as the sulfate leaves the stratosphere, do we have good enough observations of potential indirect effects on tropospheric clouds? Do we have enough measurements to evaluate changes in the chemical composition of the atmosphere?
How much seasonal, annual, and decadal predictability is possible following a large volcanic eruption? How large does an eruption have to be to produce a detectable response, and how does this depend on the location and time of year of the eruption? Are the amplitudes of global cooling patterns, winter warming, and summer monsoon precipitation reductions linear with respect to stratospheric aerosol loading?
There are still many interesting research questions with respect to volcanic eruptions and climate, and answering them will allow us to be prepared to address the impacts of the next large eruption, and to better separate natural and anthropogenic climate responses from each other.
affiliation
Department of Environmental Sciences, Rutgers University, New Brunswick, USA
contact
Alan Robock: robockenvsci.rutgers.edu
references
Crowley TJ (2000) Science 289: 270-277
Crowley TJ, Unterman MB (2013) Earth Sys Sci Data 5: 187-197
Driscoll S et al. (2012) J Geophys Res 117, doi:10.1029/2012JD017607
Harington CR (1992) The Year Without a Summer? World Climate in 1816, Canadian Museum of Nature, 576 pp
Miller GH et al. (2012) Geophys Res Lett 39, doi:10.1029/2011GL050168
Pinto JR et al. (1989) J Geophys Res 94: 11165-11174
Robock A (1994) Clim Change 26: 105-108
Robock A, Mao J (1992) Geophys Res Lett 19: 2405-2408
Stenchikov G et al. (2006) J Geophys Res 111, doi:10.1029/2005JD006286
Stefan Brönnimann, M. Grosjean, F. Joos, W. Tinner and C. Rohr
Bicentenary of the Great Tambora Eruption, Bern, Switzerland, 7-10 April 2015
In April 1815, the Indonesian volcano Tambora awakened. The main eruption phase starting on 10 April was one of the strongest in recent history. It devastated the island of Sumbawa and killed thousands of people. In the following year, the eruption led to global cooling and to climatic changes in the tropics, Europe, and North America. Disease and famine claimed tens of thousands of lives (Oppenheimer 2003).
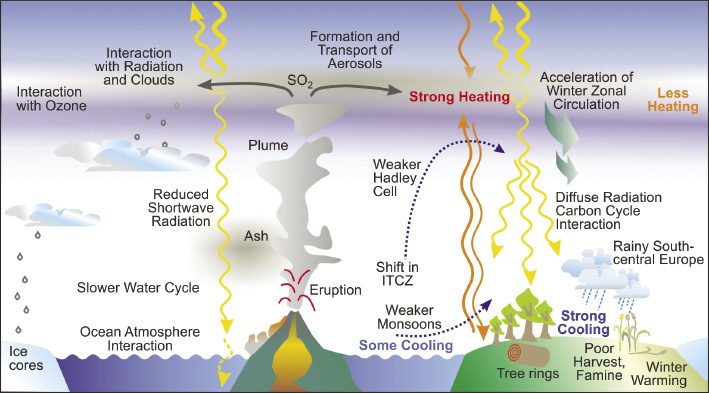 |
|
Figure 1: An Earth system perspective of the 1815 Tambora eruption and its consequences. |
Among the most affected regions was Switzerland, where the cold and rainy summer of 1816 contributed to the last famine. Two hundred years later, on 7-10 April 2015, about 130 scientists gathered in Bern, Switzerland, at an international conference co-funded by PAGES. Even after 200 years, science can learn from analyzing the Tambora eruption and its climatic and societal consequences. However, this requires a comprehensive Earth System perspective (Fig. 1). Correspondingly, the participants came from a broad range of fields, encompassing volcanology, atmospheric physics and chemistry, biogeochemistry, dynamical climatology, paleoclimatology, history, ethnology, and the arts. Only with such combined expertise can the event and all its consequences be understood.
The individual sessions touched on all these aspects. During the 1815 eruption, 30-50 km3 equivalent of dense-rock material was ejected (Self et al. 2004). Around 60 Tg of SO2 reached the stratosphere and formed sulphate aerosols; the cause of the subsequent climatic changes (see SPARC Newsletter 45, 2015, for a conference summary focusing on stratospheric aspects). The hemispheric distribution of aerosols is poorly constrained, although the time of year suggests that the major part went to the Southern Hemisphere. Globally, the top-of-atmosphere radiative forcing of the eruption equaled 5 Wm-2 (Timmreck 2012). The sulphate ultimately entered the troposphere and can be traced in ice cores. The dating of the cores as well as the quantification of sulphur deposition are areas of substantial recent methodological improvement. As to the ability of tree rings to capture volcanic cooling, several contributions showed a clear signal over northern Eurasia. However, it remains unknown why a cooling signature, although well documented in the Northern Hemisphere, is not seen in proxies from the Southern Hemisphere (Neukom et al. 2014).
Several speakers highlighted the Tambora eruption in the context of other strong eruptions of the past millennium. Hubertus Fischer, PAGES Co-chair, explored the interest in the community to engage in a PAGES volcanic forcing working group (PAGES has subsequently launched the VICS working group - pastglobalchanges.org/science/wg/vics/intro).
Reconstructions allow the climate in Europe (and increasingly also other regions) in 1816 to be analyzed. The strongest cooling is found in Western Europe, while data sources disagree on temperatures in Eastern Europe. In the North Atlantic-European sector, sub-daily instrumental observations suffice to address changes in weather and atmospheric circulation. For instance, a dynamical reanalysis of 1815-1817 within the “Twentieth Century Reanalysis” framework was presented (Gilbert Compo, Univ. Colorado/CIRES-NOAA, USA; Philip Brohan, Met Office, UK). Low-pressure weather types and increased cyclonic activity dominated over western France and Switzerland (Auchmann et al. 2012) and caused increased precipitation. For the tropics, information is scant and the effects on the Asian monsoon remain unclear.
In Europe, the summer of 1816 fell into a period of declining temperatures, perhaps in part due to the unknown eruption of 1808 (but solar activity was also weak). Several presentations highlighted the particularly strong effect of double eruptions. In this context, the role of the ocean was also addressed.
Model studies find strong global cooling and stratospheric warming as well as a weakening of the monsoons after Tambora (Kandlbauer et al. 2013). In fact, the weakened African monsoon is a possible cause of rainy summers in South-Central Europe following strong eruptions due to a weakened Hadley circulation, weak subtropical highs, and an altered North Atlantic storm track (Wegmann et al. 2014). Proxies also reveal changes in tropical precipitation after volcanic eruptions, which are interpreted as changes in the Intertropical Convergence Zone.
Tambora also affected the carbon cycle; however, the relative roles of changes in precipitation, temperature, and diffuse radiation (increasing photosynthesis) on carbon stocks remain unclear. The effect of volcanic eruptions on the carbon cycle is an interesting test of our system understanding. The conference also addressed the historical and social aspects as well as the effects on culture and arts. The combination of these aspects is attractive also for a wider audience as evidence by the extensive media coverage of our conference and the bicentenary.
acknowledgements
The meeting was sponsored by the Oeschger Centre for Climate Change Research of the University of Bern, the Swiss National Science Foundation, PAGES, SPARC, the Swiss Academy of Sciences, and the Johanna Dürmüller-Bol Foundation.
affiliations
Oeschger Centre for Climate Change Research, University of Bern, Switzerland
contact
Stefan Brönnimann: stefan.broennimanngiub.unibe.ch
references
Auchmann R et al. (2012) Clim Past 8: 325-335
Kandlbauer J et al. (2013) J Geophys Res 118: 12497-12507
Neukom R et al. (2014) Nat Clim Chan 4: 362-367
Oppenheimer C (2003) Prog Phys Geogr 27: 230-259
Self S et al. (2004) Geophys Res Lett 31, doi:10.1029/2004GL020925
Keely Mills1,2,3 and Peter Gell2
Nottingham, UK, 22-24 April 2015
Forty scientists met at the British Geological Survey (Keyworth, UK) to attend the inaugural workshop of the Aquatic Transitions Working Group. This three-day meeting brought together established and early-career researchers from across Europe, North America, South America, China, South East Asia and Australia to discuss the notion of transitions in aquatic ecosystems, the evidence for regime shifts, and the nature and cause of these shifts, interspersed with many a cautionary tale!
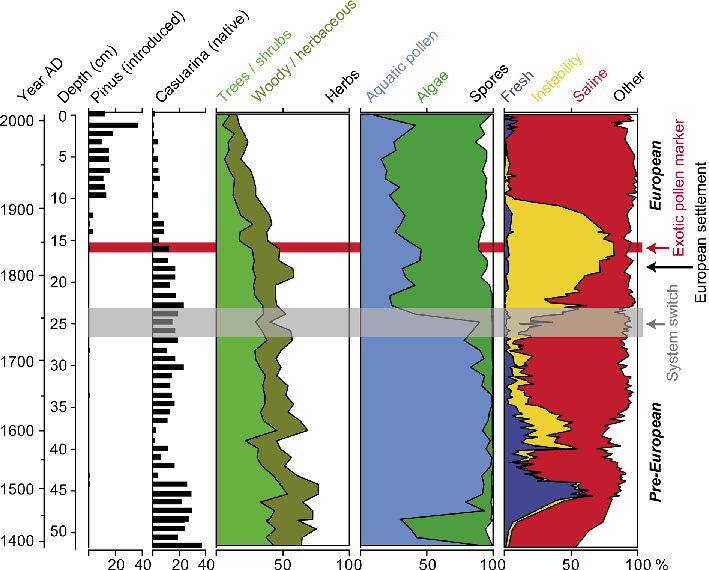 |
|
Figure 1: A summary diagram from Lake Colac (western Victoria, Australia) showing (from left to right) terrestrial plants, aquatic plants, and diatom habitat preferences. Two switches in the lake’s ecosystem are observed: one prior to early European settlement (AD 1750) and one post-AD 1900. This is an example where despite the clear impact of Europeans on the landscape (e.g. decline in native tree taxa [e.g. Casuarina] and the introduction of exotic species [Pinus]), the aquatic ecosystem is resilient to human-caused perturbation and climate change drivers are the overriding dominant signal (Mills and Gell, unpublished data). This work was funded by Land and Water Australia and Rural Industries Research and Development Corporation, 2009-2011. |
Human activities have negatively impacted aquatic ecosystems and the services they provide through the release of contaminants and the abstraction and regulation of waters. Coupled with these anthropogenic stressors are those associated with long-term changes in temperature and hydro-climate. Many aquatic systems exhibit a non-linear response to these pressures, with ecosystems either responding abruptly or showing a level of resilience until a (internal) threshold is breached. Many of these observed changes have existed in the past and so research on major transitions in aquatic systems represents a significant field of enquiry that demands contributions from both ecology and paleoecology. Further, long-term records of change provide evidence of the ecosystem dynamics that have occurred in the past leading up to a threshold change and reveal early warning signals that may provide lessons to prioritize intervention measures for future management (Fig. 1).
In light of this, the overarching goal of the Aquatic Transitions Working Group is to integrate regional records of change in aquatic systems to provide a global synthesis of site sensitivity to critical stages of human and natural impact. Specifically, the meeting addressed two major topics:
• First human impact in sediment records – how do we identify them?
• Regime shifts – are people the cause and do sediment records really reveal this?
The workshop design was fluid, but aimed to provide a mix of presentations interspersed with breakout sessions in which participants could discuss the key themes arising from the talks in small groups, and then provide feedback in a wider context to the plenary.
The first presentations were focused on short regional overviews and the recording of ‘first human impact’ in lake sediment records from Europe (Rick Battarbee), Canada (Irene Gregory-Eaves), USA (John Anderson on behalf of Jasmine Saros), South America (Doriedson Gomes), Australia (Peter Gell), China (Xuhui Dong), South-East Asia (Ngoc Nguyen) and Africa (Dirk Verschuren). The final presentations of the day were dedicated to regime shifts in aquatic systems, with a range of examples and explanations from Mike Reid, Rong Wang, Marie Perga, Tom Davidson and Carl Sayer.
This workshop also laid the foundations for the future activities of the working group as a whole. This naturally led to discussions on the collation of databases, papers, and meta-data, but there was also a clear focus on outputs and goals. As a result, a number of papers were tabled and part of the workshop was given over to outlining and planning these. Riding on the wave of a number of future outputs, the drive was on to produce our first tangible output as a working group. With clear leadership (and some perspiration), the group managed to pull together an eleventh-hour session proposal “Sedimentary records of threshold change in ecosystems” for the 2015 AGU Fall Meeting, cementing the support, collaborative spirit, and momentum of those at the meeting.
Looking to the future of Aquatic Transitions, there was a one-day workshop preceding the International Paleolimnology Symposium in Lanzhou (August 2015) to follow up and welcome new collaborators to the group. The next workshop is likely to be held in 2016 in the southern hemisphere. A decision on the exact location will be decided soon.
acknowledgements
We thank PAGES and the British Geological Survey for financial support. Thanks are due to all of the participants who shared their enthusiasm, thoughts, and data across the three days. Finally, a special thanks is extended to the group scribes: Zofia Taranu, Antonia Law, Jean-Philippe Jenny, Elodie Brisset, and Daniel Schillereff.
affiliations
1British Geological Survey, Keyworth, UK
2Water Research Network, Federation University, Ballarat, Australia
3Department of Geography, Loughborough University, UK
contact
Peter Gell: p.gellfederation.edu.au