PAGES Magazine articles
Margit Schwikowski, A. Eichler, T.M. Jenk and I. Mariani
High-alpine ice cores offer great potential to obtain paleorecords with subannual resolution. However, calibration using instrumental data is often only possible at annual to multi-year resolution due to the strongly varying distribution of seasonal snowfall, post-depositional processes, and dating uncertainty.
High-alpine glaciers are generally characterized by high annual snow accumulation rates in the range of half a meter to several meters water equivalent, allowing paleorecords with subannual resolution to be obtained. A number of ice core parameters such as the stable isotope ratio of hydrogen or oxygen in the water (δ2H, δ18O), the concentration of trace components (e.g. ammonium, mineral dust related compounds, black carbon), and the presence of melt layers vary with the seasons and have been used to identify annual layers. These variations are caused by the seasonality of temperature (δ2H, δ18O, melt layers), precipitation (δ2H, δ18O, mineral dust), or atmospheric transport and the emission source strengths of air pollutants (e.g. ammonium; Preunkert et al. 2000). However, even when subannually-resolved ice core records can be obtained, their calibration with climate indices remains difficult.
Layer thinning with depth
 |
|
Figure 1: Annual layer thickness for the Illimani ice core from Bolivia as function of the depth below the ice surface and the associated age of the ice. |
The depth-age relationship of high-alpine glaciers is strongly non-linear as annual layers become thinner with depth. This is due to plastic deformation of the ice under the weight of the overlying mass, resulting in horizontal ice flow that stretches the layers with increasing depth. Thinning rates are particularly high in cold glaciers where the ice is frozen to bedrock, whereas in polythermal glaciers the ice slides down to the ablation area before it thins strongly. Depending on precipitation rates, annual layers in the upper part of the glacier may consist of several meters of firn, whereas in the deeper part flow-induced thinning reduces the layers to a thickness of a few centimeters or even less (Fig. 1). Using analytical methods with high spatial resolution, such as measuring the electrical conductivity of the ice or counting the micro-particles present in dust bands formed during the dry season, over 800 years annual cycles were detect in the Illimani ice core from Bolivia (Knüsel et al. 2003) and up to 1300 years in the Quelccaya ice core from Peru (Thompson et al. 2013). In the future this may be extended even further back in time as recent developments with continuous flow analysis techniques now allow increasing the spatial resolution to the mm scale (Bigler et al. 2011). For this approach, a section of the ice core is melted continuously on a melt head, and the meltwater from the inner part, not contaminated by handling and prevented from contact with the modern environment, is directly fed into the respective analytical instrument to determine the concentration of trace components.
Issues with seasonality and dating
 |
|
Figure 2: Calibration of ice core data (black) with instrumental temperatures (red) at different resolution: (A) Fiescherhorn ice core δ18O and Jungfraujoch (JFJ) temperature (seasonal values; Mariani et al. 2012), Switzerland (B) Illimani ice core NH+4 and HadCRUT3 (Amazon subset: 82-34°W, 12-20°S) temperature (annual values; Kellerhals et al. 2010), Bolivia, and (C) Belukha ice core δ18O and Barnaul (March-November) temperature (10-year averages; Eichler et al. 2009), Russia. |
Due to the strong thinning of annual layers at depth, subannual information is only detectable in the upper part of the record, where ice-core dating can be performed by counting the successive annual layers. However, the seasonality of a recorded climatic variable may vary from year to year, according to meteorological conditions. For example, the minimum temperature as preserved in the Fiescherhorn δ18O record from the Swiss Alps (Fig. 2a) may have occurred in January, February or in some years even in December or March. Also, the stratification of the atmosphere controlling the concentration of ammonium by preventing vertical transport from the emission sources to glacier, which is used to distinguish winter from summer precipitation, may become unstable already in early spring in some years, but not until late spring in others.
Preservation of most parameters occurs only during precipitation. Accordingly the ice core record is strongly discontinuous at sites with high interannual variability of precipitation. In such cases only a precipitation weighted parameter, for example “precipitation weighted temperature”, can be reconstructed (Brönnimann et al. 2013). But in most cases the seasonal distribution of precipitation is unknown for high-alpine sites, hence assumptions have to be made in order to dissect the record into seasonal or monthly data. Either constant seasonal distribution of precipitation is assumed or data from a nearby instrumental station at a lower elevation are used. However, both approaches introduce additional uncertainties to the interpretation of the paleoclimatic record (Mariani et al. 2012; Knüsel et al. 2005; Eichler et al. 2009).
The identification of annual layers can be ambiguous and result in dating uncertainties. Indeed, the formation of clear annual signals is often hampered by post-depositional wind erosion or surface melting and by the strongly varying distribution of snowfall in high-alpine environments. A further complication, which is confined to δ2H or δ18O, is that the record is smoothed by diffusion during the snow-to-ice metamorphosis. In addition to annual layer counting, reference horizons such as the radioactivity peak resulting from nuclear weapon tests in the 1960s or tephra and aerosol layers caused by volcanic eruptions place additional dating constraints. While the measurement of peaks in radioactivity is relatively unambiguous, the identification of volcanic layers is not always straightforward given the high background level of the indicative chemical compounds such as sulfate in mid-latitude and low-latitude glaciers. To our knowledge, volcanic eruptions have not yet been identified in non-polar ice cores prior to AD 1258, probably because no major eruptions occurred for several centuries prior to this date and the volcanic signals cannot be resolved anymore further back in time due to ice layer thinning. Other chronologic methods, such as radiocarbon dating or ice flow modeling, are crucial for dating the lower parts of the records, but have uncertainties far above annual (Jenk et al. 2009; Lüthi and Funk 2000). Accordingly, dating uncertainty beyond the range of reference horizons quickly accumulates to several years and further increases with depth. With that dating uncertainty working at annual resolution becomes meaningless.
Calibrating ice-core records
Calibrating ice-core proxy records directly with instrumental data on an annual timescale is difficult. For example the high accumulation Fiescherhorn site provides paleodata with subannual resolution during the recent time period (1961-2001). Temperature records from the nearby Jungfraujoch station are highly correlated with the Fiescherhorn seasonal δ18O record (Fig. 2a, n=164, r=0.70, p<0.001). However, this correlation is lost after subtracting the seasonal cycle (r=0.09), due to the dating uncertainty of ±1 year and changes in seasonal precipitation.
In fact, only a few studies have successfully calibrated ice-core proxy records directly with instrumental data on an annual timescale (e.g. Kaspari et al. 2007; Kellerhals et al. 2010). An example comes from Illimani ice core, where annual NH+4 concentrations were used as a temperature proxy for the first time (Fig. 2b). Ice core records are often smoothed (e.g. multi-year average) before calibration. This is done to minimize the effect of potential dating offsets of the ice core data from meteorological records. For example, the correlation of the Belukha ice core δ18O record with instrumental temperature data from the Barnaul station (both Russia) was significant only for the 10-year averages but not at higher time resolutions (Fig. 2c; Eichler et al. 2009).
Another attempt to get a more robust dataset with smaller dating uncertainty is to stack several independently dated ice cores (Bohleber et al. 2013). However, even then, the relationship with direct observations from instrumental data is best captured on multi-annual time scales. Accordingly, results and data sets are commonly not presented in subannual and annual resolution.
affiliation
Paul Scherrer Institut and Oeschger Centre for Climate Change Research, University of Bern, Switzerland
contact
Margit Schwikowski: margit.schwikowski psi.ch
selected references
Full reference list under: pastglobalchanges.org/products/newsletters/ref2014_1.pdf
Bigler M et al. (2011) Environ Sci Technol 45: 4483-4489
Bohleber P et al. (2013) Tellus B 65, doi: 10.3402/tellusb.v65i0.20148
Eichler A et al. (2009) Geophys Res Lett 36, doi: 10.1029/2008GL035930
Kellerhals T et al. (2010) J Geophys Res 115, doi: 10.1029/2009JD012603
Thomas Hoffmann1, R. Wasson2 and A. Ziegler3
Studying soil erosion and sediment transport is essential to understand human-induced environmental change. In Asia, this research is underrepresented despite pronounced and long-term anthropogenic impact - a new Asian working group on soils and sediments is filling this research gap.
PAGES’ Focus 4 Theme on Soils and Sediments aims at providing understanding of the interactions between climate, human activity, soil erosion and sediment transport in fluvial systems through time. Although focused on the past, this research informs our understanding of the present and the future by documenting trajectories of change, investigating human interactions with fluvial systems, and delivers knowledge to enable societies to meet their goals on sustainable land use and river management.
The Soils and Sediments Theme derived from the former project ”Land Use and Climate Impacts on Fluvial Systems during the period of agriculture” (LUCIFS), which was launched in 1994 (Wasson 1996). Recently, Hoffmann et al. (2010) re-defined its aims as: (1) quantifying land-use and climate change impacts on river-borne fluxes of water, sediment, C, N, and P; (2) identifying their key controls at the catchment scale; and (3) understanding the feedbacks on human society and biogeochemical cycles of long-term changes in the fluxes of these materials. In the same review article, the following research agenda was set out: (1) synthesizing the data available from existing case studies; (2) targeting research in data-poor regions; (3) integrating sediment, C, N and P fluxes; (4) quantifying the relative roles of allogenic and autogenic forcing on fluvial regimes, extreme events and sediment fluxes; (5) improving long-term river basin modeling; and (6) integrating the Theme with other working groups within PAGES.
Research under the banner of the Theme has progressed well in Europe (e.g. Hoffmann et al. 2007; Erkens et al. 2011; Verstreaten et al. 2009), North America (e.g. Trimble 1999; Stinchcomb et al. 2011) and Australia (Fryirs et al. 2007; Fryirs 2013). However, research on the long-term interaction of climate and land use and its impact on soils, sediments and river systems in Asia has lagged, except in China (see the contribution by Ran and Lu, this issue). Much of Asia is therefore a data-poor region in terms of fluvial research. This is critically important since Asia’s physiography and climate supports a disproportionate number of the world’s largest rivers by discharge, and is therefore the source of much of the sediment reaching the global oceans (Syvitski et al. 2005), and a major source of nutrients to the seas (e.g. Green et al. 2004). Moreover, Asia is home to a large fraction of Earth’s people, and is the most rapidly urbanizing region on Earth with growing conurbations on the region’s mega-deltas.
As in Europe, land use by clearing, settled cultivation, and urbanization has a long history in Asia. Also, and unlike in Europe and the Americas, deforestation and settled agriculture are now spreading rapidly in Asian areas previously only slightly impacted by humans. Therefore some catchments have been subjected to multiple episodes of land use impacts over the last millennia, while others are just being impacted for the first time. In principle it should be possible to use records from the long-impacted catchments to anticipate the future trajectories of the still pristine catchments.
With this background in mind a workshop was convened in November 2012, hosted by the National University of Singapore (NUS). Twenty-five participants, including experts from Germany, Singapore, Japan, Malaysia, Indonesia, Australia and Thailand represented the disciplines of archeology, environmental history, geomorphology, hydrology, remote sensing, engineering, soil science, and biogeochemistry. The goal of this meeting was to set up a regional working group on soils and sediments (WGSS) for Asia and to coordinate its activities.
After two days of discussion, the participants reached the following resolutions:
•The Asian-WGSS will be convened and led by Dan Penny (University of Sydney, Australia) and Lu XiXi (NUS).
•Initial efforts will build on existing work in a few case studies: (A) Angkor and the Tonle Sap Lake in Cambodia; (B) the Huang He in China; (C) the Palembang River catchment in Indonesia; (D) the Saru River catchment in Japan and; (E) the Ping River catchment in Thailand.
•A panel discussion on the Asian perspectives on soils and sediments was held at the Asia Oceania Geosciences Society conference in Brisbane in June 2013.
• Further meetings of the Asian WGSS will be held to coordinate activities.
In addition, there was considerable discussion regarding a common strategy for an Asia-wide analysis of human-environmental interaction with a focus on soils, sediments and river systems. Before the recent rise in greenhouse gases, the most profound cause of global human impact during the Holocene was the onset of settled agriculture several thousand years ago, and there is now a call for the beginning of the Anthropocene to be defined by this major change (Balter 2013). The period of settled agriculture would also clearly be a meaningful time scale for Asian WGSS research; however, unlike the boundaries between geological epochs, the onset of settled agriculture is diachronous - which is a problem for stratigraphers, but provides an interesting research question for the WGSS.
 |
|
Figure 1: Amount of land employed for both extensive (A and C) and intensive (B and D) uses as at AD 1 (A and B), and then again in AD 1850 (C and D). The land use patterns were extracted from the animation shown at http://grkapweb1.epfl.ch/pub/KK12_totallanduse.mov (Kaplan et al. 2011). |
Settled agriculture was established in NE China by 8000 BP and in NW South Asia by 7500 BP. It subsequently spread across China and South Asia, arriving in Taiwan about 400 BP, and then extending across the mountains of mainland Southeast Asia, joining with a second wave of agricultural development coming up from South Asia, what is now Myanmar and Thailand, within the last 500 years (Elvin 2004; Elvin and Liu 1998; Wyatt 1984; Stark 2006; Boyle et al. 2011; Kaplan et al. 2011). While there are ancient origins for agriculture in insular SE Asia, the conversion of large areas from native vegetation only occurred within the last few centuries. These usage patterns are wonderfully captured in animated form for the period 8000 BP to 100 BP at http://grkapweb1.epfl.ch/pub/KK12_totallanduse.mov (Kaplan et al. 2011). Figure 1 also shows the amount of land employed for both extensive and intensive uses as at AD 1, when agriculture extended over most of China, South Asia and much of peninsula SE Asia, and then again in AD 1850, when there were few places left not affected by agriculture.
This large-scale conversion into agricultural land continues nowadays in Malaysia and Indonesia with the replacement of lowland rainforest by rubber and oil palm plantations and large-scale deforestation, which began after the Second World War (e.g. De Koninck et al. 2011). Recent research by the NUS has shown that in Johor, southern peninsula Malaysia, conversion of lowland rainforest to rubber and then oil palm plantations in the last ca. 60 years has produced sedimentologic evidence in valley floors, similar to those seen in catchments in Australia and the USA when impacted by the European settlers.
The wave-like development of settled agriculture in much of Asia provides an opportunity for the PAGES Focus 4 Theme on soils and sediments to develop chronologies of disturbance in fluvial networks that have been subject to diachronous agricultural development. These fluvial networks may also have been affected differently by climate variability during the Holocene. For example, the Huang He in northern China was most affected by agriculture and Holocene climate changes, while the rivers of Johor are likely to have been affected mainly by very recent land cover conversion. Similarly, much of the large-scale land-cover change in the montane mainland of SE Asia occurred within the last century.
By studying catchments of similar size and topography, as well as the onset times of settled agriculture in the last 2000 years, it should be possible to determine the impact of agriculture, as climate variability was relatively small during this period. However, for catchments where settled agriculture began in the early Holocene, a climate change signal is to be expected given the mid Holocene experienced the largest shift in climate since the deglaciation. Applying this framework to the Asian working group on soils and sediment will inventory current knowledge of both climate change and agricultural beginnings. The empirical results from such research could be used to test soil erosion and sediment flux models being developed by the “geomorphic prediction” working group (http://geomorphicprediction.geo.arizona.edu). Ultimately, we hope to facilitate a better understanding of fluvial response to land use and climate change in the most populous, biodiverse and dynamic region on Earth.
affiliations
1Department of Geography, University of Bonn, Germany
2Asia Research Institute, National University of Singapore, Singapore
3Geography Department, National University of Singapore, Singapore
contact
Thomas Hoffmann: thomas.hoffmannuni-bonn.de
selected references
Full reference list under: pastglobalchanges.org/products/newsletters/ref2014_1.pdf
Balter M (2013) Science 340: 261-262
Hoffmann T et al. (2010) Global Planet Change 72: 87-98
Stark M (2006) Annu Rev Anthrop 35: 407-432
Dan Penny
Recent archeological and paleoclimatic work indicate that the demise of Angkor – the world’s largest pre-industrial city – was related to tight feedbacks between climatic variability, massive infrastructure, extensive land use, and water and sediment flux.
Angkor, in present-day Cambodia, was primate city to the sprawling Khmer empire from the 9th-15th century AD. Recent and ongoing mapping exercises (Evans et al. 2007; Pottier 1999) have demonstrated that Angkor covered an area in excess of 1000 km2 (Evans et al. 2007). At its peak in the 11-12th centuries AD, the city supported a population of several hundred thousand people. The scale of the settlement implies an enormous environmental footprint, with the widespread conversion of primary forest to intensive bunded rice agriculture, and the systematic modification of natural rivers to stifle the seasonal flood pulse and feed massive reservoirs.
Disrupting infrastructures
 |
|
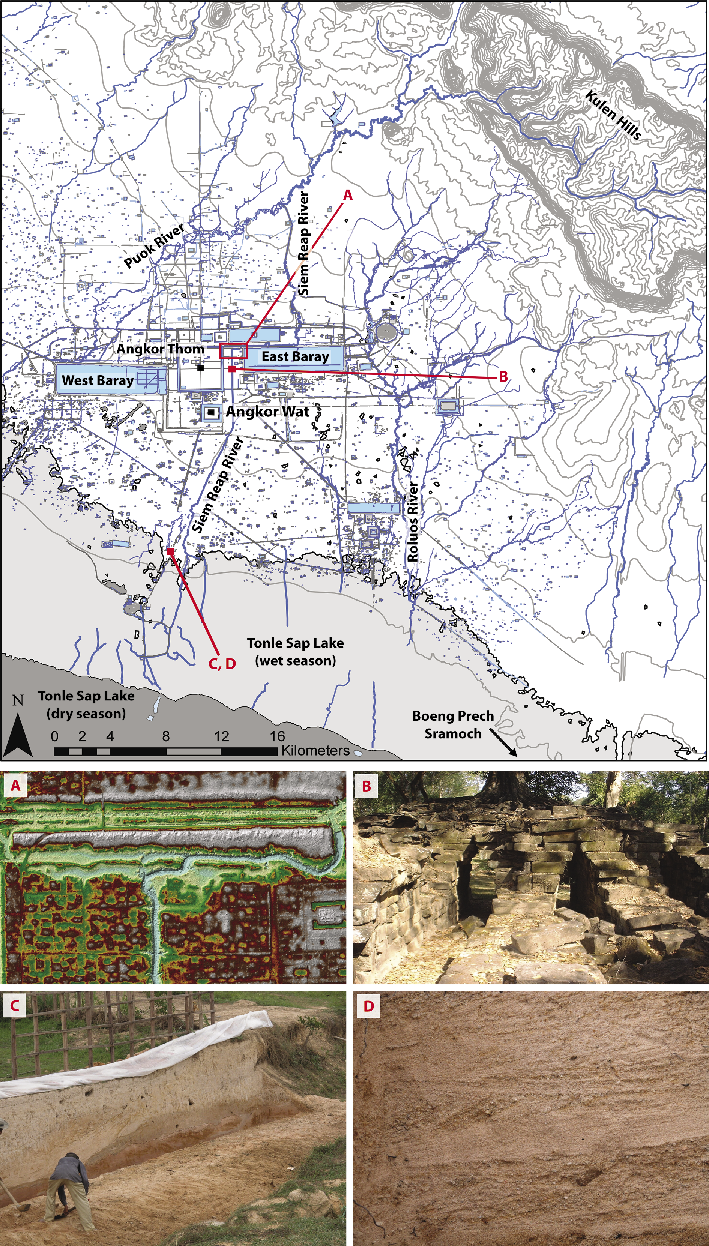
Figure 1: Archeological map of Greater Angkor, emphasizing the complexity of the water management network, and the articulation of canals and rectilinear reservoirs with the natural fluvial network. Data from Evans et al. (2007), Pottier (1999), Mekong River Commission, Japanese International Cooperation Agency. (A) False color digital terrain model derived from a LiDAR point cloud. Erosion caused by uncontrolled water flow through the canal network is clearly apparent as pale blue and green colors. Such water flow events triggered significant vertical incision of the canal bed. Image courtesy of Khmer Archaeology LiDAR Consortium/Damian Evans. (B) Spean Thma (lit. stone bridge), immediately east of the famous walled enclosure of Angkor Thom, once spanned the Siem Reap canal. Destabilization of the canal network during the 14th century caused the canal to incise several meters below the bridge, destroying its eastern half and leaving its western half, seen here, abandoned on the dry canal bed. (C) Many of the ancient canals south of the city, presumably critical in linking the ports at the edge of the lake to the markets in the central urban area, are now filled with several meters of sediment, including coarse (28% by weight) to very-coarse (17%) cross-bedded sand and gravel (D), with the largest clasts > -5 φ, > 32 mm in diameter. These deposits indicate an increase in the flux of sediment and other materials from the canal network, and flows of sufficient energy to entrain them. Post-dating the 14th century, these events broadly coincide with multi-decadal scale drought. |
Angkor developed a large infrastructural system to manipulate surface water and sediment flux (Fig. 1). By the 13th century, the elaborate system of canals, embankments, ponds and reservoirs had become massive, deeply interdependent, brittle and sclerotic (Groslier 1979). In fact, the system had become so large and so complex that it began to exert an inertial force (Fletcher 2011) over the people that built it by effectively reducing the range of strategies they might use in changing circumstances (Groslier 1979) – an historical example of Graham’s “disrupting infrastructures” (Graham 2009). Archeological research within the remains of the system has identified numerous attempts to modify or even destroy existing infrastructure, presumably to maintain some aspect of its function as the system began to break down (Buckley et al. 2010; Fletcher et al. 2008; Lustig et al. 2008; Penny et al. 2005).
Angkor was established on an extremely low relief catchment. Sediment and nutrient flux were therefore controlled by population size and the nature of land-use rather than by slope movement or mass wasting (Wasson 1996). However, the effect of extensive forest conversion to intensive rice agriculture is not clearly reflected in accelerated rates of soil loss and/or sediment accumulation. Equally, there is no empirical evidence to suggest a mechanistic link between accelerating soil erosion in the catchment and the demise of the settlement. In fact, rates of sediment accumulation in depositional basins throughout Angkor are low, an average of < 1 mm a-1, during the Angkorian period. In some cases these were very large basins, the largest being 16 km2 in area, with contribution areas in excess of 200 km2 (Penny et al. 2005). Bunded rice agriculture mimics natural wetlands, and on a low-relief alluvial plain such as in Angkor, extensive agriculture of this kind represents both a sink for sediment and particulate-bound nutrients and an effective buffer between the catchment and its fluvial network. It may be, then, that despite its size the type of land-use at Angkor and the nature of its catchment mitigated the loss of soil from catchment slopes to river channels and canals.
Drought and floods
More dramatic evidence for changing sediment flux is apparent within the network of channels and canals itself. Ad hoc, probably quite localized, modifications had been made to the infrastructural network to maintain water flow and function during prolonged drought. However, these changes made the structures more vulnerable to erosion when a particularly intense summer monsoon occurred. The demise of Angkor as a viable city coincides with prolonged ENSO-related summer monsoon failure in the mid 14th and early 15th centuries (Buckley et al. 2010; Cook et al. 2010). While evidence of drought is reported at Angkor (Day et al. 2012), the most dramatic physical evidence from this period relates, counter-intuitively, to extreme flood events. Indeed, Buckley et al. (2010) indicate that long periods of weak summer monsoon rainfall were punctuated by extremely wet years – six of the 20 wettest years of the past millennium occurred during these multi-decadal drought episodes. The abrupt reversions to intense summer monsoon rainfall triggered a destructive succession, including deep incisions in the middle reaches of the Siem Reap canal in the order of 5-6 meters, in-filling of canals and channels in the lower reaches with relatively coarse, cross-bedded sands, and the avulsion of the Siem Reap canal (Buckley et al. 2010; Lustig et al. 2008).
Tonle Sap Lake
Angkor’s failing water management network resulted in an increased flux of particulate-bound phosphate and sediment to Tonle Sap Lake, with implications for lacustrine ecology and sedimentation rates in the lake.
Sedimentation in Tonle Sap Lake itself effectively ceased in the middle of the Holocene when the lake became so shallow that wind-driven mixing prevented net sediment accumulation (Penny 2006). Since that time, the sequestration of suspended sediment from the Mekong River, in the order of 5.67 109 kg per annum into Tonle Sap, has occurred preferentially on the northern side of the lake (Kummu et al. 2008) due to winnowing of suspended sediment by the extensive swamp forest communities that occur there. This has created a “ridge-and-swale” morphology observed also in other large lake basins (Albert et al. 2005).
Any significant increase in the flux of sediment from Angkor to Tonle Sap Lake due to the destabilization of the water management network is likely to have contributed to the lateral accretion of the basin in the area upstream of the depositional loci. Within the sediment of the backswamps along this shoreline the transition from well-sorted siliciclastic mud to primarily organic sediment can be taken to represent the isolation of the backswamp from the main lake during the dry season following the development of the lakeward ridge. Radiocarbon ages at the transitional boundary from site Boeng Prech Sramoch post-date the 17th century (110±40 and 180±40 14C BP, respectively), suggesting nearly 4 km of horizontal progradation since that time. It is unclear if this accretion represents the storage of material eroded from Angkor’s infrastructure, a change in volume of suspended sediment yielded to the lake from the Mekong River, or a conflation of the two phenomena.
Collapse and transformation
In the case of Angkor, the interaction between extensive land-use and climatic variability triggered dramatic changes in both the canal system and, through nickpoint migration, the fluvial network to its north. Given that Angkor’s agriculture, and perhaps even the legitimacy of the administration, was closely tethered to the management and distribution of surface waters, the social outcomes of these fluvial responses were profound and resulted in unprecedented social upheaval.
By the end of the 15th century, Angkor and its city-region had collapsed, abandoned by the administration and the elite in favor of a succession of cities in the vicinity of the modern Cambodian capital of Phnom Penh. The elite were followed, it is presumed, by an urban diaspora from the Angkorian cities to the new “Middle Period” centers.
Ultimately, Angkor’s massive, brittle and inter-dependent water management infrastructure failed to suppress climate impacts on biogeochemical flux from catchments. Instead, it both sensitized the attendant fluvial networks to ENSO-related climatic variability and reduced the range of adaptive strategies available to the administration.
affiliation
School of Geosciences, The University of Sydney, Australia
contact
Dan Penny: dan.pennysydney.edu.au
references
Buckley BM et al (2010) Proc Nat Acad Sci USA 107: 6748-6752
Cook ER et al. (2010) Science 328: 486-489
Evans D et al. (2007) Proc Nat Acad Sci USA 104: 14277-14282
Lishan Ran and Xixi Lu
Sediment load in the Yellow River has increased dramatically during the Holocene in response to human land use. However, dams and reservoirs have reverted that trend, and sediment load has now reached levels even below those of the early Holocene.
Fluvial sediment transport by the world’s rivers has generally been affected by humans throughout the Holocene (Sluyter 1997; Hoffmann et al. 2010). However, the exact effect of human activities was specific for each river due to the differences in landform, climate, and the cultural history. Different types of human activities can result in distinctively different sediment load processes.
Extensive agricultural practices and deforestation accelerate soil erosion and thus considerably increase riverine sediment load, while large-scale soil conservation measures and dam construction can reduce it. Being the cradle of the Chinese civilization, the Yellow River basin has been strongly influenced by intensive human activity during the Holocene. Thanks to the long and continuous historical records available, the Yellow River is well suited for studying the long-term human impact on rivers and sedimentary basins.
 |
|
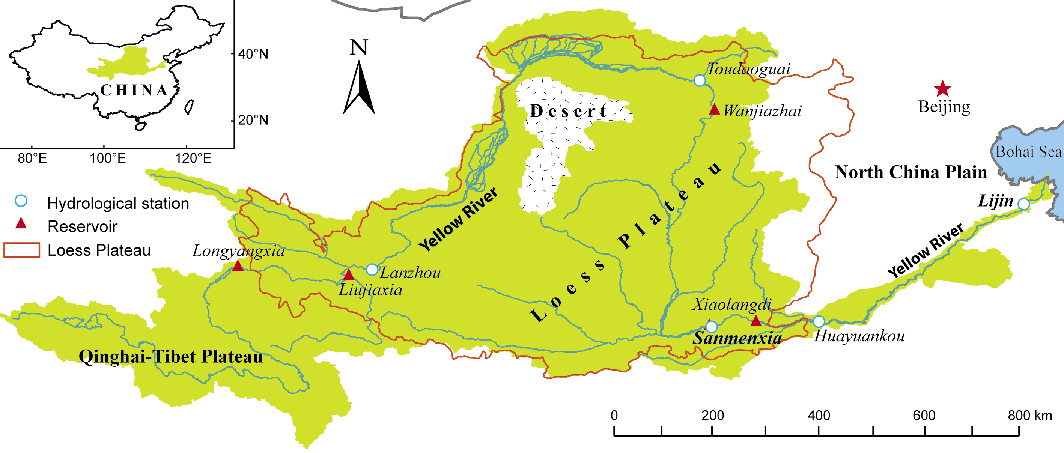
Figure 1: Location of the Yellow River basin with its middle reaches covered by the Loess Plateau that serves as the major sediment source. |
 |
|
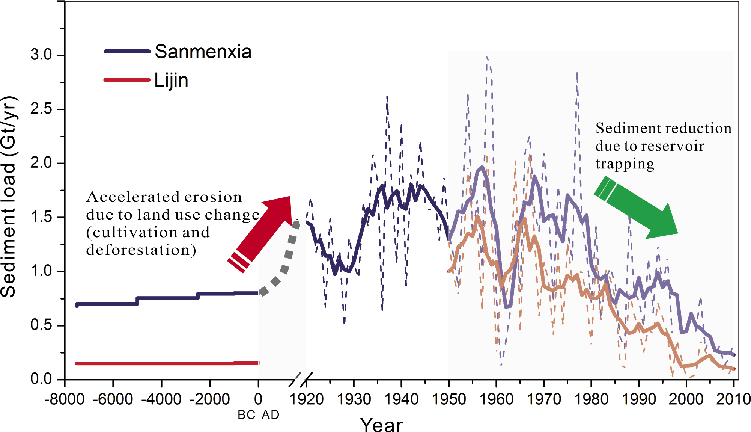
Figure 2: Changes in sediment load from the Yellow River basin during the Holocene as measured at Sanmenxia and Lijin stations (Fig. 1). Measurements at Sanmenxia are referred to as the total sediment load from the Yellow River basin, those at Lijin monitor the discharge to the delta and the ocean. The “pristine” sediment load during the early and middle Holocene was estimated from the sediment volume of deltaic and marine depositions and the sediments accumulated on the fluvial plains in the lower Yellow River basin (Milliman et al. 1987; Shi et al. 2002; Wang et al. 2007). |
Located in northern China (Fig. 1), the Yellow River basin is nowadays characterized by semiarid to arid climate and poor vegetation cover. The Yellow River basin is in large part surrounded by the highly erodible loess deposits of the Loess Plateau. Accordingly, it is well known for its strong soil erosion, which ranks amongst the highest in the world. During the early and middle Holocene, the sediment load of the Yellow River was estimated to be approximately 0.7-0.8 Gt/yr at the location of the Sanmenxia hydrological station (Shi et al. 2002; Fig. 2). This number includes accumulation on the lower alluvial plains and the delta. High sediment load during this period may have resulted from poor vegetation cover and/or an increasingly arid climate on the Loess Plateau following glacial retreat (Milliman et al. 1987). Due to intensive human activities, in particular agricultural cultivation and deforestation on the Loess Plateau (Ren and Zhu 1994; Liu et al. 2002; Saito et al. 2001; Wang et al. 2007), the sediment load increased strongly to 1.6-1.8 Gt/yr ca. 1000 years ago. Over the past 1000 years the Yellow River sediment load passing Sanmenxia remained overall stable at a high level of 1.7-1.8 Gt/yr, resulting in increasingly serious channel sedimentation in the lower Yellow River and progressive delta growth. The total sediment deposition downstream of Sanmenxia during the Holocene has been estimated, through radiocarbon dating, to be 8000 Gt, of which 5280 Gt was deposited on the North China Plain and 2720 Gt settled on the seafloor (Shi et al. 2002). As a result, the delta area was growing at a mean rate of 20-25 km2/yr (Wang et al. 2007).
However, during the past few decades the sediment load recorded at Sanmenxia has decreased markedly, particularly since the 1950s with the onset of extensive human activities (Fig. 2). Compared with the period of 1950-1959, the decadal mean sediment load in 2000-2010 has decreased by 80%, reaching a load even lower than the pristine level of the early Holocene. It is evident that massive dam construction and vegetation restoration within the basin are the primary reasons for this reduction. For example, artificial dams and reservoirs have trapped 40.3 Gt of sediment during the period 1950-2010 (Ran et al. 2013), corresponding to an annual mean of 0.67 Gt/yr. In comparison, the mean sediment load at Sanmenxia station over that same period was about 1.1 Gt/yr. Human activities have been estimated to contribute 70-80% to the sediment reduction, while the remaining 20-30% are related to a trend of decreasing precipitation (Lu et al. 2003; Wang et al. 2007). As a result, the present sediment budgets appear to be reverting to levels comparable to those before human impact due to the combined effects of damming and climate change.
Carbon budget implications
Variations in sediment dynamics over time are critical for budgeting the biogeochemical cycling of carbon and nutrients (e.g. Battin et al. 2009; Hoffmann et al. 2010). Despite the lack of direct evidence due to the absence of historical records, it is likely that the amount of particulate organic carbon (POC) transported in the Yellow River has varied significantly during the Holocene. Most of the Yellow River sediment (~90%) originates from the Loess Plateau where eroded top soils have a uniformly low organic carbon content. It can therefore be expected that riverine POC fluxes was dominantly controlled by temporal variations in the fluxes of total sediment. If the soil POC content was 0.5-1% as suggested by new unpublished data, then approximately 40-80 Gt of POC have been buried due to sedimentation during the Holocene.
Human activities over the past six decades have also resulted in considerable carbon burial, for example through sediment trapping. Assuming the same POC content as above suggests that 0.2-0.4 Gt of POC have been trapped by dams during 1950-2010. The sediments accumulated in reservoirs should sequester POC relatively effectively because the anaerobic waters in the reservoirs prevent the buried carbon from oxidation, limiting decomposition to anaerobic processes such as methanogenesis. More research is needed to quantify mineralization rates and residence times of POC in reservoirs. As POC accounts for more than 90% of total organic carbon in the Yellow River (Cauwet and Mackenzie 1993), the reduced POC fluxes, together with decreased sediment loads, have resulted in far-reaching physical and biogeochemical responses in the estuary and in marine ecosystems within the discharge plume. Continuous retreat of the Yellow River delta in recent decades has been observed due to the reduced sediment supply, and the decreased riverine supply of carbon and nutrients has significantly influenced its ecological integrity (Xu et al. 2004; Li et al. 2009; Syvitski et al. 2005). For example, reduced sediment and nutrient discharge and intrusion of salt water into the delta wetlands have led to substantial salinization, resulting in rapid degradation of bird habitats (Cui et al. 2009).
Future perspectives
Human activities are now reducing the sediment load in the Yellow River basin at an unprecedented pace. In addition to the numerous dams under construction and in the planning, large-scale soil conservation programs, such as the Grain-for-Green Project, are being carried out in the drainage basin, in particular the Loess Plateau, to control soil erosion and mitigate land degradation. These activities, combined with decreasing amounts of rainfall, suggest that the sediment load and associated carbon transported by the Yellow River will further decrease in future. Furthermore, the accelerating human activity in the region is likely to increase the role of anthropogenic over natural factors on sediment and carbon dynamics even more over the next decades.
With respect to greatly reduced sediment loads, attempts have been made to explore the geomorphological, ecological, and other environmental impacts (Wang et al. 2007); however, in comparison, less attention has been devoted to studying the implications of carbon burial of sediments within the basin and of the decreased carbon fluxes reaching the ocean. As one of the rivers in the world with the highest sediment flux (Milliman et al. 1987), the associated carbon amount in the Yellow River is considerable. The carbon and nutrient dynamics of the basin are likely to undergo further substantial changes in the near future. The details of the sediment dynamics and the biogeochemical consequences are not well understood. Consequently, effective mitigation strategies are difficult to develop. Analyzing the river’s storage and transport history over the Holocene and the associated environmental impacts provides an opportunity to improve our quantitative understanding of fluvial systems and associated ecosystems.
The Yellow River’s well-defined thousand-year sediment yield increase, resulting from land use change, and the subsequent sudden decrease after 1950 AD, largely due to reservoir construction, is exceptional, and thus provides an almost ideal “experimental” case study for research under the Soil & Sediment and Carbon Themes of PAGES.
acknowledgements
This work was supported by the Ministry of Education, Singapore (MOE2011-T2-1-101).
affiliation
Department of Geography, National University of Singapore, Singapore
contact
Lishan Ran: georlnus.edu.sg
references
Battin TJ et al. (2009) Nat Geosci 2: 598-600
Hoffmann T et al. (2010) Global Planet Change 72: 87-98
Lu XX et al. (2013) Int J Sediment Res 28: 1-14
Thomas Parkner1 and Mio Kasai2
Two case studies from Japan demonstrate that tectonic and volcanic forcing notably increased the sediment flux in fluvial systems. Therefore fluvial system studies in geomorphically active regions should also consider such forcings alongside land use and climate considerations.
 |
|
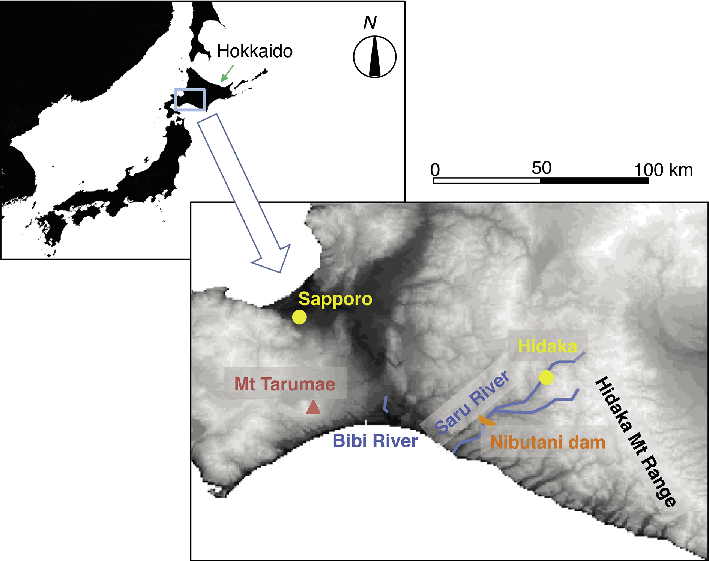
Figure 1: Location map of Hokkaido (inset) and the studied Saru and Bibi River. |
Land use and climate impacts are frequently studied as the main modulators of fluvial systems since the onset of agriculture (Wasson 1996). However, in geomorphically active regions such as along the Pacific Rim human impacts are modulated by tectonics and volcanic eruptions. In two case studies from Hokkaido, the northern Japanese island (Fig. 1), we investigate the impacts of geomorphic factors on human-impacted river systems. In the Saru River system, fragile lithology and steep slopes have resulted in a dynamic sedimentary system with high natural sediment flux, which is sensitive to tectonic impact. In contrast, the sediment dynamics in the Bibi River system, our second case study, is strongly influenced by volcanic impact due to its vicinity (15 km) to the caldera of an active volcano.
The island of Hokkaido
The landscape of Hokkaido is shaped by active plate tectonics. The central part of the island consists of erodible metamorphic rock and hills with steep slopes. In addition, active volcanism causes pyroclastic flows and debris avalanches, regularly covering large parts of the island with tephra (Furukawa et al. 1997; Machida and Arai 2003).
Immigration to Hokkaido started with the end of Japan’s isolation policy in AD 1868. Before then, land use was limited to small areas along the coast, and to lowland rivers and lakes (Imai 1975). The rest of the island was inhabited by the indigenous Ainu people, who relied dominantly on salmon fishing and deer hunting. After AD 1900 the area of cultivated land increased rapidly (Imai 1975). European style farming and industrialization were introduced and large areas of wetlands and forests were converted into paddy fields, crop fields, dairy farms and urban areas.
Outback mountain areas, despite their almost intact forest cover, are frequently subject to landslides. They are triggered by episodic storms in summer and autumn or by spring melt events. The resulting high sediment supply rates from hillslopes lead to increased sediment storage in rivers.
Case study Saru River
The high sediment flux of 470,000 m3 a-1 on average in the upper Saru River catchment (1350 km2) in the Hidaka Mountain Range is strongly controlled by catchment lithology, steep slopes (highest peak reaches 2052 m) and high average annual precipitation (1350 mm in Hidaka; Fig. 1). Most of the mountainous area is covered by forest (87% in 2006). Agriculture is mainly limited to the alluvial floodplain, where intense storms occasionally cause landslides and flood disasters. For the purposes of flood protection, water utilization and power generation, the Nibutani dam reservoir (Fig. 1) was completed in 1997. But rapid sediment delivery from the headwaters had already filled 85% of the reservoir’s initial storage capacity by 2011.
Deep-seated and shallow landslides dominate in the mountain areas. Deep-seated landslides, common on sedimentary and serpentine rocks, are characterized by slow but steady movement in the order of several meters per year, depending on ground water conditions. The sliding planes are often located more than ten meters below the ground and associated with deeply weathered rock layers. In contrast, shallow landslides are only a few meters deep and frequently occur on crushed basalt rocks. Their temporal activity is more episodic and caused by rainfall events. Different from deep-seated landslides, they often stop producing sediment after a few years.
 |
|
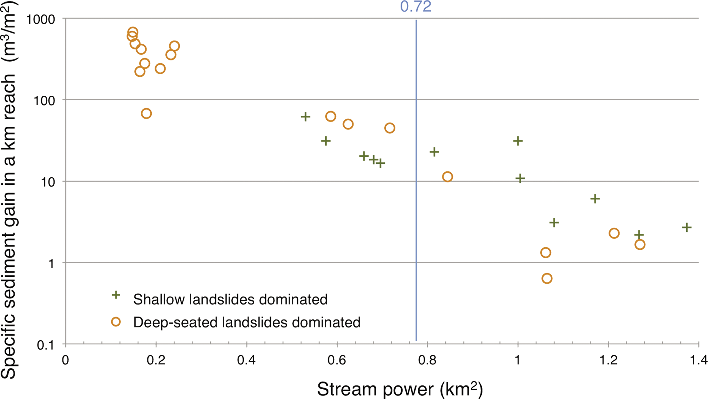
Figure 2: Relationship between stream power and specific sediment gain in a channel reach. Reaches were grouped according the dominant landslide type (i.e. deep-seated vs. shallow landslides) in their tributary catchments. |
The last major storm in 2003 caused numerous landslides and aggradation throughout most of the course of Saru River. Elevation models for 2006 and 2010 derived from LiDAR remote sensing data show that the channel bed degraded rapidly over this period. The specific sediment loss (i.e. sediment loss per catchment area) along the river reaches was strongly related to their average channel bed slope, which is largely determined by the hardness of the underlying rocks. On the other hand, stream power Ω (the product of catchment area and bed slope), largely determined the specific sediment gain (i.e. sediment aggradation per catchment area). When Ω was <0.72 km2, more sediment was deposited in reaches where deep-seated landslides dominated in tributary catchments compared to the reaches where shallow landslides dominated (Fig. 2). This relationship was inversed for Ω >0.72 km2. These results imply a balance between continuous sediment supply from deep-seated landslides and the rivers’ capacity to flush out sediment. We conclude from this study that lithology-driven differences in landsliding processes and sediment production effectively control the volume of fluvial sediment transport.
In line with our results, Simizu (1998) indicated that sediment production in the headwater basin has been high at the almost same rates over the past 8,000 years. Local place names in the Ainu language (such as Shishirimuka, the Ainu name of the Saru River meaning choked with too much sediment) also suggest that the Saru River system was always characterized by abundant sediment transported. These evidences highlight the significance of tectonic activity alongside human and climatic impacts in similarly dynamic fluvial systems.
Case study Bibi River
The 17 km long Bibi river system (Fig. 1) has been impacted by human activity and volcanic eruptions over the last 3,000 years. The catchment consists mainly of volcanic sequences from the active Shikotsu-Tarumae complex, with a floodplain forming on a flat mid-Holocene coastal plain. The eastern part of the catchment was continually used for agriculture since the beginning of the last century.
The impact of human activities and volcanic eruptions on the area was studied by means of six sediment cores from the floodplain. To distinguish between air-fallen tephra and fluvial sediment, the dry density, loss-on-ignition and grain-size data of each core was compared with standard tephra stratigraphies (Furukawa et al. 2003).
Three air-fall tephra layers from nearby Tarumae volcano from 1736 AD, 1667 AD and ca. 1000 BC, correspond to a total of 2.7 Mt tephra deposition on the floodplain. The tephra deposits devastated the floodplain, covering it as thick as 60 cm. The thickness of the purely air-deposited (non-reworked) tephra layer on the floodplain depended on the wind direction during the eruption. The air-fallen tephra was reworked by fluvial processes and deposited on the floodplain with decreasing sediment thickness downstream. After a phase of rapid adjustment of the fluvial system expressed by accumulation of mineral floodplain deposits, sediments with high (30-86%) levels of organic matter mark a return to low sediment delivery to the floodplain. All in all, about 0.8 Mt of post-eruption sediment was re-deposited by the river on the floodplain during the last 3,000 years.
Human impact on the fluvial system is only reflected in the middle reach where roads crossed the floodplain. The sediment production related to the road construction is in the order of 160 kg m-2 and thus comparable to the fluvial sediment deposition derived from volcanic eruptions. At other locations, however, no human-induced increase in sediment input was evident. We conclude from this that volcanic tephra deposition is the dominant forcing on sediment deposition in the Bibi River, despite society having achieved an advanced industrial level in the catchment.
The Hokkaido perspective
Many studies use paleoenvironmental records to assess the difference between present and past environmental conditions (Dearing at al. 2006). The quantification of background conditions, base lines or pre-impact references is difficult in very active geomorphic regions such as the Hidaka Mountains. The example from the Bibi River shows that volcanic forcing needs to be integrated with the effects of land use and climate change to understand the trajectory of fluvial systems.
Other impacts, not described in the two shown examples, include tsunamis, sea level change, and earthquakes. The recurrence interval of unusually large earthquakes and tsunamis along the Kuril subduction zone is about 365-553 years (Nanayama et al. 2007). In the past, such events impacted landscapes up to three kilometers inland, disturbing river regimes in the flat, lowest reaches. In addition, large earthquakes during the last 300 years raised the coastlines and the lowest reaches of rivers in eastern Hokkaido by about one meter. All these impacts and controls need to be taken into consideration when studying fluvial systems, not only in Hokkaido but also in other tectonically active regions.
affiliations
1College of Geoscience, University of Tsukuba, Japan
2Graduate School of Agriculture, Hokkaido University, Sapporo, Japan
contact
Thomas Parkner: parkner.thomas.gbu.tsukuba.ac.jp
references
Dearing JA at al. (2006) Reg Environ Change 6: 1-16
Nanayama F et al. (2007) Sediment Geol 200: 275-294
Sawai Y et al. (2009) J Geophys Res Solid Earth 114, doi: 10.1029/2007JB005503
Jürg Luterbacher1, J. Werner1, D. Fleitmann2, J.F. Gonzalez-Rouco3, D. McCarroll4, S. Wagner5, E. Zorita5, J. Gómez-Navarro6, U. Büntgen7,8 and J. Esper9
Meeting of the Euro-Med2k Working Group – Reading, UK, 25-26 March 2013
Water availability has been a crucial constraint on both past societies and ecosystems; therefore identification of historical extreme hydrological events (severity and duration of droughts, magnitude of floods) is important. These characteristics were addressed at a meeting of the PAGES Euro-Med2k Working Group in Reading where a number of presentations highlighted the variability of those extremes, and identified the space- and time-scales that are resolved at various European proxy sites.
During the first day, participants presented overviews of high- and low-resolution hydroclimatic proxy records from different archives. Discussion revealed that it is often unclear whether individual proxies reflect moisture availability, soil moisture, precipitation, flood events, drought intervals or some combination. The large variety and different sensitivity of hydrological proxy records thus complicates their integration and the reconstruction of one specific target variable. For instance, a measure of hydroclimate, such as the Palmer Drought Severity Index, is not even well defined for the observational period and different algorithms (e.g. Thornwaite versus Penman-Monteith scheme) may produce markedly different results (van der Schrier et al. 2011).
Further emphasis was also placed on dating issues; distinguishing climatic and non-climatic influences; seasonal biases in proxy records and archive-specific aspects of these proxies that can contribute to reconstruction uncertainties. The potential and limitations of documentary and natural proxies to reconstruct the full range of variations in the regional hydrological cycle were discussed. Discussion centered upon the problems of obtaining a comprehensive overview of the proxy information that is currently available for different aspects of hydroclimate, which is a necessary step before making decisions about how to combine them or translate them into a common target.
It became clear that in contrast to temperature, hydrological parameters have a much shorter de-correlation distance. Thus, without a dense network of precipitation proxies spatially highly resolved reconstructions are limited (Büntgen et al. 2010).
 |
|
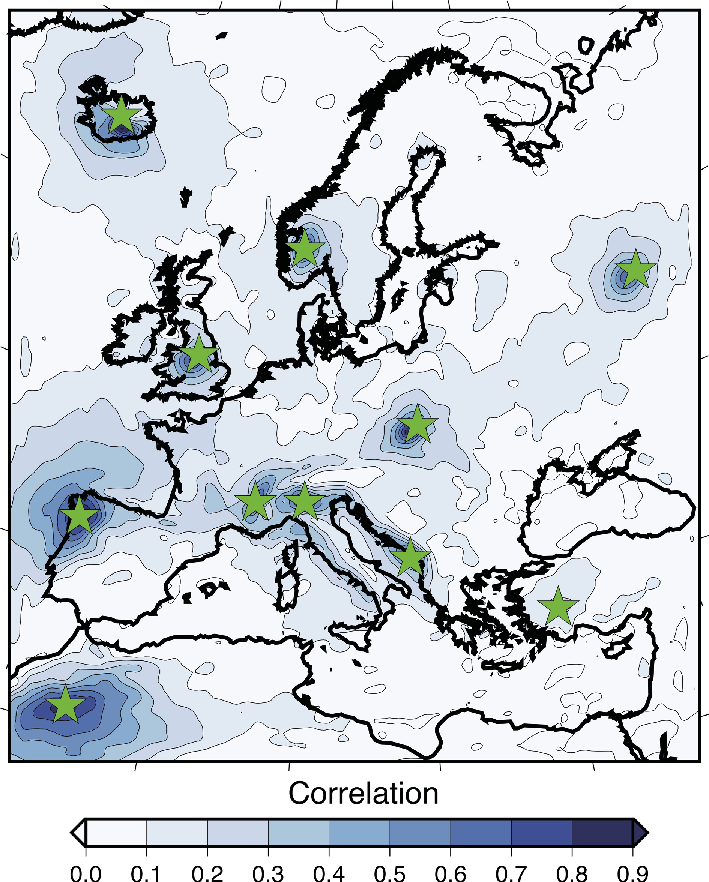
Figure 1: Correlation map between summer precipitation reconstructed using the “analog method” based on the pseudo-proxy locations (green stars) and the original regional climate model output. The reconstructed period is 1-1999 AD (Gomez et al., unpublished data). |
The second day focused on the comparisons between proxy-reconstructed precipitation records and climate model simulations, to assess model veracity and explore mechanisms of internal or externally forced variability contributing to hydroclimate changes. For instance, results from regional climate model simulations for the last two millennia can be used to carry out pseudo-proxy experiments (PPE), i.e. reconstructing the modeled precipitation fields using only the pseudo proxy locations (Fig. 1). A PPE was carried out for precipitation using the “analog method” (Zorita and von Storch 1999) but the short de-correlation distance of precipitation demonstrates that the reconstructions only have skill at the local scale, especially during summer. This is due to the local-scale processes involved in generating summer precipitation. The coupling schemes between soil moisture and atmospheric variables may influence regional hydroclimate independently of the large-scale driving conditions (Gómez-Navarro et al. 2013), so an ensemble of regional models is advisable. Simulations with global models participating in the CMIP5 project indicate that internal unforced modes of climate variability tangle temperature and hydroclimate. A possible, though challenging, strategy could be to reconstruct both temperature and hydroclimate simultaneously.
The next workshop will aim at expanding and improving the 2k proxy database in order to develop more reliable trans-regional synthesis products. Application of modern, more elaborated reconstruction methods that can model the complex spatio-temporal processes in hydroclimatology will be needed to produce gridded products.
affiliations
1Department of Geography, University of Giessen, Germany
2Department of Archaeology, University of Reading, UK
3Institute of Geoscience, Complutense University, Madrid, Spain
4Department of Geography, Swansea University, UK
5Institute of Coastal Research, Helmholtz-Zentrum Geesthacht, Germany
6Climate and Environmental Physics and Oeschger Centre for Climate Change Research, University of Bern, Switzerland
7WSL, Birmensdorf, Switzerland
8Global Change Research Centre AS CR, Brno, Czech Republic
9Department of Geography, University of Mainz, Germany
contact
J. Luterbacher: Juerg.luterbachergeogr.uni-giessen.de
references
Büntgen U et al. (2010) Clim Res 41: 125-130
Gómez-Navarro JJ et al. (2013) Clim Past 9: 1667-1682
van der Schrier G et al. (2011) J Geophys Res [Atmos] 116, doi: 10.1029/2010JD015001
Peter Langdon1 and Steve Brooks2
New Forest, UK, 10-13 June 2013
 |
|
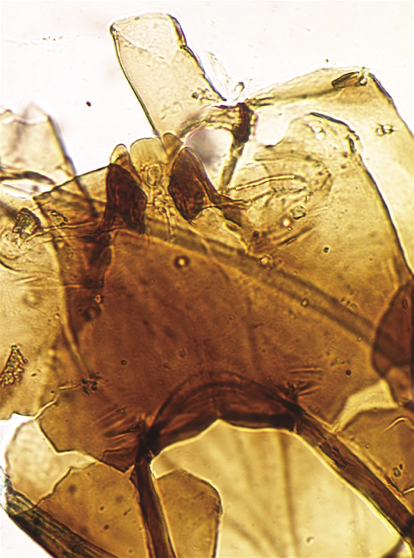
Figure 1: Subfossil head capsule of Corynocera ambigua (image from Brooks et al. 2007). This taxon is relatively easy to identify but its (paleo)ecology is not straightforward. It is seemingly a good cold indicator in the Lateglacial and in northern regions but also appears to tolerate warm, eutrophic conditions in southern parts of its range during the late Holocene. This illustrates the potential problems of using transfer functions, as raised by Juggins (2013). |
Forty scientists met in the New Forest to attend the 12th International Workshop on Subfossil Chironomids. This three-day meeting, hosted by the University of Southampton, brought together researchers from Europe, North America, South America and Asia.
Since 1997 the series of international subfossil (“deadheads”) chironomid workshops have been fundamental for furthering developments in research on chironomid paleoecology. In particular, the workshops have been important in fostering coherence and cooperation within the community and introducing and integrating new researchers into the field. They have also been instrumental in developing a standard approach to subfossil chironomid larval taxonomy and analytical methods, which has been vital in maintaining rigor in the subject. Furthermore, they have enabled the community to keep abreast of new developments and methods to tackle emerging problems, and have provided a forum for developing new joint research initiatives. This meeting continued in the same vein - delegates discussed a range of key topics that have dominated paleoecological techniques in recent years in addition to many new developments.
The use of transfer functions in chironomid paleoecology was central to many discussions. This has been an important topic of recent debate within the whole paleolimnology and paleo-science communities, following the recent work of Juggins (2013). Steve Juggins attended the meeting and presented a précis of his research. The discussion that followed was very positive, focusing on the best way to move the science forward. Clearly there is still a lot of potential in using chironomid-based transfer functions to reconstruct summer temperatures (and other parameters where appropriate), but as a community we need to consider the ecological relationships in our calibration sets carefully, and how well these relationships are replicated in space, before applying them in time. Indeed one study showed how training set selection, taxonomic resolution and taxon deletion can be critical in influencing model performance and resulting reconstructions. Much of the discussion around this subject focused on two key issues: (i) how to develop more stringent ways to test calibration data (training sets) and evaluate the performance of inference models; and (ii) improving the reliability of the reconstructions by identifying the effects of confounding secondary variables. It was agreed that cross-validation of results from other sites or against other independent proxies is an appropriate way to validate chironomid-inferred reconstructions.
Another key topic discussed at length was the effectiveness of using chironomids for temperature inferences from sequences spanning the last interglacial to the Holocene from sites across the world. Other discussions focused on the responses of chironomids as environmental gradients are crossed, and how best to interpret the effects of secondary gradients; trophic changes and human impacts; the use of stable isotopes within chironomid paleoecology; and biodiversity and lake restoration.
The location and date of the next International Workshop on Subfossil Chironomids is still to be confirmed, but may coincide with the next International Paleolimnology Symposium to be held in China in 2015.
affiliations
1Geography and Environment, University of Southampton, UK
2Department of Life Sciences, Natural History Museum, London, UK
contact
Peter Langdon: P.G.Langdonsoton.ac.uk
references
Boris Vannière1, O. Blarquez2,3, J. Marlon4, A.-L. Daniau5 and M. Power6,7
Workshop of the PAGES Global Paleofire Working Group – Frasne, France, 2-6 October 2013
The aim of the Global Paleofire Working Group (GPWG) is to facilitate scientific research on fire activity in the Earth system through the development of a global charcoal dataset (GCD). Analysis and synthesis of sedimentary charcoal records from around the globe has enabled the identification and explanation of spatiotemporal patterns in paleofire activity, created a framework for exploring fire-climate-vegetation linkages at decadal-to-millennial time scales, and allowed evaluation of fire model simulations at regional to global scales. Science emerging from the GPWG community includes a public-access database and multi-authored publications describing observed spatiotemporal changes in fire at global and regional scales as well as their causes and consequences (e.g. time series and maps; Power et al. 2008).
Paleofire science has developed rapidly during the past decade; new charcoal records are being produced, new statistical tools and analytical approaches are being developed, and novel strategies for combining multiple records for regional-to-global scale syntheses are being employed (e.g. Daniau et al. 2012). These recent developments present paleofire scientists with the challenge of dealing with highly quantitative, complex, and multivariate data documenting the timing, magnitude, and drivers of past fire activity (e.g. Vannière et al. 2011). Previous data exploration and synthesis of the GCD were done using analytical procedures developed by P.J. Bartlein (unpublished) using Fortran. The GPWG is currently developing toolkits using the R statistical language to broaden the access to students and researchers. The paleofire R package is allowing for rapid growth of GCD analyses and innovative paleofire studies.
 |
|
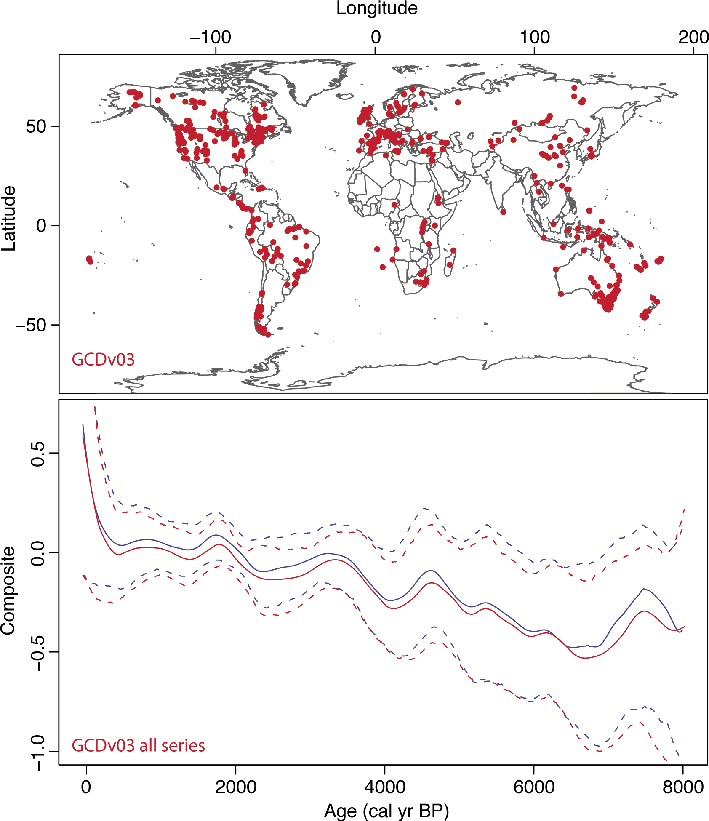
Figure 1: Map of sites available in GCDv3 (top panel) and comparison of the Fortran (e.g. Marlon et al. 2013) and paleofire R package compositing outputs for all GCDv03 charcoal sites (bottom panel). Composite curves (plain line) and associated 95% confidence intervals are displayed in blue for the Fortran procedure and in red for the paleofire R package. The results were obtained using the same arguments for both procedures. The results from both approaches are highly correlated (r > 0.99) and significant (p << 0.001). The paleofire R-package offers comparable results for charcoal series synthesis to former analyses based on the Fortran’s method. The 500 year smoothing window-width used in this analysis does not capture the most recent downturn known to have occurred in global fire activity since the turn of the 20th century. |
The main objectives of this workshop were to 1) develop a new version of the GCD; 2) explore trends in fire history at the geographic scale of biomes using the new version of the dataset; 3) test and understand the operation of the newly developed paleofire R package, designed specifically to synthesize multiple records from the GCD (Fig. 1); and 4) discuss a new architecture for housing and disseminating the GCD into the future. The workshop was sponsored by the Region of Franche-Comté through the French-Swiss Environmental studies network, by UMR Chrono-Environnement (CNRS - University of Franche-Comté) and by PAGES. Fourteen participants from six countries (USA, Canada, France, Spain, Germany, China) and from various career stages presented their research, and were trained in the paleofire R-package functions. Moreover, version 3 of the GCD was prepared for public release. Participants were encouraged to develop new project ideas for global and regional charcoal syntheses. A set of comparative regional analyses that examine biome-scale fire signals and their forcings were initiated and are now in preparation for publication. Several other planned analyses, including regional studies and methodological research such as comparing micro- versus macro-charcoal records are also now underway. The paleofire R package can be installed directly from: http://cran.r-project.org/web/packages/paleofire/index.html
Finally, a new database architecture and web portal for the GCD was discussed and designed. The database is currently being transferred from ACCESS to MySQL in preparation for a large input of new data in the next version of the GCD and the new associated management needs. The new GDC will have a web-based user-interface to improve community access and use, as well as simplified data input and export. All of these enhancements are expected to greatly expand the user base of the GCD and thus promote paleofire research both within and beyond the paleo community.
affiliations
1Chrono-Environnement, CNRS, University of Franche-Comté, Besançon, France
2Centre d'Étude de la Forêt, Université du Québec à Montréal, Canada
3Forest Research Institute, Université du Québec en Abitibi-Témiscamingue, Rouyn-Noranda, Canada
4Yale School of Forestry & Environmental Studies, Yale University, New Haven, USA
5EPOC, CNRS, Université of Bordeaux, Talence, France
6Department of Geography, University of Utah, Salt Lake City, USA
7Natural History Museum of Utah, University of Utah, Salt Lake City, USA
contact
Boris Vannière: boris.vanniereuniv-fcomte.fr
references
Daniau AL et al. (2012) Global Biogeochem Cycles 26, doi: 10.1029/2011GB004249
Marlon JR et al. (2013) Quat Sci Rev 65: 5-25
Zicheng Yu and Julie Loisel
Bethlehem, United States, 13-15 October 2013
Northern peatlands represent the largest biosphere carbon (C) pool in the Earth system, containing about 500 GtC (Gorham 1991; Yu 2012); however, how this large C pool responds to climate change is still poorly understood. The overarching goal of this workshop was to understand climate and other controls on Holocene C accumulation through a community-wide collaborative and coordinated effort. This Holocene-scale synthesis aims at extending the effort on the peat C synthesis of northern peatlands for the last millennium as reported in Charman et al. (2013).
 |
|
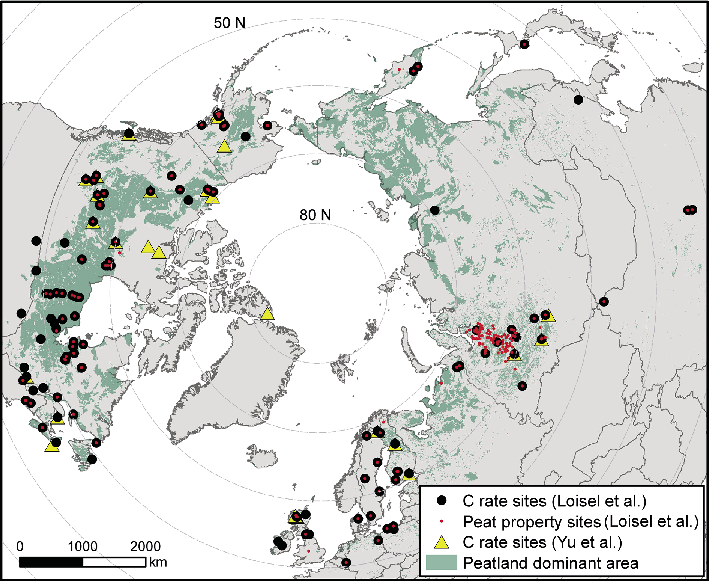
Figure 1: Map showing the locations of peatland sites for C accumulation and peat properties in the database (Loisel et al. in press). Also shown are C accumulation sites used in a previous synthesis (Yu et al. 2010) and the distribution of northern peatlands (green area from Yu et al. 2010). Figure modified from Loisel et al. (in press). |
At the workshop, we reviewed and finalized the newly expanded Holocene peat C accumulation database that now contains peat property (bulk density, C content) data for 232 peat cores from 181 sites, and peat C accumulation records for 151 cores from 127 sites (Fig. 1; Loisel et al. in press). This is a major expansion from a previous synthesis of C accumulation, which combined records from 33 sites in northern peatlands (Yu et al. 2010). Workshop participants also discussed strategies for further analyzing and synthesizing peat C data along with other relevant datasets, including bioclimate records of seasonal temperature, moisture and photosynthetically active radiation (PAR). In order to address the overarching question “what controls Holocene peat C sequestration?”, participants identified eight topical areas that need to be addressed in a coordinated way. Topics for these working groups include peatland carbon database management (leader: J. Loisel); age and peat C uncertainty analysis and modeling (M. Blaauw); Bayesian Monte Carlo Empirical Orthogonal Function (MCEOF) analysis (C. Massa); hierarchical cluster analysis (J. Nichols); lateral expansion data and modeling analysis (L. Belyea); net carbon balance and “true” C rate reconstructions (Z. Yu); Holocene bioclimate reconstructions (S. Brewer); and peatland carbon – climate analysis (S. Harrison, R. Spahni, and Z. Yu). An improved technique (using Bayesian MCEOF) that accounts for uncertainties in both ages and peat properties is being developed for a spatiotemporal analysis of the C records. In addition, some groups plan to focus on improving our understanding of important peatland processes, including large-scale lateral expansion (e.g. Ruppel et al. 2013), peat C flux reconstructions at individual sites (e.g. Yu 2011), and PAR controls on peat C sequestration (e.g. Charman et al. 2013).
The database used for the synthesis will be archived at https://peatlands.lehigh.edu, and will be linked or ported to other public databases such as Neotoma (neotomaDB.org). New peat C records are to be published in a special issue on “Holocene Peatland Carbon Dynamics in the Circum-Arctic Region” in The Holocene (guest-edited by Z. Yu et al.). In addition to improving understanding of the controlling factors on Holocene C accumulation, the new database will be useful for calibrating and evaluating Earth system and climate-carbon cycle models (e.g. Spahni et al. 2013) that need to adequately account for the role played by peatlands in the global C cycle.
The three-day workshop at Lehigh University was followed by a one-day meeting in San Francisco, USA, before the AGU 2013 Fall Meeting. At this meeting, the participants discussed their progress within the working groups and other future research directions. Those included synthesizing and modeling global peat C over the last millennium; synthesizing tropical peat C; studying pre-Holocene peat C accumulation and the structural and functional differences between permafrost and non-permafrost peatlands; and preparing the proposal for the new PAGES “Peat On Earth through Time (POET)” working group.
A total of 25 peatland researchers, including postdoc fellows and PhD students, from seven countries attended the October workshop, and about 40 participants attended the December workshop.
acknowledgements
We thank the workshop participants for their contributions. The workshops were supported by grants from the US NSF-Arctic Natural Science Program, INQUA and PAGES.
affiliation
Department of Earth and Environmental Sciences, Lehigh University, Bethlehem, United States
contact
Zicheng Yu: ziy2lehigh.edu
selected references
Full reference list under: pastglobalchanges.org/products/newsletters/ref2014_1.pdf
Charman D et al. (2013) Biogeosciences 10: 929-944
Ruppel M et al. (2013) Holocene 23: 1596-1606
Spahni R et al. (2013) Clim Past 9: 1287-1308
Yu ZC et al. (2010) Geophys Res Lett 37, doi:10.1029/2010GL043584
Glenn Milne1, A. Carlson2, A. Dutton3, A. Long4 and O. Rybak5,6
PALSEA2 Workshop, Rome, Italy, 21-25 October 2013
The greatest uncertainty in projecting future sea level rise is that associated with the response of Earth’s ice sheets to climate change. The primary aim of the PALeo constraints on SEA level rise (PALSEA) Working Group is to reduce this uncertainty using geological information of past ice sheet and sea level variability with a focus on past warm periods when the configuration of ice on Earth was similar to today. Due to the success of this working group during its first phase, it has been approved for a second phase (PALSEA2) and the meeting reported on here is the first in this second phase.
Estimating rates and sources of sea level change during the last interglaciation (LIG; ca. 130-115 ka ago) was the dominant part of the meeting. Recently, significant progress has been made in improving estimates of the minimum volume of land ice during this period with a range of 5.5-9m currently documented as the most likely (Kopp et al. 2009; Dutton and Lambeck 2012). A number of observations suggest more than one sea level high stand during this period. Reconstructions based on a range of sea level indicators from different regions were presented at the workshop and all support temporal variability within the LIG with millennial average rates ranging from the order of decimeters per century to meters per century. The discrepancy in these values relates primarily to limitations in height and time precision of the reconstruction methods used. Therefore, an important target for the community is the production of more precise sea level records for this period.
 |
|
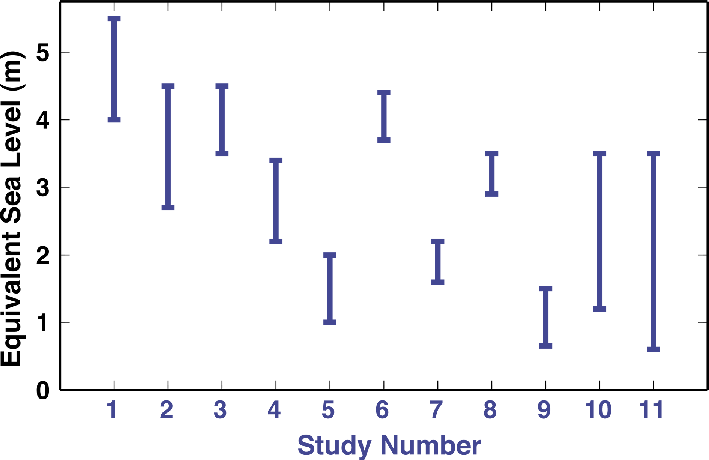
Figure 1: Estimates of the contribution of the Greenland ice sheet to global mean sea level during the Last Interglacial. The studies numbered in publication order along the x-axis are: (1) Cuffey and Marshall (2000); (2) Tarasov and Peltier (2003; most likely range shown); (3) L’homme et al. (2005; most likely range shown); (4) Otto-Bliesner et al. (2006); (5) Oerlemans et al. (2006); (6) Robinson et al. (2011; most likely range shown); (7) Colville et al. (2011); (8) Born and Nisancioglu (2012); (9) Quiquet et al. (2012); (10) Helsen et al. (2013); (11) Stone et al. (2013). Only studies that provided a range of values are shown here. |
Interpreting both the volume and variability of reconstructed LIG sea levels requires consideration of near-field constraints on ice extent for both the Greenland and Antarctic ice sheets as well as models of their evolution across the LIG. While there remains considerable variation in estimates of the minimum volume extent of the Greenland ice sheet during the LIG, most recent studies indicate relatively stable rates of mass loss with a maximum sea level contribution in the range 0.5-3.5 m for this period (Fig. 1), consistent with observations (e.g. Colville et al. 2011; NEEM 2013). There is much less data control on Antarctic ice sheet changes, making this an important research goal in the coming years. Modeling results presented at the meeting suggest that a relatively large and rapid retreat of the Antarctic ice sheets first requires significant warming of the Southern Ocean in order to melt ice shelves.
An issue common to all time periods discussed at the workshop was the challenge of estimating global mean sea level (to determine past ice volume) from a limited set of site specific relative sea level data. Reconstructions of the latter for the middle Pliocene (ca. 3.3-2.9 Ma) can be significantly affected by both glacial isostatic adjustment and dynamic topography driven by internal mantle buoyancy (e.g. Rowley et al. 2013). Uncertainty in model estimates of the contribution of these processes to Pliocene sea levels is a primary limitation in estimating ice volume within a reasonable precision (~10 m). A similar problem relates to the interpretation of high-resolution sea-level records for the past few centuries to millennia. As more records become available, it is becoming clear that there is a large overprint associated with ocean dynamical changes. This has important implications for using these records to calibrate semi-empirical models of global mean sea level (e.g. Kemp et al. 2011).
Through future workshops and conference sessions, the PALSEA2 Working Group will stimulate and encourage researchers to address the data and knowledge gaps highlighted above.
affiliations
1Department of Earth Sciences, University of Ottawa, Canada
2College of Oceanic and Atmospheric Sciences, Oregon State University, Corvallis, USA
3Department of Geological Sciences, University of Florida, Gainsville, USA
4Department of Geography, Durham University, UK
5Department of Geography, Free University of Brussels, Belgium
6Institute of Natural and Technical Systems of the Russian Academy of Sciences, Sochi, Russia
contact
Glenn Milne: gamilneuottawa.ca
references
Colville EJ et al. (2011) Science 333: 620-623
Dutton A, Lambeck K (2012) Science 337: 216-219
Kemp AC et al. (2011) PNAS 108: 11017-11022