PAGES Magazine articles
Christine A. Ogola
Nanyuki, Kenya, 23-27 July 2013
The fourth Eastern Africa Quaternary Research Association (EAQUA) Conference was held in Nanyuki near Mt. Kenya and was hosted by National Museums of Kenya. It was attended by 55 delegates from 14 countries and co-sponsored by the National Museums of Kenya (NMK), the International Union for Quaternary Research (INQUA), the Embassy of France (Nairobi), the French Institute for Research and Development (IRD) and PAGES.
Then Director General NMK, Idle Omar Farah and INQUA President Margaret Avery graciously attended the opening ceremony. Dr Farah, delighted to host the conference, stressed the commitment of NMK to capacity building of scientists and communities from areas with good natural archives of past environmental change. He also noted that EAQUA members’ research dealt with relevant global issues such as climate change and adaptation, and encouraged the participants to make use of the immense paleoecological, geological and cultural records at NMK for their research. Finally, he briefly outlined how NMK was streamlining the processes for Quaternary research in Kenya. Dr Avery encouraged members to publish their conference research and papers to make EAQUA more visible.
 |
|
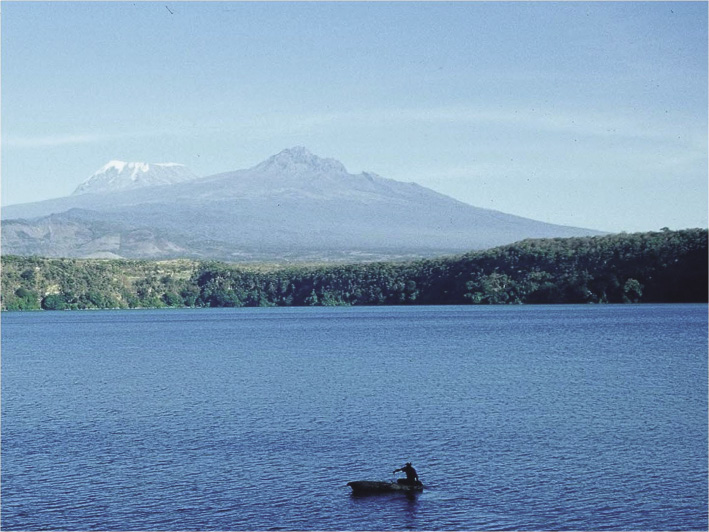
Figure 1: Lake Chala southeast of Mt Kilimanjaro. Sediments from this lake are one of the longest archives of climate change in the region, reaching back at least 25,000 years (Moernaut et al. 2010). |
The papers presented in sessions 1 and 2 themed “Habitat and paleoenvironmental reconstruction of pre-historic sites (paleobotany, isotopes, fauna and sedimentology)” and “Highland biodiversity and ecosystems”, explored the proxies used in paleoclimate and paleoenvironmental reconstructions of prehistoric sites and different depositional environments and how they help with understanding the environmental context of evolution and adaptation and the dispersal of humans (Fig. 1). Sessions 3 and 4 on “Late Pleistocene-Holocene climate and rainfall variability, and human environment interactions” and “Global change impacts, adaptations and vulnerability assessment” focused on patterns and evidence of global change, and its effects on ecosystems, human populations and adaptation. Session 5 on “The quaternary fossil and archeological record” explored various fossil and archeological records from early Pleistocene and Holocene contexts to historic ones. Session 6 on “Heritage resource governance and sustainable development” showcased selected heritage resources, their vulnerabilities, enhanced management and conservation statuses, and their use as instruments for improving local community livelihoods and sustainable development.
During general discussion, plans for two possible collaborative research areas in carnivore ecology and heritage resource development were shared and interested researchers invited to take part.
At the EAQUA business meeting held at the end of the conference new executive members were elected and the following resolutions made:
• The EAQUA secretariat will work on various publicity and outreach programs to increase the membership base, including affiliation with similar research associations and reaching out to other eastern African countries not yet participating in EAQUA activities e.g. South Sudan, Rwanda, Burundi, Eritrea, Djibouti and Somalia with the aim of mobilizing more researchers and students from eastern Africa to join the association.
• Set up a mentoring and capacity building program designed to be a pre-conference activity involving training on research, technical and logistical planning, grant applications as well as preparation of conference presentations and publications.
• Funds will be sourced for an EAQUA research program to include field training of students and young researchers.
• The local organizing committee and EAQUA secretariat will coordinate the publication of the current conference proceedings in Quaternary International.
• Members were urged to participate in the upcoming INQUA early career researchers and Pan African Quaternary research association workshops.
The participants elected Asfawossen Asrat as president, Christine Ogola as vice president, Morgan Andama as secretary general, Jackline Nyiracyiza as treasurer, Elgidius Ichumbaki as newsletter editor, Stephen Rucina and Pastory Bushozi as national representatives for Kenya and Tanzania, respectively, Alfred Muzuka as ex-officio member, and Margaret Avery as INQUA representative, for the next two years.
affiliation
Archaeology Section, National Museums of Kenya, Nairobi, Kenya
contact
Christine A. Ogola: cogola gmail.com
references
Ilham Bouimetarhan1, L. Dupont1, C. Itambi2 and J.-B.W. Stuut1,3
Bremen, Germany, 4-8 November 2012
The global distribution and composition of vegetation is largely controlled by climate. Vegetation can however, exert an important influence on surface energy fluxes and the hydrological cycle through alteration of the surface albedo and biogeochemical processes, thus impacting climate locally. In Africa, where climate and vegetation data are sparse, our understanding of the interaction between vegetation and climate and its consequences for the formation and maintenance of terrestrial ecosystems is still poor. But this understanding is crucial to identify feedback effects on different spatial and temporal scales.
This four-day workshop focused on the study of dynamic interaction of climate and vegetation by combining a large set of African vegetation and hydrology records. These sedimentary records were recovered from marine and terrestrial sites in West, East and Southern Africa. Forty scientists from 13 countries participated in the workshop, 11 of them are based in Africa.
The workshop began with a two-day educational program for early-career scientists. Keynote lectures provided networking opportunities with international experts on African vegetation, meteorology, climate observations, and model simulations. The presentations addressed the topics climate-vegetation interactions, model simulations of past vegetation changes, and the understanding of modern climate processes. The early career scientists had the opportunity to visit the labs at MARUM, the IODP core repository center, and the Department of Geosciences, and were also familiarized with the various funding opportunities for collaborative research projects at German institutions.
The second part of the workshop consisted of five oral presentation sessions dealing with: 1) present-day vegetation, environmental degradation, meteorology and remote sensing; 2) past vegetation and its response to abrupt climate change in West Africa; 3) South African paleoenvironments; 4) hydroclimate and vegetation in East Africa; and 5) an open discussion on scientific challenges in Africa and futures activities.
A number of scientific questions emerging from the workshop reflected that African scientists are more involved in research on the actual consequences of ongoing climate change and their impact on local communities, rather than on more fundamental questions regarding climate mechanisms. For example, the consequences of present-day rising sea levels are of greater concern to communities than understanding sea-level changes in the past. There are also concerns about the intensification of rainfall already leading to increased erosion of tropical soils, and potentially damaging infrastructure and drinking water facilities.
Several key research foci were agreed on in the plenary discussion on the last day of the workshop: a) comparison of terrestrial and marine records; b) addressing age model uncertainties; c) the driving forces of climate and vegetation change, including the Atlantic meridional overturning circulation, Indian Ocean sea surface temperatures, insolation, ITCZ/tropical rainbelt migration; d) East-West versus North-South gradients; e) timing and mechanism leading to the African Humid Period. Possibilities are presently being explored to collaborate on these research foci.
 |
|
Figure 1: Alchornea pollen distribution (% of total pollen) in the marine sediment along the African coast illustrates orbital scale vegetation changes. The maps show that during the Last Glacial Maximum, (LGM, left) outside the equatorial region only, very little Alchornea pollen are found. This suggests a reduction of the tropical rain forest area compared with the mid-Holocene (right). Figure modified from Jolly et al. (1998), Elenga et al. (2000) and Dupont (2011). |
Proxy studies were also discussed, including how to improve vegetation reconstructions using pollen analysis with emphasis on provenance, transport pathways and modern analogs (e.g. Fig. 1). New proxy types should be thoroughly reviewed before application, especially stable hydrogen isotopes. But, stable carbon isotopes, a common proxy for the contribution of C3- and C4-plants, should also be reviewed because interpretations can vary locally depending on the impact of temperature or aridity on the vegetation.
The importance of involving people from the modeling community was also discussed, since patterns of past vegetation changes can be used to improve climate models and the accuracy of future predictions. Finally, the need for better communication between marine and terrestrial research communities, and between data and modeling communities was identified and discussed. It is acknowledged that the availability of climate information in Central Africa is sparse. This gap needs to be filled in order to obtain a more complete overview of African climate-vegetation interaction.
affiliations
1Center for Marine Environmental Sciences (MARUM), University of Bremen, Germany
2Department of Geosciences, University of Bremen, Germany
3Royal Netherlands Institute for Sea Research (NIOZ), Den Burg, The Netherlands
contact
Ilham Bouimetarhan: bouimetarhanuni-bremen.de
references
Dupont L (2011) Quat Sci Rev 30: 3589-3602
James M. Russell1, B. Otto-Bliesner2 and Z. Liu3
Providence, USA, 4-7 November 2012
 |
|
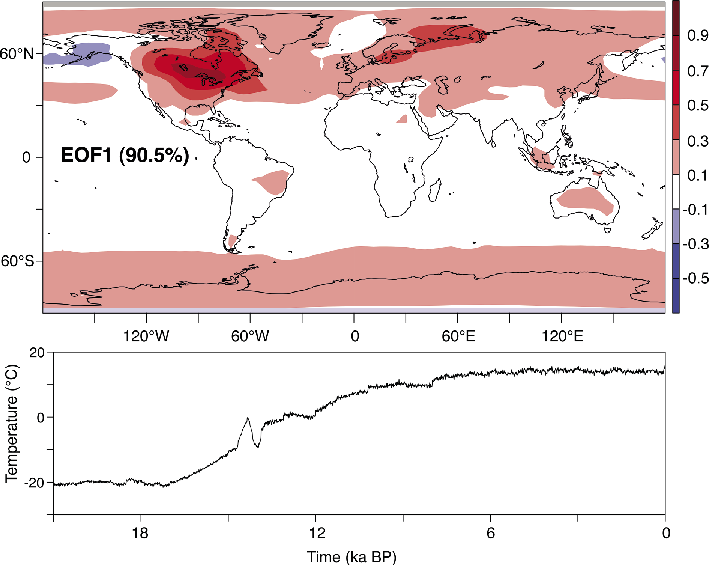
Figure 1: The first empirical orthogonal function of global temperature change from 21 ka BP to the present, simulated by CCSM 3. Nearly the entire planet warmed, with warming focused over the high latitudes, and North America and Northern Europe in particular, with both gradual and abrupt temperature changes occurring during the past 21 ka BP. |
Recent years have seen rapid advances in the study of climate changes during the last 21-ka driven both by new proxy evidence and new modeling activities. On the proxy reconstruction side, new high resolution records based upon speleothems, marine, and lacustrine sediments have documented a highly variable evolution of regional climate, with considerable spatiotemporal variability that includes responses to freshwater forcing (e.g. the Younger Dryas and Heinrich 1 events), greenhouse gas and orbital forcing, and coupled vegetation-climate changes. On the modeling side, climate models and computer power have been enhanced significantly in recent years such that the transient climate evolution can now be simulated with state-of-the-art fully coupled general circulation models (e.g. Fig. 1). The flood of new proxies and model data requires community-wide activities to critically assess and synthesize proxy reconstructions, and evaluate these in light of the comprehensive, global framework afforded by climate model simulations.
PAGES and the US NSF sponsored a SynTRaCE-21 (Synthesis and Transient Climate Evolution of the last 21 ka) workshop to discuss and plan a synthesis of proxy climate records and model simulations of the major features of global climate of the last 21 ka. The workshop, attended by 43 participants from five countries used plenary sessions and breakout discussions to define critical hypotheses and questions in the three following areas.
Tropical hydrology of the past 21 ka
Proxy data indicate that tropical precipitation exhibits complex spatio-temporal patterns during deglacial and Holocene times. These include north-south migration of the Intertropical Convergence Zone, as well as more poorly understood zonal reorganizations of the ocean-atmospheric circulation. Proxy records are now sufficiently dense to compare reconstructed patterns of deglacial precipitation changes in the tropics to transient model simulations. This allows the assessment of the response and sensitivity of zonal and meridional circulation in the tropics to deglacial climate forcings, including orbital forcing, radiative forcing from greenhouse gases, and glacial processes. Data-model comparison could also be used to investigate the evolution of millennial-scale precipitation changes in the tropics.
Deglacial ocean circulation change
Changes in ocean circulation are known to have played a critical role in the Earth’s climatic and biogeochemical evolution during the last glacial termination. Marine sediment records also indicate important changes in deglacial ocean circulation in response to meltwater forcing. Despite these advances, many of the key mechanisms and circulation changes of the deglaciation are still poorly understood. Deglacial meltwater pulses, for instance, are known to have strong impacts on climate, but where do deglacial meltwater pulses go in the ocean, and how do they impact convection and circulation? Similarly, although changes in ocean circulation are known to have strong effects on global biogeochemical cycles, we know little about changes in the ocean’s most biogeochemically active waters: the intermediate ocean. How did intermediate ocean circulation vary across the last glacial termination?
Abrupt changes in the Holocene
Many regions experienced abrupt climate changes during the Holocene due to feedbacks between climate, land surfaces, and sea surface temperature variations. The collapse of the North African “Green Sahara” ecosystem due to interactions between the African monsoon, subtropical Atlantic sea surface temperatures, and North African vegetation is a prime example. Key questions to be addressed through data-model comparison activities include the dynamics of abrupt climate changes during the Holocene (rates of change, spatial synchronicity), the role of vegetation feedbacks in amplifying or even triggering abrupt climate change, and the ability of climate models to simulate abrupt climate change in the Holocene in the absence of abrupt forcing.
These questions will be addressed by the SynTRaCE-21 working group through focused data-model activities in the coming year.
affiliations
1Department of Geological Sciences, Brown University, Providence, USA
2National Center for Atmospheric Research, Boulder, USA
3Center for Climatic Research, University of Wisconsin, Madison, USA
contact
James M. Russell: James_RussellBrown.edu
Celebrating 20 years
In this issue we celebrate 20 years of PAGES news. You can read our paleobibliographic analysis on the next page, and take a trip back in time and enjoy the first ever copy of PAGES news from 1993. A reprint is included in this issue as an insert (it was much smaller then).
Communications update
PAGES has now joined the Twitter-sphere. Follow us to get all the latest news:
@PAGES_IPO. You can also subscribe to our new YouTube channel: Past Global Changes, and of course, we’ve still got the Facebook fan page: PAGES Past Global Changes.
Staff update
Welcome to our two new staff members: Nicole Wegmüller (Finance and Office Manager) and Leonie Goodwin (Communications and Project Officer).
PAGES OSM and YSM
The Open Science and Young Scientists Meetings continue to resonate. We recently uploaded videos of seven plenary talks with the accompanying PowerPoint slides and some short video montages to our YouTube channel: Past Global Changes. You can also read reports on the YSM activities written by the participants, starting on page 89.
PAGES umbrella programs
The transformation of the landscape of Global Environmental Change programs is taking shape. The new Future Earth program has now established a Scientific Committee and an Interim Secretariat with an Interim Director. You can check the names of the personnel on the Future Earth website (www.icsu.org/future-earth) and keep informed via their media, including a newsletter and a blog. Our current umbrella program IGBP has decided to sunset by the end of 2015. The PAGES SSC has decided that over the next two years PAGES should join the Future Earth network, while at the same time continuing to collaborate with other organizations.
IGBP Scientific Committee in Bern
In April, PAGES, together with ProClim and the Oeschger Centre, hosted the IGBP Scientific Committee Meeting in Bern. IGBP SC members came together from around the globe to discuss potential synthesis projects, IGBP’s legacy and how best to transition into the new integrated Future Earth super-program in the coming years.
Support for meetings
During its meeting in June, the PAGES SSC granted support for a total of ten scientific and educational meetings. The next deadline for applying for PAGES meeting support is 20 September 2013. Support can be sought for workshop-style meetings relevant to PAGES Foci and Cross-Cutting Themes. The three eligible categories are PAGES Working Group meetings, workshops with a training or education focus, and an open call for other workshops that are relevant to PAGES science. Application guidelines and forms can be found on the PAGES website > My PAGES > Meeting Support.
Guest scientists
We are pleased to welcome two guest scientists to the PAGES office this summer: Gisela Winckler from the Lamont-Doherty Earth Observatory, US and Bernd Zolitschka from the University of Bremen, Germany. Among other things, they are working alongside PAGES staff to edit upcoming editions of PAGES news. You can learn more about our Guest Scientists and the work they are doing on the PAGES website > People > Guest Scientists.
Introducing the new mini section
We hope you enjoy our first Science Highlights mini section; in this issue it focuses on Data Assimilation. The new mini section format will feature 4-5 articles focusing on a specific topic, and might appear more regularly in future issues depending on demand.
Upcoming newsletters
The next two issues of PAGES news will focus on dust and on annual recorders of the past. While the dust issue is already closed, suitable articles for the annual recorders issue are still welcome. Contributions should explore the question of how natural archives with annual resolution are approaching the temporal resolution of instrumental records. Submissions should be discussed with Bernd Zolitschka (zoliuni-bremen.de) and be submitted before the 15th of September. As always, you are invited to submit Science Highlights, Program News, and Workshop Reports for the Open Section of PAGES news. Author guidelines can be found on the PAGES website > My PAGES > Newsletter.
The four-page insert included in this issue is a copy of the first ever PAGES news created 20 years ago in Spring 1993. We thought this milestone provided an opportunity to reflect on how far PAGES news has come in that time, but also how many of the issues discussed in our first newsletter still remain pertinent today.
A quantitative paleobibliographic analysis reveals the steady growth of PAGES news in the last 20 years. We found evidence of five distinct stylistic eras and observed that the number of pages in each issue has increased 12-fold from four in 1993 to around 50 in current issues (Fig. 1). Likewise there is a strong correlation between the number of pages and the number of science highlights articles (r2= 0.92; P<0.01), with early issues usually containing one article and more recent issues 15±2. If this trend continues over the next 20 years, PAGES news will be a daunting 100 pages thick and feature 35 articles by the year 2033!
Hans Oeschger, the first chair of PAGES, observed in his introduction to the first issue that global change research is advancing at a remarkable pace, and many of the issues he highlighted back in 1993 are still relevant today. An improved understanding of past global change is crucial for evaluating present environmental conditions and for creating predictive climatic models. Paleoclimatic and paleoenvironmental data have the unique ability to provide detailed insights into ecosystem responses to climate change at different time scales, which can inform future policymaking.
We hope you enjoy a little trip back in time via our first issue. And for anyone thinking about replying to the Call for Title Suggestions advertisement on the last page: Although we have happily stuck to the “unimaginative title” PAGES news for 20 years, we are, of course, still open to your suggestions for improvement.
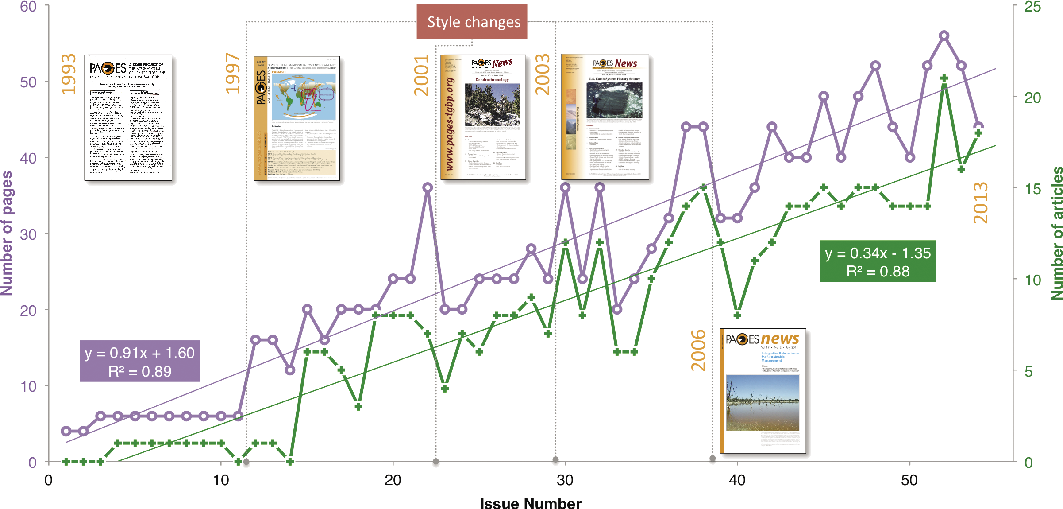
Figure 1: Paleobibliographic analysis of PAGES news.
Pascale Braconnot1, C. Brierley2 and S.P. Harrison3,4
 |
|
Figure 1: La Niña event of 1999. Left: Positive (purple) and negative (blue) sea surface temperature anomalies. Right: Positive (blue) and negative (brown) rainfall anomalies (mm). The four El Niño regions referred to in the following articles are depicted in the right panel. Images from NASA. |
 |
|
Figure 2: El Niño event of 1997. Left: sea surface temperature anomalies. Blue: negative, purple: positive. Right: Rainfall anomalies (mm). Brown: negative, blue: positive. Images from NASA. |
The El Niño-Southern Oscillation (ENSO) is one of the major climate phenomena affecting our global environment (Figs. 1 and 2), but current understanding of ENSO is limited. Instrumental records are too short to allow us to document its spectrum of variability and there is little knowledge of how variability alters with changes in the climate mean state, for example with anticipated global warming.
In the PAGES news issue "Paired perspectives on global climate change" (2012), Amy Clement highlighted some important issues about the decadal variability, predictability and modeling of ENSO with global warming. As pointed out by Julien Emile-Geay in the same issue, paleoclimate data are a valuable resource to improve our understanding of these issues, even though the past does not provide direct analogs for the future. Analyses of high-resolution paleoclimate indicators and the possibility of long simulations with the same climate models used for future climate projections offer new opportunities for improving our understanding of ENSO. One of the foci of the working group on climate variability in the 3rd phase of the Paleoclimate Modeling Intercomparison Project (PMIP3; Braconnot et al. 2012a) is to foster the synthesis of high-resolution data and the development of new data-model comparison methodologies to examine changes in ENSO.
The future of ENSO research
The suite of papers presented in this newsletter is one outcome of the PMIP workshop on “Tropical climate variability with a focus on last millennium, mid-Holocene and Last Glacial Maximum” which took place in the south of France in September 2011 and was co-sponsored by PAGES (Braconnot et al. 2012b). The articles provide an overview of high-resolution records and modeling studies that can be regarded as a basis for future ENSO research. Individual contributions address how one can extract ENSO-relevant climate information from tree rings, corals, giant bivalves, or shells, and how modeling can be used to test explicit hypotheses to improve the interpretation of paleoclimate records as well as to infer the mechanisms of climate change. The articles also illustrate some fundamental questions that need to be addressed in preparing multi-proxy reconstructions of past ENSO behavior and in analyzing paleoclimate modeling results. We consider these studies to be the first step towards a comprehensive evaluation of whether climate models incorporate the right physics and feedbacks to reproduce the diversity of ENSO events.
Pulling the pieces together
An exciting development, showcased in this special issue, is that many different types of records exist that document short term climate variability (see Elliot et al. p. 54 and Carré et al. p. 56) and that pooling information from multiple types of records provides a pan-tropical picture of ENSO. The contributions here and in other recent papers (e.g. Cobb et al. 2013), demonstrate that the process-level understanding of individual records has improved over recent years (see Elliot et al. p. 54 or McGregor et al. p. 52). This includes the recognition that it is rare for paleoclimate records to reflect a single climate variable (e.g. temperature or salinity) or aspect of climate variability (e.g. seasonal phasing or magnitude changes in mean frequency or in extremes). The challenge now is to find ways to synthesize the disparate aspects of the records and to take advantage of the wider range of information available to provide an overview of ENSO variability (see Russon et al. p. 62 or Thompson et al. p. 60).
Modeling improvements
A second important development is the improvement in modeling capacity and analytical approaches. Coupling between different components of the climate system is notoriously difficult and this poses problems for simulating aspects of the climate system, such as ENSO, that are primarily driven by the coupling between the ocean and atmosphere (see Capotondi et al. p. 58 or Lazareth et al. p. 66). Nevertheless, with improved model physics, increased spatial resolution, more routine incorporation of tracers (e.g. isotopes) and biogeochemistry, and the ability to run much longer simulations, state-of-the-art models are increasingly yielding important insights into ENSO. Model simulations show that ENSO displays non-stationary behavior in space and time, including the strength of ENSO teleconnections (Capotondi et al. p. 58, Merkel et al. p. 68). The simulations imply that the ENSO phenomenon has to be decoupled into different components, such as mean state, hydrology and teleconnections that change independently depending on the forcing (see Braconnot et al. p. 64). The lessons learned from models and their integration with observations pose ambitious challenges to the interpretation of the ENSO-relevant signal in paleoclimate records (Russon et al p. 62, Brierley p. 70, Lazareth et al. p. 66).
Towards data and model integration
It is a pivotal time for the ENSO community. We see a real need for new activities. First and foremost, there needs to be a more integrated approach to combining data and modeling for hypothesis testing. To facilitate this, the community needs to synthesize more primary data across regions and realms. This will allow us to capitalize on the improvements in process understanding that are emerging from both data analyses and modeling experiments. The other requirement is developing statistical and analytical tools that combine the two sources of information (data and model outputs) to disentangle the evolution of mean state, seasonality, and interannual to decadal variability. To develop these approaches and tools, we see a need for a dedicated activity within the PAGES and PMIP communities that brings together the full range of expertise. This is the only way to answer the fundamental questions about the relationships between the background climate state, the seasonal cycle and ENSO variability.
affiliations
1Laboratoire des Sciences du Climat et de l’Environnement, unité mixte CEA-CNRS-UVSQ, Saclay, France; pascale.braconnotlsce.ipsl.fr
2Department of Geography, University College London, UK
3Department of Biological Sciences, Macquarie University, North Ryde, Australia
4Centre for Past Climate Change and School of Archaeology, Geography and Environmental Sciences, University of Reading, UK
Selected references
Full reference list online under: pastglobalchanges.org/products/newsletters/ref2013_2.pdf
Braconnot P et al. (2012a) Nature Climate Change 2: 417-424
Braconnot P, Harrison SP, Tudhope S, Michaut C (2012b) PAGES news 20(1): 51-52
Myanmar monsoon drought variability inferred by tree rings over the past 300 years: linkages to ENSO
Rosanne D’Arrigo1, J. Palmer2, C. Ummenhofer3, N.N. Kyaw4 and P. Krusic5
A new tree-ring record of teak from Myanmar yields information about past tropical monsoon rainfall variability, including sustained drought conditions, and climatic effects of the El Niño-Southern Oscillation (ENSO), dating back nearly four centuries.
Extreme climatic conditions linked to the Asian monsoon and modulated by the ENSO system, such as droughts and floods, severely impact human populations. In 2008, Cyclone Nargis caused >138,000 fatalities and more than an estimated 10 billion US$ in economic damage. However, our knowledge of monsoon climate and ENSO-related impacts remains limited, not the least due to sparse paleoclimatic information. Such information is especially scarce for Myanmar, which is directly impacted by the effects of the monsoon but where even instrumental climate records and related studies of monsoon climate dynamics are rare. Much of the country experiences pronounced wet and dry seasons linked to the seasonality of the monsoon. Myanmar rainfall correlates significantly with indices of ENSO and Indian monsoon rainfall (e.g. All India Summer Monsoon Rainfall and Core Indian Rainfall), although these relationships are spatially and seasonally variable and not very well understood. Myanmar’s location in the transition zone between the South Asian and East Asian monsoon systems results in a particularly complex spatial pattern of precipitation variability.
Asian Monsoon dendroclimatology
Gleaning additional information on the long-term climate variability of Myanmar and greater monsoon Asia relies on records from natural or historical paleoclimatic archives. Tree rings are often ideal as they can yield precisely dated, annual time series, also referred to as “chronologies”, dating back centuries to millennia. Studying tropical tree rings poses considerable difficulties because of the lack of pronounced seasons at low latitudes where monsoonal rainfall occurs, and the associated obstacles in identifying tree species that can be dated for dendrochronology. Nevertheless, much progress in chronology development has been made in recent years that now allows us to reconstruct past climate in tropical Asia from tree rings (e.g. Cook et al. 2010, Monsoon Asia Drought Atlas MADA; Buckley et al. 2007, 2010; Ummenhofer et al. 2013).
The MADA tree-ring dataset was analyzed for past changes in the Palmer Drought Severity Index (PDSI) and thus provided evidence for major droughts and wet events in Southeast Asia (e.g. Indonesia, Thailand, and Vietnam). However, in the case of Myanmar, tree-ring data coverage is still exceedingly sparse and represents a sizeable gap in paleoclimate information of monsoon Asia. Here we present a new record for Myanmar that can be incorporated into the MADA network.
Myanmar teak
 |
|
Figure 1: Map of Myanmar and adjacent southern monsoon Asia. Pink dot is Maingtha Forest Reserve (MFR) teak tree-ring site north of Mandalay. Background shows monthly Global Precipitation Climatology Centre rainfall data for the period 1951-2007, averaged for May–October when the majority of Myanmar annual rainfall occurs. The figure shows the lower mean rainfall in central Myanmar (modified from D’Arrigo et al. 2011). |
 |
|
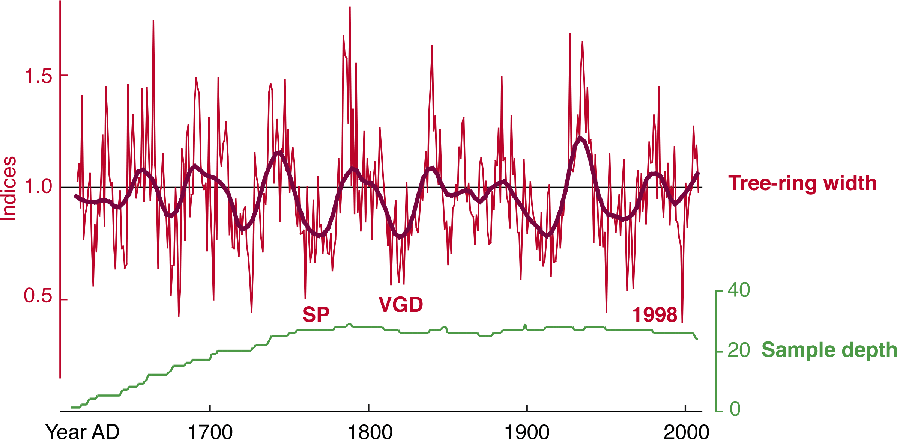
Figure 2: Tree-ring width chronology of teak (in dimensionless indices or values) for central Myanmar, spanning 1613-2009 AD, with sample depth (number of individual tree samples). Sample depth is near its peak over much of the chronology, gradually declining prior to the middle 1700s. Plot labels time of Strange Parallels (SP) drought in the 1700s (Buckley et al. 2007, 2010), the late Victorian Great Drought (VGD), and narrow ring at time of 1997-98 “El Niño of the Century” (modified from D’Arrigo et al. 2011). |
Teak (Tectona grandis) is one of the tree species that has been used most successfully for tropical dendroclimatology. It is endemic to Myanmar, but due to its great commercial value it is now rapidly disappearing across the country. Our new ring width chronology of teak for the Maingtha Forest Reserve is one of the first high-resolution proxy records that were developed for Myanmar (Figs. 1 and 2; D’Arrigo et al. 2012). It is based on 38 individual series from 20 living trees and spans the years 1613-2009 AD. Teak growth at the site is positively correlated with rainfall and PDSI variability over Myanmar, during and prior to the May-September wet monsoon season. Accordingly, the Maingtha Forest Reserve record reveals past variability of Myanmar hydroclimate.
Monthly correlations between the Myanmar teak ring-width chronology (Fig. 2) and instrumental PDSI (1950-2003 AD) were computed for the region overlapping our teak site (15-25°N, 95-105°E), for the period, from the year prior to the current year of radial growth to the current year. Statistically significant (95% level), positive correlations were found for the months concurrent and just prior to the wet monsoon season, from around April to August. Correlations with PDSI are strongest when averaged over May and June (r = 0.32, n = 54), reflecting the importance of moisture availability for teak growth in central Myanmar around the time of monsoon onset. Comparison with local monthly station rainfall records (e.g. for Mandalay and Yangon) further confirms that teak growth in central Myanmar is controlled by moisture availability.
This teak record also correlates significantly with larger-scale climate indices, including those for core Indian rainfall and ENSO. With the IITM All-India monsoon rainfall index, correlation for May-Jun is r = 0.36 (p < 0.01, n = 57). Correlations are stronger using the core northeast Indian monsoon rainfall index, which represents the region of India opposite the Bay of Bengal from Myanmar (23°N, 76°E). Averaged over Jan-Jun (1950-2006), the correlation is r = 0.46 (p < 0.001). For East Uttar Pradesh, a subdivision of this core region, the correlation is 0.47 since 1950 (Jan-Jul, p < 0.001, n = 57); and r = 0.29 over the maximum common period (p < 0.001, n = 136; 26°N, 82°E).
The Myanmar teak chronology correlates negatively with Niño-3 SST (Jul-Aug, r = -0.27, p < 0.05, n = 60). This is consistent with the tendency for positive Niño-3 SSTs, as during El Niño warm events, to be linked to drought conditions and decreased teak growth over southeast Asia, due to the eastward migration of the Walker circulation. Notably, Myanmar teak growth in the year 1999, following the so-called “El Niño of the Century” of 1997-1998, is the lowest of any year on record (Fig. 2). The year 1998 also shows the lowest annual rainfall value for central Myanmar. Myanmar teak growth is also below average during the Strange Parallels drought (Fig. 2) found across southeast Asia in the 1700s. The late Victorian Great Drought was associated with a major ENSO warm episode (1876 to 1878) and is perhaps the most spatially pervasive and severe drought in the MADA tree-ring data set for monsoon Asia (Cook et al. 2012; Buckley et al. 2007, 2010).
The potential of the new Myanmar record
Our new teak tree-ring width chronology from central Myanmar, one of the first paleoclimate records published for this country, is significantly and positively correlated with local and regional precipitation as well as with larger scale indices of Indian monsoon core rainfall, particularly over northeastern India. The Myanmar teak records also correlate negatively with Niño-3 SST, consistent with the tendency for El Niño warm events to be linked to drought over Southeast Asia, as they were following the pronounced 1997-1998 warm event. Thus, this teak record reflects not only local conditions, but also the large-scale strength of the circulation of the Asian monsoon-ENSO system. The timing of the inferred drought conditions coincides with megadroughts identified elsewhere in southeastern Asia, including Thailand and Vietnam (Buckley et al. 2007, 2010), and which are attributed to variability in the tropical Indo-Pacific climate system and the Intertropical Convergence Zone. Overall, our results indicate much potential for generating reconstructions of monsoon climate dynamics for Myanmar and the wider region from tree-ring data.
note
MADA dataset available online at the NOAA Paleoclimatology website, International Tree-Ring Databank (ITRDB).
affiliations
1Lamont-Doherty Earth Observatory (LDEO), Palisades, USA; rddldeo.columbia.edu
2Gondwana Tree-Ring Laboratory, Canterbury, New Zealand
3Woods Hole Oceanographic Institution, Woods Hole, USA
4Forest Department, Naypyidaw, Myanmar
5Bert Bolin Centre for Climate Research, Sweden University, Stockholm, Sweden
references
Buckley B et al. (2010) PNAS 107: 6748-6752
Buckley B et al. (2007) Climate Dynamics 29: 63-71
Cook E et al. (2010) Science 328: 486-489
D’Arrigo R et al. (2011) Geophysical Research Letters 38, doi:10.1029/2011GL049927
Helen V. McGregor1, C.D. Woodroffe1, M. Fischer2, M.K. Gagan3 and D. Fink2
Porites coral microatolls show δ18O signal reproducibility and fidelity comparable to more conventional coral growth forms. Longer-lived and fossil microatolls, which grow in suitably flushed environments, contain δ18O signals that can significantly extend instrumental records of the El Niño-Southern Oscillation.
Porites corals are the most commonly used genus for reconstructing El Niño-Southern Oscillation (ENSO). This hermatypic coral is found in all tropical reef environments (Veron 2000) with a variety of growth forms. Climate reconstructions of a century or more have been obtained from the most common, dome-shaped Porites growth form, whereby the colonies, beginning from the substrate, grow outward and upward towards the ocean surface (Knutson et al. 1972). Domed structures, however, are not the only Porites growth form.
Coral microatolls
 |
|
Figure 1: Porites coral microatoll image and X-radiograph. (A) Porites coral microatolls on a reef flat at low tide. (B) Positive X-radiograph cross- section through a Porites microatoll. Dark and light bands are the high and low-density bands, respectively, that form as the coral grows. Starting from the center, the coral grows upwards until further upward growth is constrained by exposure during the minimum low water level (in this case, 1997/1998). Lateral growth then ensues resulting in a discoid microatoll structure. The location of the living surface in 2007 when the coral was collected is indicated. Dashed lines indicate the outline of coral pieces not X-rayed. |
Porites coral microatolls are found on shallow reefs where reef topography enables individual colonies to grow up to the average spring low tide level. Further upward growth is limited due to exposure of the upper coral surface at low tide (Stoddart and Scoffin 1979). At this point, the coral then grows laterally, resulting in a flat-topped discoid growth morphology termed “microatoll” (Fig. 1).
Coral microatolls can live for decades to many centuries (McGregor et al. 2011a), are distributed broadly across the Indo-Pacific region (Scoffin and Stoddart 1978), and their preservation potential is particularly high due to the possibility for rapid burial beneath sand and coral rubble through storm ridge or beach deposition. Microatolls provide information about past water levels, from which sea level, climatic, or tectonic histories have been derived (Natawidjaja et al. 2004; Sieh et al. 2008; Smithers and Woodroffe 2001; Taylor et al. 2008, 1987; Woodroffe and McLean 1990; Woodroffe et al. 2012; Zachariasen et al. 1999). Microatolls also have the advantage of sampling a narrow depth range over long periods of time, which is desirable when reconstructing depth-dependent, ENSO-related variables, such as sea surface temperature (SST) and sea surface salinity (SSS), together with changes in ocean dynamic height, in the tropical Pacific.
Studies of domed Porites show that there can be significant differences in skeletal δ18O on the sides and tops of the corals and this is equally a concern for laterally-growing microatolls (e.g. Cohen and Hart 1997; McConnaughey 1989). However, testing of δ18O variability within and between Porites sp. microatolls living on reef flats around Kiritimati (Christmas) Island in the central Pacific ocean, demonstrates no significant differences between δ18O records from different growth orientations within a single microatoll, or between records from microatolls in different reef settings (McGregor et al. 2011b). Moreover, δ18O records from microatolls and from conventional domed Porites from elsewhere on the atoll (Evans et al. 1998b; Nurhati et al. 2009) also show similar patterns and magnitude of variability. Together, the results show that Porites microatolls can be used interchangeably with dome-shaped corals to reconstruct tropical climate variability.
ENSO and δ18O in modern microatolls at Kiritimati Island
 |
|
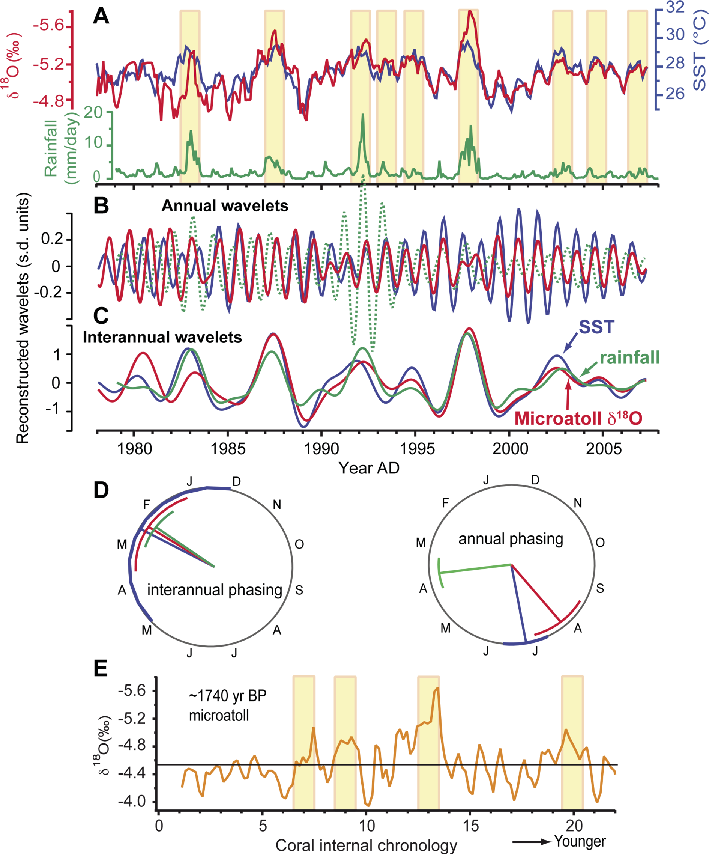
Figure 2: Variability of Kiritimati Island records. (A) Comparison of the stacked microatoll δ18O record (red line) with Kiritimati SST (blue line) and monthly rainfall (green line). The stacked δ18O is a composite of three microatoll records from Kiritimati. The microatoll δ18O record is strongly anti-correlated with Kiritimati SSTs (r = -0.71) and is sensitive to El Niño events (yellow bars). (B) Annual-scale and (C) interannual-scale wavelets for the stacked microatoll δ18O (red, y-axis inverted), SST (blue), rainfall (green). (D) The circular phase plots show the calendar month (and 95% confidence intervals) when, on average, the wavelets in B) and C) reach their maximum value. In general the microatoll δ18O record tracks SST variations. The rainfall is in phase with the SST and coral δ18O data at the interannual scale, but is out of phase at the annual scale. (E) Profile of a δ18O microatoll from Kiritimati dated at ~1740 yr BP, placed on a new floating age scale (unpublished data) that shows El Niño events (yellow bars) similar to those of the past few decades. Black horizontal line is the mean δ18O. Figure modified after McGregor et al. (2011b), and Woodroffe and Gagan (2000). SST and rainfall data from ERSSTv3b (Smith et al. 2008) and GPCPv2 (Adler et al. 2003), respectively. |
Kiritimati Island is optimally located (Evans et al. 1998a) for reconstructions of ENSO. The island lies within the dry equatorial zone of the central Pacific, and in the NINO3.4 index region where SST variations define ENSO events (Bjerknes 1969; Ropelewski and Halpert 1987). In this region El Niño events result in marked positive SST anomalies of up to 3°C in the boreal winter, whereas La Niña events produce negative SST anomalies of 1-2°C (Wyrtki 1975; Fig. 2a). Rainfall also shows a dominant ENSO signal with higher annual precipitation during El Niño years.
Porites microatolls from Kiritimati register these climatic variations. Variations in a composite (stacked) monthly microatoll δ18O record spanning the years 1978-2007 show a strong inverse correlation of r = -0.71 with SST and records major El Niño events (McGregor et al. 2011b; Fig. 2a). This is similar to findings for domed-Porites from Kiritimati where 70% of the variance is shared with SST (Evans et al. 1999). The stacked microatoll δ18O record also corresponds with anomalously high rainfall years (Fig. 2a); annual mean coral δ18O values of less than -5.3‰ are found only in years when total annual rainfall is above 1800 mm. In addition to local SST and rainfall, the microatoll δ18O signal is also negatively correlated with both SST and precipitation amount over a broad area of the equatorial Pacific (McGregor et al. 2011b). Since most of the covariance between δ18O, SST and precipitation is due to ENSO, the spatial correlations reflect the characteristic ENSO pattern.
ENSO and seasonal cycle variance patterns
Understanding ENSO annual and interannual cycle variance and interactions can provide important information on ENSO processes (Guilyardi et al. 2009). ENSO variance is recorded in the stacked microatoll δ18O record. The record (Fig. 2b,c) tracks SST variability at interannual (ENSO; 53% of the δ18O variance) and annual timescale (14%), consistent with existing analyses of instrumental tropical Pacific SSTs (Chiu and Newell 1983). Changes at annual and interannual scales at Kiritimati are reminiscent of the climate signal of the eastern equatorial Pacific (Chen et al. 1994; Mitchell and Wallace 1992).
ENSO events occur irregularly every 2-8 years, yet individual events show a distinctive SST pattern tied (or “phase-locked”) to the seasonal cycle, such that El Niño SST anomalies peak during the boreal winter (DJF). The interannual component of SST and rainfall records for Kiritimati Island show maxima in February, as does microatoll δ18O (Fig. 2d). At the annual scale, the microatoll δ18O, which peaks in July-August, varies predominantly in-phase with SST, rather than with rainfall. The annual maximum in Kiritimati rainfall occurs in March-April, due to the position of the Intertropical Convergence Zone (ITCZ) (An and Choi 2010; Horel 1982; Mechoso et al. 1995; Waliser and Gautier 1993). That the microatoll δ18O tracks SST at the annual and interannual scale is important; SST variations in the NINO3.4 Index region are used to define ENSO variations. Accordingly, microatoll δ18O from the NINO3.4 region, such as Kiritimati Island, can be used to reconstruct past ENSO variations at multiple timescales.
ENSO signal in fossil microatoll δ18O
Fossil Porites microatolls, which were growing in well-flushed environments, offer opportunities to reconstruct tropical SST and ENSO variability beyond the limits of the instrumental record. Initial studies confirm reduced ENSO variability during the middle Holocene (Woodroffe et al. 2003). Individual ENSO events in the late Holocene (Fig. 2e) however, appear at least as intense as those experienced in the past two decades (Woodroffe et al. 2003). One particular El Niño event from 1740 yr BP (Fig. 2e) shows a negative δ18O excursion to ~5.6‰, which suggests substantial addition of 18O-depleted rainfall (Woodroffe and Gagan 2000). The stronger ENSO in the late Holocene may represent tighter coupling in the Pacific between the more southerly ITCZ, the east Pacific cold tongue and the Southern Oscillation, which could amplify ENSO precipitation variability and associated teleconnections. Such a scenario is consistent with terrestrial paleoclimate records indicating a marked increase in El Niño activity from ~3000 yr BP. We are undertaking further analysis of fossil coral microatolls and their annual and interannual variability to test this scenario.
note
Data are archived at WDC-paleoclimatology hurricane.ncdc.noaa.gov/pls/paleox/f?p=519:1:4336223539645946::::P1_STUDY_ID:12278
affiliations
1School of Earth and Environmental Sciences, University of Wollongong, Australia; mcgregoruow.edu.au
2Institute for Environmental Research, Australian Nuclear Science and Technology Organisation, Lucas Heights, Australia
3Research School of Earth Sciences, The Australian National University, Canberra, Australia
selected references
Full reference list online under: pastglobalchanges.org/products/newsletters/ref2013_2.pdf
Evans MN, Kaplan A, Cane MA (1998a) Paleoceanography 13: 502-516
Mitchell TP, Wallace JM (1992) Journal of Climate 5: 1140-1156
McGregor HV et al. (2011b) Geochimica et Cosmochimica Acta 75: 3930-3944
Woodroffe CD, Gagan MK (2000) Geophysical Research Letters 27(10): 1511-1514
Woodroffe CD, Beech MR, Gagan MK (2003) Geophysical Research Letters 30, doi: 10.1029/2002GL015868
Mary Elliot1, K. Welsh2 and R. Driscoll3
Giant clam stable isotope profiles from Papua New Guinea faithfully record all the major El Niño events between 1986 and 2003, thus illustrating the usefulness of this archive to reconstruct past ENSO variability.
Considerable uncertainty remains about the response of the El Niño-Southern Oscillation (ENSO) to future climate scenarios (Merryfield 2006). Reconstructions of past changes in seasonality and ENSO from natural archives have a key role in providing information for understanding both the full range of variability and the sensitivity of ENSO to changes in climate boundary conditions. Geochemical time series extracted from skeletons of annually banded reef-building corals and mollusks constitute powerful records in this regard. A number of exciting recent studies have illustrated how clams (i.e. bivalves) can be used in paleoenvironmental studies (e.g. Sano et al. 2012; Wanamaker et al. 2012).
 |
|
Figure 1: Photo of a live Tridacna gigas from Heron Island. T. gigas are reef dwelling mollusks which have symbiotic algae living within their mantle. Valves are 50 cm from end to end. Photo: K. Welsh. |
Here we specifically illustrate the usefulness of one bivalve species, Tridacna gigas (Fig. 1) as a natural archive for paleo-ENSO. Massive Porites spp. corals and Tridacna spp. clams are both reef-dwelling, aragonite secreting organisms. Their annual bands can be subsampled and analyzed to derive profiles of oxygen isotope ratios (δ18O) which have been shown to reflect the combined effects of regional sea surface temperature (SST) and sea water δ18O from which they precipitate their aragonite structures (Tudhope et al. 1995; Welsh et al. 2011). Time series of δ18O in modern and fossil corals collected in northern Papua New Guinea in the heart of the Western Pacific Warm Pool have been used to reconstruct ENSO variability for short windows of time over the past 130 ka (Tudhope et al. 2001). These records are however extremely rare because of the tendency for the porous Porites skeleton to undergo diagenetic alteration during periods of subaerial exposure. An advantage of T. gigas is that they have relatively impervious and finely layered shells that inhibit infiltration of ground waters that would lead to the diagenetic processes of dissolution, recrystallization and precipitation of secondary calcite. Finally, while coral δ18O show an isotopic disequilibrium, Tridacna spp. precipitate their shells in isotopic equilibrium. This provides the possibility to more accurately quantify past changes in absolute SST and see water δ18O.
Calibration
 |
|
Figure 2: Comparison of T. gigas δ18O profile with ENSO index, local temperature and rainfall data. A) NINO3.4 index, (B) 3pt smoothed monthly rainfall anomaly (mm day-1, NASA/GPCPV2) for 146.25°E, 6.25°S, (C) T. gigas δ18O record, (D) Porites δ18O profiles and (E) 3pt smoothed monthly SST anomaly (from IGOSS) for the same grid box as the rainfall data. Y-axes of the δ18O are inverted. The shaded bands indicate El Niño events. |
To illustrate the potential of T. gigas as paleo-ENSO recorders, we obtained a high-resolution δ18O profile from a modern specimen that we compared to modern Porites coral δ18O profiles and an ENSO index. Samples were collected from three localities along the Huon Peninsula in northern Papua New Guinea. Profiles of δ18O were obtained by subsampling the annual growth bands using high precision microdrilling devices. The age of the coral and bivalve δ18O profiles were obtained independently (i.e. they were not tuned to one another) by counting the annual growth bands when visible and using the δ18O maxima and minima to position the warmest and coolest months. The T. gigas δ18O profile covers the period 1986-2002 and the Porites δ18O records cover the period 1987-2001 (Fig. 2). Average SSTs at the Huon Peninsula are around 29°C with an annual range of 0.5-1.5°C in monthly means. The predicted equilibrium skeletal annual average δ18O is -1.6‰. Therefore, our results confirm that T. gigas precipitate their shell close to isotopic equilibrium as has been shown previously (e.g. Aharon et al. 1991).
Comparison of bivalve and coral profiles
A striking feature is the high degree of resemblance between the coral and bivalve records despite their geographic separation of approximately 30 km and their average δ18O offset of ~4‰ (Fig. 2). Profiles correlate in detail on the seasonal and on the interannual levels. This correlation is particularly interesting given that paleoclimate archives obtained from coastal areas characterized by strong SST and salinity gradients can potentially be significantly influenced by the local micro-environmental hydrography. Our results clearly show that corals and clams record large-scale regional patterns. Furthermore, the good correlation between δ18O coral and bivalve profiles remains constant although measurements have been obtained from different carbonate secreting organisms with fundamentally different biological controls on carbonate formation and different growth rates.
Giant Clams as recorders of ENSO events
In northern Papua New Guinea precipitation and temperatures are coupled on seasonal and interannual timescales. El Niño periods are associated with lower than average SST and drier conditions, whereas La Niña periods are associated with higher than average SST and wetter conditions. The associated changes in see water δ18O and SST will thus have cumulative effects on shell δ18O, which will become more positive during El Niño and more negative during La Niña phases. The comparison of the ENSO index with the T. gigas and Porites δ18O records shows that each El Niño event is recorded in the shell and coral profile by isotopic shifts of around 1.0 to 1.2‰ toward more positive values (Fig. 2) reflecting the combined influence of lower temperatures and decreased rainfall. During the El Niño phase of the Southern Oscillation, the region experiences relative drought and slightly reduced SSTs (~-0.2 to -0.5°C anomaly, see Fig. 2). These factors combine to drive skeletal δ18O to heavy values, with SST explaining about 30-50% of the skeletal δ18O range.
Take away message
We show that shells of T. gigas can be used to produce multi-decadal climatic records, hence providing a valuable resource for investigating changes to the frequency and strength of ENSO events in the past. The excellent reproducibility of clam and coral δ18O profiles illustrates the strength of using these archives to reconstruct large-scale hydrographic changes.
affiliations
1Laboratoire de Planetologie et Geodynamique, Université de Nantes, France; mary.elliotuniv-nantes.fr
2School of Earth Science, University of Queensland, St. Lucia, Australia
3School of GeoSciences, University of Edinburgh, UK
references
Elliot M et al. (2009) Palaeogeography, Palaeoclimatology, Palaeoecology 280: 132-142
Sano Y et al. (2012) Nature Communications 3: 761, doi:10.1038/ncomms1763
Tudhope AW et al. (2001) Science 291: 1511-1517
Welsh K et al. (2011) Earth and Planetary Science Letters 307: 266-270
Matthieu Carré1, S. Purca2 and J.P. Sachs3
Shells of mollusks from offshore Peru were analyzed to reconstruct variability of the seasonal cycle and ENSO. The data provide insights into past changes in ENSO-related interannual variability in the Eastern Tropical Pacific and in the spatial structure of ENSO.
The focus of much paleoclimate work on ENSO has been on records spanning multiple decades, such as those derived from corals. Such long records are, however, relatively rare, especially in the Eastern Tropical Pacific. This important limitation for studying past changes in the spatial pattern of ENSO activity can be compensated for by obtaining records from a larger number of shorter-lived organisms. In this case, information about past climate is not available as a continuous record, but is compiled to extract climate statistics.
Carré et al. (2013) recently presented a technique that responds to the critical need for quantitative estimates of tropical marine interannual variability. This technique uses the shells of marine mollusks that live for 1-4 years, and thus allow us to reconstruct the seasonal range of sea surface temperature (SST). These data can then be compared to coral records and GCM outputs. The technique of using marine mollusk shells shares similarities with the approach of coral studies in that it produces floating windows of climate record at a very high, often monthly, resolution. It also shares similarities with the approach of analyzing many foraminifera shells individually from the same sediment layer (Koutavas et al. 2006; Leduc et al. 2009) in that paleoclimate statistics are estimated from a random sample. Isotopic records in mollusks enable independent reconstructions of the seasonal cycle. This approach is valid for any coastal mollusk species that faithfully records at least one annual SST cycle, and therefore opens up new opportunities for direct, quantitative paleo-ENSO reconstructions in the Eastern Tropical Pacific, using either archeological shell middens or uplifted fossil shell banks from Peru.
ENSO characterization in the Niño1+2 region
 |
|
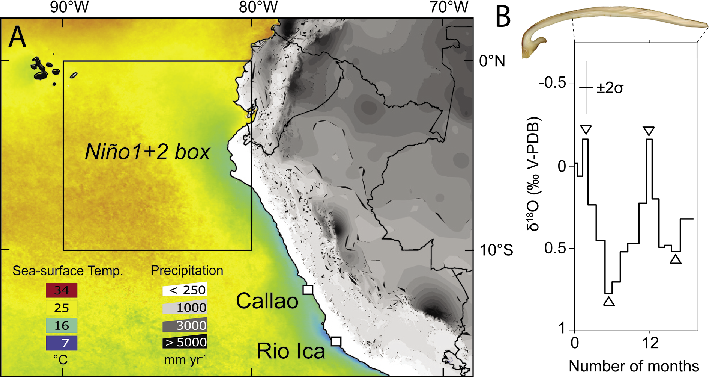
Figure 1: (A) Annual mean SST and precipitation for the 1950-2010 period. Location of the Niño1+2 region in the Eastern Tropical Pacific and the Peruvian localities mentioned. (B) Polished section of a M. donacium shell, and the associated δ18O plotted on a time scale. The shell was continuously sampled so that every data point integrates about one month. The chronology was determined using shell growth lines. Triangles indicate seasonal extrema used for the calculation of seasonal amplitudes ΔT. |
SST variability on the Peruvian coast is largely dominated by ENSO-related interannual variability. The amplitude of the annual cycle (ΔT) on the coast is also clearly related to the Niño1+2 index, with larger amplitudes during El Niño and smaller ones during La Niña. As a result, the variance of the annual cycle amplitude, Var(ΔT), on the Peruvian coast over any period of time is an indicator of ENSO variance generally in the Niño1+2 region (Fig. 1a).
 |
|
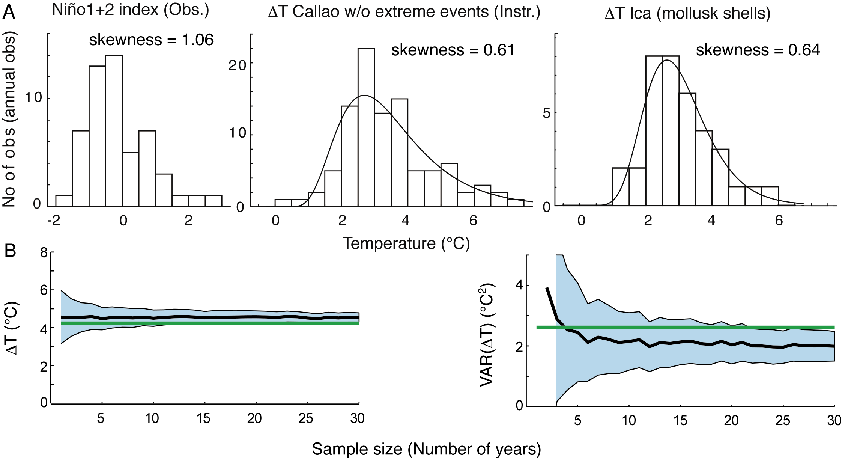
Figure 2: (A) Distributions of annual Niño1+2 index from 1950 to 2002, seasonal ΔT values in Callao, Peru from 1950 to 2002 excluding extreme El Niño events in 1982-83 and 1997-98, and ΔT values calculated from a modern sample of M. donacium shells from Ica, Peru. (B) Results of Monte Carlo simulations undertaken to estimate the uncertainties of mollusk-derived paleoclimate reconstructions. Plots show the true value (green), the ensemble average value (black line), and the standard error (blue area) vs. the sample size, for the reconstruction of the mean and variance of ΔT. |
Oxygen stable isotopes (δ18O) in marine shells from central and southern Peru primarily reflect SST variability since seawater δ18O is not significantly affected by freshwater input and evaporation (Carré et al. 2013). Mesodesma donacium shells grow continuously throughout the year and record the full annual cycle of coastal SST in Peru over a window of 1 to 4 years at a monthly resolution (Fig. 1b). Modern shells (n=13) collected during the late 20th century provide a random sample cumulatively providing about 25 years of statistics that faithfully reproduces the skewed distribution of ENSO anomalies of this period in Callao, Peru and in the Niño1+2 region (Fig. 2a). It should be noted that the extreme warm events of 1982-83 and 1997-98 are not recorded in the data as the exceptionally warm conditions induced mass mortality in the mollusks. However, such events are so extraordinary even at the millennial scale (Rein 2007) that they are arguably not representative of ENSO (Takahashi et al. 2011). The mollusk shells are complementary to rainfall-related archives as they are sensitive to variability in the marine manifestation of ENSO while rainfall-related archives are more sensitive to occasional catastrophic events induced by the atmospheric anomalies of extreme ENSO events (Rein 2007).
Estimating the reconstruction uncertainties
Estimating reconstruction uncertainties is a necessary challenge in paleoclimate studies if meaningful comparisons with GCM simulations are to be made. To estimate the reconstruction error, we used an in situ instrumental time series and simulated the reconstruction process (forward proxy model). This was done by randomly extracting short time samples and adding different types of noise to them representing uncertainty sources (such as analytical error, random growth breaks, or temperature tolerance). Iterating this process thousands of times provides an estimate of systematic biases (the mean value of the error population) and of the standard error (the standard deviation of the error population) (Fig. 2b). This shell sample yields thus an estimate of mean annual temperature with a precision of ±0.4°C, of ENSO variance with a precision of ±30%, and of ENSO skewness with a precision of ±0.3. This procedure can also be used to evaluate the relative contributions of error sources, and improve our understanding of the proxy (Carré et al. 2012). This sample will be used as a modern reference to normalize past reconstructions, minimize systematic biases due to the archive or to local effects, and allow meaningful comparisons with coral records and climate simulations.
Discriminating Central from Eastern Pacific modes in the past
Capotondi et al. (2013, this issue) present some recent developments in our understanding of ENSO diversity. Two types of El Niño events, Central Pacific events and Eastern Pacific events, have been defined by the location of the maximum SST anomaly (Ashok et al. 2007). Because of their significantly different impacts, the question of the evolution of ENSO in both the past and future, should now also address the variable contribution of Central Pacific and Eastern Pacific ENSO events. In the Niño1+2 region, in the far Eastern Pacific, Eastern Pacific and Central Pacific modes can be distinguished by the shape of their SST distributions. The Eastern Pacific mode is characterized by positively skewed SST distributions while the Central Pacific mode produces a symmetric distribution.
Such a change in ENSO asymmetry has been noted since the 1990s (Yeh et al. 2009; Boucharel et al. 2011; Dewitte et al. 2012). La Niña cold events generate negatively skewed SSTs in the Niño1+2 region. The ENSO anomaly distribution obtained from the modern Peruvian shell sample faithfully reproduces the positive skewness of the late 20th century ENSO, even without recording the most extreme ENSO events (Fig. 2a). Fossil mollusk shell samples from Peru could therefore potentially be used to track past changes in the frequency of Eastern Pacific and Central Pacific events, and provide novel insights into the relationships between ENSO modes and the mean climate.
affiliations
1UM2-CNRS-IRD, Institut des Sciences de l'Evolution de Montpellier, France; matthieu.carreuniv-montp2.fr
2Instituto del Mar del Peru, Callao, Peru
3School of Oceanography, University of Washington, Seattle, USA
selected references
Full reference list online under: pastglobalchanges.org/products/newsletters/ref2013_2.pdf
Carré M et al. (2013) Palaeogeography, Palaeoclimatology, Palaeoecology 371: 45-53
Carré M, Sachs JP, Wallace JM, Favier C (2012) Climate of the Past 8: 433-450