PAGES Magazine articles
Keiji Takemura
Institute for Geothermal Sciences, Kyoto University, Beppu, Japan; takemura bep.vgs.kyoto-u.ac.jp
Sediments from Lake Biwa in central Japan preserve the paleoclimatic and tectonic history of the past 1 Ma of East Asia. In particular the uppermost massive clays are well suited to study high-resolution environmental change of the last 430 ka.
Lake sediments are important archives for understanding the environmental and tectonic history at regional to global scales. Located on the convergent margin of the Eurasian plate, the Japanese archipelago features many tectonic, volcanic, and coastal lakes well suited for paleolimnological studies. One of the most famous and most studied lakes in Japan is Lake Biwa. The first sediment core was retrieved in 1965 by Professor Shoji Horie and his team to study global climatic change and tectonic history of this convergent region. Since then, many more studies have been conducted on Lake Biwa. Here, I summarize the drilling history of Lake Biwa and put it in a broader perspective.
_LvG_opt.png) |
|
Figure 1: Map showing locations of principal coring sites in Lake Biwa (from Takemura et al. 2010). BB (200 m drilling in 1971; Horie 1984), B1400 (1400 m drilling in 1982-1983; Takemura 1990; Horie 1991), BT (141 m drilling in 1986; Yoshikawa and Inouchi 1991), Site 1, 2, 3 (BIW95; Piston cores in 1995; Takemura et al. 2000), BIW07-1 to BIW07-6 (Piston cores in 2007; Takemura et al. 2010), BIW08-A and BIW08-B (Drilled cores in 2008; Takemura et al. 2010). |
Southwestern Japan has been impacted by tectonic deformation throughout the Quaternary. The ca. 1.5 Ma old tectonic lake Lake Biwa (82 m a.s.l.) on south-central Honshu Island is the largest freshwater lake in Japan, measuring 22.6 km wide by 68 km long (Fig. 1). Lake Biwa is divided into two basins. The Northern Lake is a deep basin with a maximal depth of 104 m and average depth of 40 m. The much smaller Southern Lake is very shallow with an average depth of about 3 m.
Several attempts to recover core sediments from Lake Biwa have been made, mainly in the 65-70 m deep depression situated in the southern part of the northern Basin (Fig. 1). Horie et al. first recovered a six-meter long sediment core in 1965 and then an 11.5 m long piston core in 1967 (Horie et al. 1971). In 1971, with considerable effort, they managed to drill the sediments in the same depression (Fig. 1) and successfully obtained core samples totaling about 200 m (Horie 1984). Finally, in 1982 and 1983, they succeeded in recovering a 1400 m long core covering the entire sediment sequence. This record confirmed that the basin is filled with lacustrine and fluvial sediments about 800 m thick (Takemura and Yokoyama 1989; Horie 1991). Below 800 m the core is mainly composed of a ca. 100 m thick pebbles and cobbles layer, and Mesozoic-Paleozoic basement rocks. The uppermost unit consists of lacustrine clay and silt about 250 m thick, estimated to have deposited continuously during the last 430 ka (Takemura 1990; Meyers et al. 1993). In 1986, further samples of 141 m thick sediment were recovered about 5 km northeast of the older drilling sites (Fig. 1; Yoshikawa and Inouchi 1991).
Whereas the neighboring (ca. 20 km) basin of Lake Suigetsu has varved sediments of the past 150 ka, Lake Biwa has continuous sediments of a million years age. Therefore, together the two lake basin records will permit understanding the Quaternary climate and tectonics at annual to millennial time scales.
_LvG_opt.png) |
|
Figure 2: Summary of chronology of core B1400 based on the re-investigation of fission track ages, tephra identification and magnetostratigraphy (Danhara et al. 2010). Tephra horizons (gray): K-Ah, U-Oki, AT, Aso-4, K-Tz,Ata, At-Th, Aso-1, Tky-Ng1, Kkt, Imakuma II, Ss-Pink; Paleomagnetic information (red): B/M (Brunhes/Matuyama) boundary, top of Jaramillo event, bottom of Jaramillo event, Cobb mountain event. |
Initially, the scientific value of Lake Biwa sediments was not properly acknowledged because the first attempt of fission track dating gave a wrong Pliocene age to the basal part. This resulted in a significantly crooked sediment accumulation rate (SAR) curve, casting doubt on the continuity of the Lake Biwa sediment record. In 1993, based on a stratigraphic correlation of the Biwa core with marine data, Meyers et al. suggested that the fission track dates were erroneous. Then in 2005, improvements on the fission track timescale successfully identified the paleomagnetic reversal near the base as Jaramillo rather than Olduvai, estimating the time coverage of the Lake Biwa core as ca. 1.5 Ma (Danhara et al. 2010; Fig. 2). A highly linear SAR resulted for the 800 m deep Lake Biwa sediment record. This was evidence for the stable sedimentary environment of the basin, and the suitability of Lake Biwa as a paleoclimate archive. Moreover, progress in Japanese tephrochronology in recent decades enabled the identification of several marker tephras (Machida and Arai 2003) in and around the basin. Lake Biwa is, therefore, an ideal terrestrial site to explore paleoclimate and tectonic history during the past 1 Ma of East Asia.
Although the sediments of Lake Biwa have been analyzed by various methods, high-resolution studies have not yet been carried out. In most studies a single core was obtained at a single site. It was therefore difficult to evaluate the completeness of core recovery and disturbance of core samples. For example, we now know that in the deep drilling of 1982 and 1983, rotary coring caused disturbance of the upper sediment samples. For a detailed study of the sedimentary record, in 1995, we recovered seven piston cores (10-15 m long) at three localities (site 1, 2, 3) in the northern part of Lake Biwa (Fig. 1). We designed the coring plan (1) to take at least two cores from each site; (2) to take cores at three locations with different sedimentation rates; and (3) to recover the longest possible undisturbed sediment sequence. Analyses of the core samples include paleomagnetism, environmental magnetism, physical properties, organic and inorganic chemistry, pollen analysis and 14C dating. We also demonstrated that magnetic susceptibility data are very useful to find microscopic tephra horizons, and establish correlation and age assignment of the core sediments from the different locations.
From the viewpoint of paleoclimatic change, Nakagawa et al. (2008) produced quantitative climatic reconstructions for the past 450 ka based on a long pollen record from Lake Biwa. Hayashi et al. (2010) reported a high-resolution pollen record covering the last 40 ka (BIW95-4) and found that they correlate with Dansgaard–Oeschger (D–O) cycles recognized from the anhysteretic remanent magnetization (ARM) record (Hayashida et al. 2007).
Drilling challenges are continuing for high-resolution studies on paleoenvironments and island arc tectonics. In 2007 and 2008, we obtained six new piston cores covering at least 50 ka, two longer cores covering 300 ka (Takemura et al. 2010), and 300 km long shallow seismic surveys. Various interdisciplinary analyses are expected to generate high-resolution records of the environmental change of the Asian monsoon and of the dynamics of the tectonic convergence.
Selected references
Full reference list online under: http://pastglobalchanges.org/products/newsletters/ref2012_2.pdf
Horie S (1984) Lake Biwa. Dr. W. Junk Publishers, 654 pp
Meyers PA, Takemura K, Horie S (1993) Quaternary Research 39: 154-162
Nakagawa T et al. (2008) Geology 36: 491-494
Takemura K (1990) Paleogeography, Paleoclimatology, Paleoecology 78: 185-193
Takeshi Nakagawa1 and Suigetsu 2006 Project Members2
1School of Geography, Politics and Sociology, Newcastle University, Newcastle upon Tyne, UK; takeshi.nakagawanewcastle.ac.uk
2www.suigetsu.org
Two decades of effort by three generations of researchers has contributed to the realization of the value of Lake Suigetsu's varved sediments to Quaternary science.
_opt.png) |
|
Figure 1: Varved sediments of Lake Suigetsu, Honshu Island, Japan. The curve shows relative gray scale values as measured on the displayed image. |
_LvG_opt.png) |
|
Figure 2: Photographic litho-stratigraphy of the SG06 core (modified after Nakagawa et al. 2012). Red shades show disturbed sediment sections. The coring team consisted of people from Newcastle University (UK), University of Tokyo, Osaka City University, Chiba University of Commerce, Naruto University of Education, Kyoto University (Japan), GeoForschungsZentrum Potsdam (Germany), and Royal Holloway University of London (UK). |
Lake Suigetsu has a long history in Quaternary research. In 1991, a group of Japanese researchers, led by Prof. Yoshinori Yasuda of the International Research Center for Japanese Studies (IRCJS, Japan), recovered a couple of >10 m long piston cores from the lake and found that the lower parts of those cores were annually laminated (varved; Fig. 1). This marked the initiation of varve studies in Japan.
Two years later (1993), the same group conducted deep drilling of Lake Suigetsu and recovered a >73 m long sediment core that reached bedrock. The top ca. 40 m of the core was quasi-continuously varved. The earliest important scientific outcomes from this long core (SG93) were delivered by Hiroyuki Kitagawa of IRCJS and Hans van der Plicht of Groningen University (the Netherlands). They extended terrestrial radiocarbon calibration close to the limit of the method (ca. 50 ka) by combining varve counting and >300 radiocarbon measurements obtained on terrestrial leaf fossils extracted from the core (Kitagawa and van der Plicht 1998a, 1998b, 2000). Since then the lake has acquired international recognition as an environmental archive of high value (it is sometimes even referred to as “The Japanese Lake”) - especially by the radiocarbon community.
The internationally ratified IntCal radiocarbon calibration model for deriving calendar ages from radiocarbon data was first proposed in 1998 (Stuiver et al. 1998) and subsequently updated in 2004 and 2009 (Reimer et al. 2004, 2009). Ideally, radiocarbon calibration should be based on independently-dated terrestrial materials such as tree rings and terrestrial plant remains in lacustrine sediments (speleothem records, although terrestrial, require correction for unknown dead carbon fractions). However, the present IntCal model relies on marine archives, such as corals and Cariaco Basin sediments for the period beyond the continuous tree-ring record. Even in the latest version, the tree-ring record reaches only back to 12,550 cal. BP. This still leaves three quarters of the radiocarbon calibration based on marine data, including the assumption of a constant offset from the atmospheric radiocarbon concentration, known as the marine reservoir age. As a terrestrial archive, the Lake Suigetsu radiocarbon data are free from the marine reservoir age problem. However, the dataset has never become an integral part of IntCal, mainly because of a significant deviation of the Suigetsu 14C data from the marine-based records, which cast doubt on the SG93 varve chronology.
Early outputs from the SG93 core also included reconstruction and dating of paleoclimatic events. Based on the varve chronology and pollen analysis of >400 samples from the late glacial part of the core (ca. 16-10 ka), Nakagawa et al. (2003, 2005) argued that the late glacial climate in Japan exhibited similar millennial-scale oscillations to the North Atlantic but with centennial-scale offsets in timing. However, this was not widely accepted by the community, partly because of the issues with the SG93 varve chronology, and also because it was not in good agreement with East Asian speleothem records that were precisely U-Th dated (Wang et al. 2001; Shen et al. 2010).
More recently, Staff et al. (2010) re-analyzed the SG93 radiocarbon dataset by Bayesian statistical modeling techniques (Bronk Ramsey 2008, 2009) using IntCal09 as the matching target. This revealed that the gaps between core segments of SG93 were larger than initially supposed, and that the estimated gaps were roughly sufficient to account for the departure of the SG93 radiocarbon data from marine curves. In other words, it convincingly demonstrated that (i) the SG93 varve chronology was generally too young, and (ii) the main source of error was the discontinuity of the core rather than varve counting inaccuracy. This meant that the potential scientific value of the Lake Suigetsu varved sediment remained very high, if sampled in the form of continuous sediment cores.
Suigetsu returns!
Phase Two of the Lake Suigetsu study began in 2006, when funding was secured from the Natural Environment Research Council (NERC), UK to re-core the lake. An international team, consisting of researchers from the UK, Japan, and Germany, recovered a new master core (SG06) in summer 2006 from four parallel bore holes with sufficient overlap to provide a 100% continuous, 73.2 m long sediment profile covering the past ca. 150 ka (Nakagawa et al. 2012; Fig. 2). Building on the success of the SG06 coring, a further extended research group obtained additional funding from NERC and the German Research Foundation, along with other internal support from UK and Japanese institutions to analyze the core in detail.
Varve counting is the crucial part of the whole project. We therefore employed both conventional counting by thin-section microscopy, and ultra-high resolution scanning (60 µm stepping) using an ItraxTM X-radiograph and XRF scanner (Marshall et al. 2012; Francus et al. 2009). The two parallel counting results were merged into a single age-depth model using newly developed statistical methods (Schlolaut et al. 2012; Marshall et al. 2012). The merged varve chronology of the SG06 core has already been established down to ca. 30 ka. Soon, it will be extended beyond the radiocarbon limit (>50 ka).
More than 600 radiocarbon measurements were made on terrestrial tree leaf fossils, manually extracted from SG06. The distribution of the radiocarbon dates shows good agreement with the terrestrial part of the IntCal09 model (0-12,550 cal. BP) supporting the continuity of the sediment and the accuracy of the merged varve chronology (Staff et al. 2011; Marshall et al. in press).
A notable tephra horizon (the ‘SG06-1288’, or ‘U-Oki’ tephra) provides an important marker layer in the early Holocene part of the SG06 core, which has been precisely dated by numerous radiocarbon dates and Bayesian wiggle matching to the terrestrial part of the IntCal09 calibration model (Staff et al. 2011; Bronk Ramsey 2009). Recently we conducted Ar/Ar dating of 34 sanidine crystals extracted from the proximal deposits of this tephra, and attained excellent Ar/Ar age determination with errors < 3%, in spite of operating close to the younger limit of the Ar/Ar technique (Smith et al. 2011). This suggests that we will be able to apply the same method for the deeper part of the core, reduce the cumulative counting error of the SG06 varve chronology, and significantly improve the accuracy of the terrestrial radiocarbon calibration dataset beyond the tree ring limit.
The Lake Suigetsu 2006 project has also yielded a range of paleoclimatological data that are almost ready to be published. Most of them are still waiting for the independent chronology to be finalized. However, Kossler et al. (2011) have already reported decadal to sub-decadal scale sequential changes in diatom flora, sedimentary structure and local vegetation during the Lateglacial transitions. Papers on event timings based on high-resolution pollen, biomarker, and XRF results will follow shortly.
Summary
Our new Lake Suigetsu project aims to (i) provide a key dataset for more reliable terrestrial radiocarbon calibration over the whole range of the method, and (ii) provide a reference record for the East Asian Monsoon region. After two decades of effort by three generations of researchers to pave the runway, research on the Lake Suigetsu varved sediment record is now finally taking off.
Selected references
Full reference list online under: http://pastglobalchanges.org/products/newsletters/ref2012_2.pdf
Kitagawa H, van der Plicht J (1998a) Science 279: 1187-1190
Nakagawa T et al. (2012) Quaternary Science Reviews 36: 164-176
Reimer PJ et al. (2009) Radiocarbon 51: 1111-1150
Smith VC et al. (2011) Quaternary Science Reviews 30: 2845-2850
Masaki Sano, C. Xu and T. Nakatsuka
Graduate School of Environmental Studies, Nagoya University, Japan; sano.masakib.mbox.nagoya-u.ac.jp
Tree-ring records reveal that climatic sensitivity of cellulose δ18O can be higher than that of ring width, that summer monsoon in the Himalayas has weakened over the last two centuries, and that El Niño-Southern Oscillation significantly affects the hydroclimate of Southeast Asia.
The impact of hydrologic regime shifts in the Asian Monsoon under changing global climate is significant, since the intensity of monsoon directly affects the agricultural production of the most densely populated regions in the world. Proxy climate records dating back to the pre-instrumental era are therefore essential for evaluating the roles of natural variability and anthropogenic impact on the Asian Monsoon system. Tree rings have often been used to reconstruct past climate variations with annual resolution, and extensive networks of tree-ring chronologies have been developed in North America and Europe. Unlike in higher latitudes, relatively few tree-ring chronologies were produced for tropical and subtropical Asia, since the lack of climatic seasonality hinders annual ring formation of most tree species in these regions. However, over the last couple of decades dendrochronologists have found increasing success in the low latitudes of Asia by selecting regions with more pronounced temperature or precipitation seasonality.
Tree-ring δ18O as a hydrologic proxy
A major recent advance has been the hydroclimatic reconstructions from rare and long-lived Fujian Cypress (Fokienia hodginsii) growing in Vietnam (Buckley et al. 2010; Sano et al. 2009). These records based on ring width measurement revealed that the region experienced decadal-scale droughts in the past, which have no analog in the instrumental period. Interestingly, these exceptional droughts coincided with periods of social unrest (Buckley et al. 2010). In addition to this progress, other recent studies indicated that oxygen isotope ratios of tree-ring cellulose might help improve our understanding of monsoon activity (Sano et al. 2012a,b ; Xu et al. 2011). In this brief note, we show some advantages of using tree-ring δ18O rather than ring width and wood density traditionally utilized in dendroclimatolgy.
It is well known that tree-ring width and wood density are controlled not only by climate but also by endogenous disturbance pulses, such as competition with neighboring trees. To reduce such disturbances, climatically sensitive trees are sampled predominantly at the species ecological boundaries, such as near arid or cold forest limits. This spatial limitation can be overcome by using oxygen isotope ratios, since the isotopic ratio in the wood is not significantly affected by ecophysiological processes. Tree-ring δ18O is theoretically controlled by two climatic factors, δ18O of the source water and relative humidity (e.g. Robertson et al. 2001; Saurer et al. 1997), both of which are closely related to monsoon activity in South and Southeast Asia. Our preliminary analyses using samples from the Himalayas (Sano et al. 2010) and Laos (Xu et al. 2011) clearly show that tree-ring δ18O is more strongly correlated with precipitation, relative humidity, temperature and Palmer Drought Severity Index (PDSI) than is ring width or wood density. PDSI is a drought metric based upon a water balance model. Positive and negative values of the PDSI correspond respectively to wet and dry conditions (Palmer 1965; Dai et al. 2004).
Evidence of weakening monsoon over the Himalayas and Tibet for the last two centuries
_LvG_opt.png) |
|
Figure 1: Reconstructed June-September PDSI from tree-ring δ18O in the Nepal Himalayas. The thick curve represents a 30-year cubic spline. Figure modified from Sano et al. (2012a). |
Tree-ring δ18O from the Nepal Himalayas accounts for 34% of the inter-annual variability of the PDSI in the monsoon season (July–September), and clearly shows a decreasing trend of precipitation/moisture over the last two centuries (Fig. 1). Evidence for a decrease in summer monsoon rainfall was also found in δ18O of tree rings from Tibet (Grießinger et al. 2011), δD of an ice core from Mt. Everest (Kaspari et al. 2007), snow accumulation of an ice core from Dasuopu, Tibet (Zhao and Moore 2006), and varve thickness of lake sediments in Tibet (Chu et al. 2011). The overall trends toward arid conditions indicate that summer monsoon has weakened across wide areas of the Himalayas and Tibet for at least the last couple of centuries.
Our reconstructed PDSI shows significant correlations with sea surface temperatures in the tropical Pacific and Indian Ocean, suggesting that the tropical oceans play a role in modulating hydroclimate in the Nepal Himalayas. A simulation model forced by observed sea surface temperature (SST) data reveals that a weakening trend of monsoon precipitation found in northern India and the eastern Tibetan Plateau over the latter half of the 20th century is deducible from the atmosphere’s response to an increase in SSTs over the tropical Pacific and Indian Ocean (Zhou et al. 2008). Therefore, the consistent warming found in reconstruction of tropical SSTs over the last two centuries (Wilson et al. 2006) might be responsible for the weakening monsoon in the Himalayas. In contrast, other proxy records from lower altitudes indicate a strengthening of the monsoon winds (Anderson et al. 2002) and precipitation (Wang et al. 2005). The increased north–south difference of monsoon activity is likely induced by a southward shift in the overall position of the monsoon trough.
Links between ENSO and tree-ring δ18O records from Southeast Asia
_LvG_opt.png) |
|
Figure 2: Comparison of inter-annual variations in tree-ring δ18O from Laos and the Multivariate ENSO index (MEI) for the period of 1951-2002. Figure modified from Xu et al. (2011). |
In contrast to ring-width-based reconstructions from the Himalayas and Tibet, those from Southeast Asia are rare, since most trees grow in relatively warm and wet environments. To overcome this limitation, isotopic analyses have been conducted on samples from four cypress trees from Laos for the past 52 years (1951-2002). It turned out that contrary to the tree-ring widths data (Xu et al. 2011), the δ18O time series of the trees are significantly correlated with each other. Also, the δ18O chronology built from the four trees shows significant correlation with temperature (r = 0.64, p < 0.001), precipitation (r = –0.34, p < 0.05) and PDSI (r = –0.66, p < 0.001) in the monsoon season. In contrast, no significant correlation was found between any climatic variables and a ring-width chronology based on 15 trees, which includes the four trees utilized for the isotope measurement. Finally, the δ18O chronology is strongly correlated with ENSO-related indices, particularly with the Multivariate ENSO Index (MEI; Wolter and Timlin 2011) for the last 52 years (Fig. 2). To further explore the potential of isotope dendroclimatology, six more cypress trees from Vietnam have been subjected to δ18O analyses. Surprisingly, the δ18O chronology from Vietnam is closely correlated to that from Laos (Sano et al. 2012b), even though these sampling sites are around 150 km away from each other. Moreover, the teleconnected relationships between the δ18O chronology and ENSO-related indices are stable over the 135-year period of available instrumental data.
Over the last decade, considerable effort has been devoted to reconstruct ENSO variability using tree rings and other proxy records that originate mainly from North America and the topical Pacific (e.g. D'Arrigo et al. 2005; Mann et al. 2000; Wilson et al. 2010). Although these records agree well during the twentieth century, there is relatively little agreement before this time. Wilson et al. (2010) point out that the teleconnected relationship between the tropical central/eastern Pacific and regions where proxy records are located does not seem to be stable. Since none of the previously published reconstructions of ENSO variability include data from mainland Southeast Asia, tree-ring δ18O is of great use to independently reconstruct ENSO, and to explore the spatial influence of ENSO before the instrumental period.
Selected references
Full reference list online under: http://pastglobalchanges.org/products/newsletters/ref2012_2.pdf
Buckley BM et al. (2010) PNAS 107: 6748-6752
Sano M, Ramesh R, Sheshshayee MS, Sukumar R (2012a) The Holocene 22(7): 809-817
Sano M, Xu C and Nakatsuka T (2012b) Journal of Geophysical Research 117, doi: 10.1029/2012JD017749
Wilson R et al. (2010) Journal of Quaternary Science 25(1): 62-78
Xu C, Sano M, Nakatsuka T (2011) Journal of Geophysical Research 116, doi: 10.1029/2011JD016694
Yumiko Watanabe1, T. Tagami1, S. Ohsawa2, K. Takemura2 and S. Yoden1
1Division of Earth and Planetary Sciences, Graduate School of Science, Kyoto University, Japan; yumikokueps.kyoto-u.ac.jp
2Institute for Geothermal Sciences, Graduate School of Science, Kyoto University, Japan
Oxygen and carbon isotopic data from an Indonesian stalagmite help improve our understanding of past rainfall variation in the tropics.
Stalagmites as paleoclimate archives
_opt.png) |
|
Figure 1: The formation process of stalagmites. |
Stable isotopic records of stalagmites are a powerful tool to reconstruct past climate change because stalagmites yield continuous terrestrial paleoclimate records and can be dated accurately by the U-Th dating method (e.g. McDermott et al. 2004; Fairchild et al. 2006). Figure 1 shows the formation process of stalagmites. In the soil and upper epikarst, water is enriched with pCO2 derived from plant respiration and organic matter decay (Fairchild et al. 2006). During its percolation in the carbonate bedrock, water dissolves carbonate components and eventually reaches supersaturation. When the water emerges into a cave as dripwater, carbon dioxide is degassed into cave air and calcium carbonate precipitates, forming a speleothem. Under the formation process described above, stalagmites record fluctuations of rainfall and/or temperature on the land surface as variation in their δ18O and δ13C composition.
Previous studies on stalagmites in Asia
_LvG_opt.png) 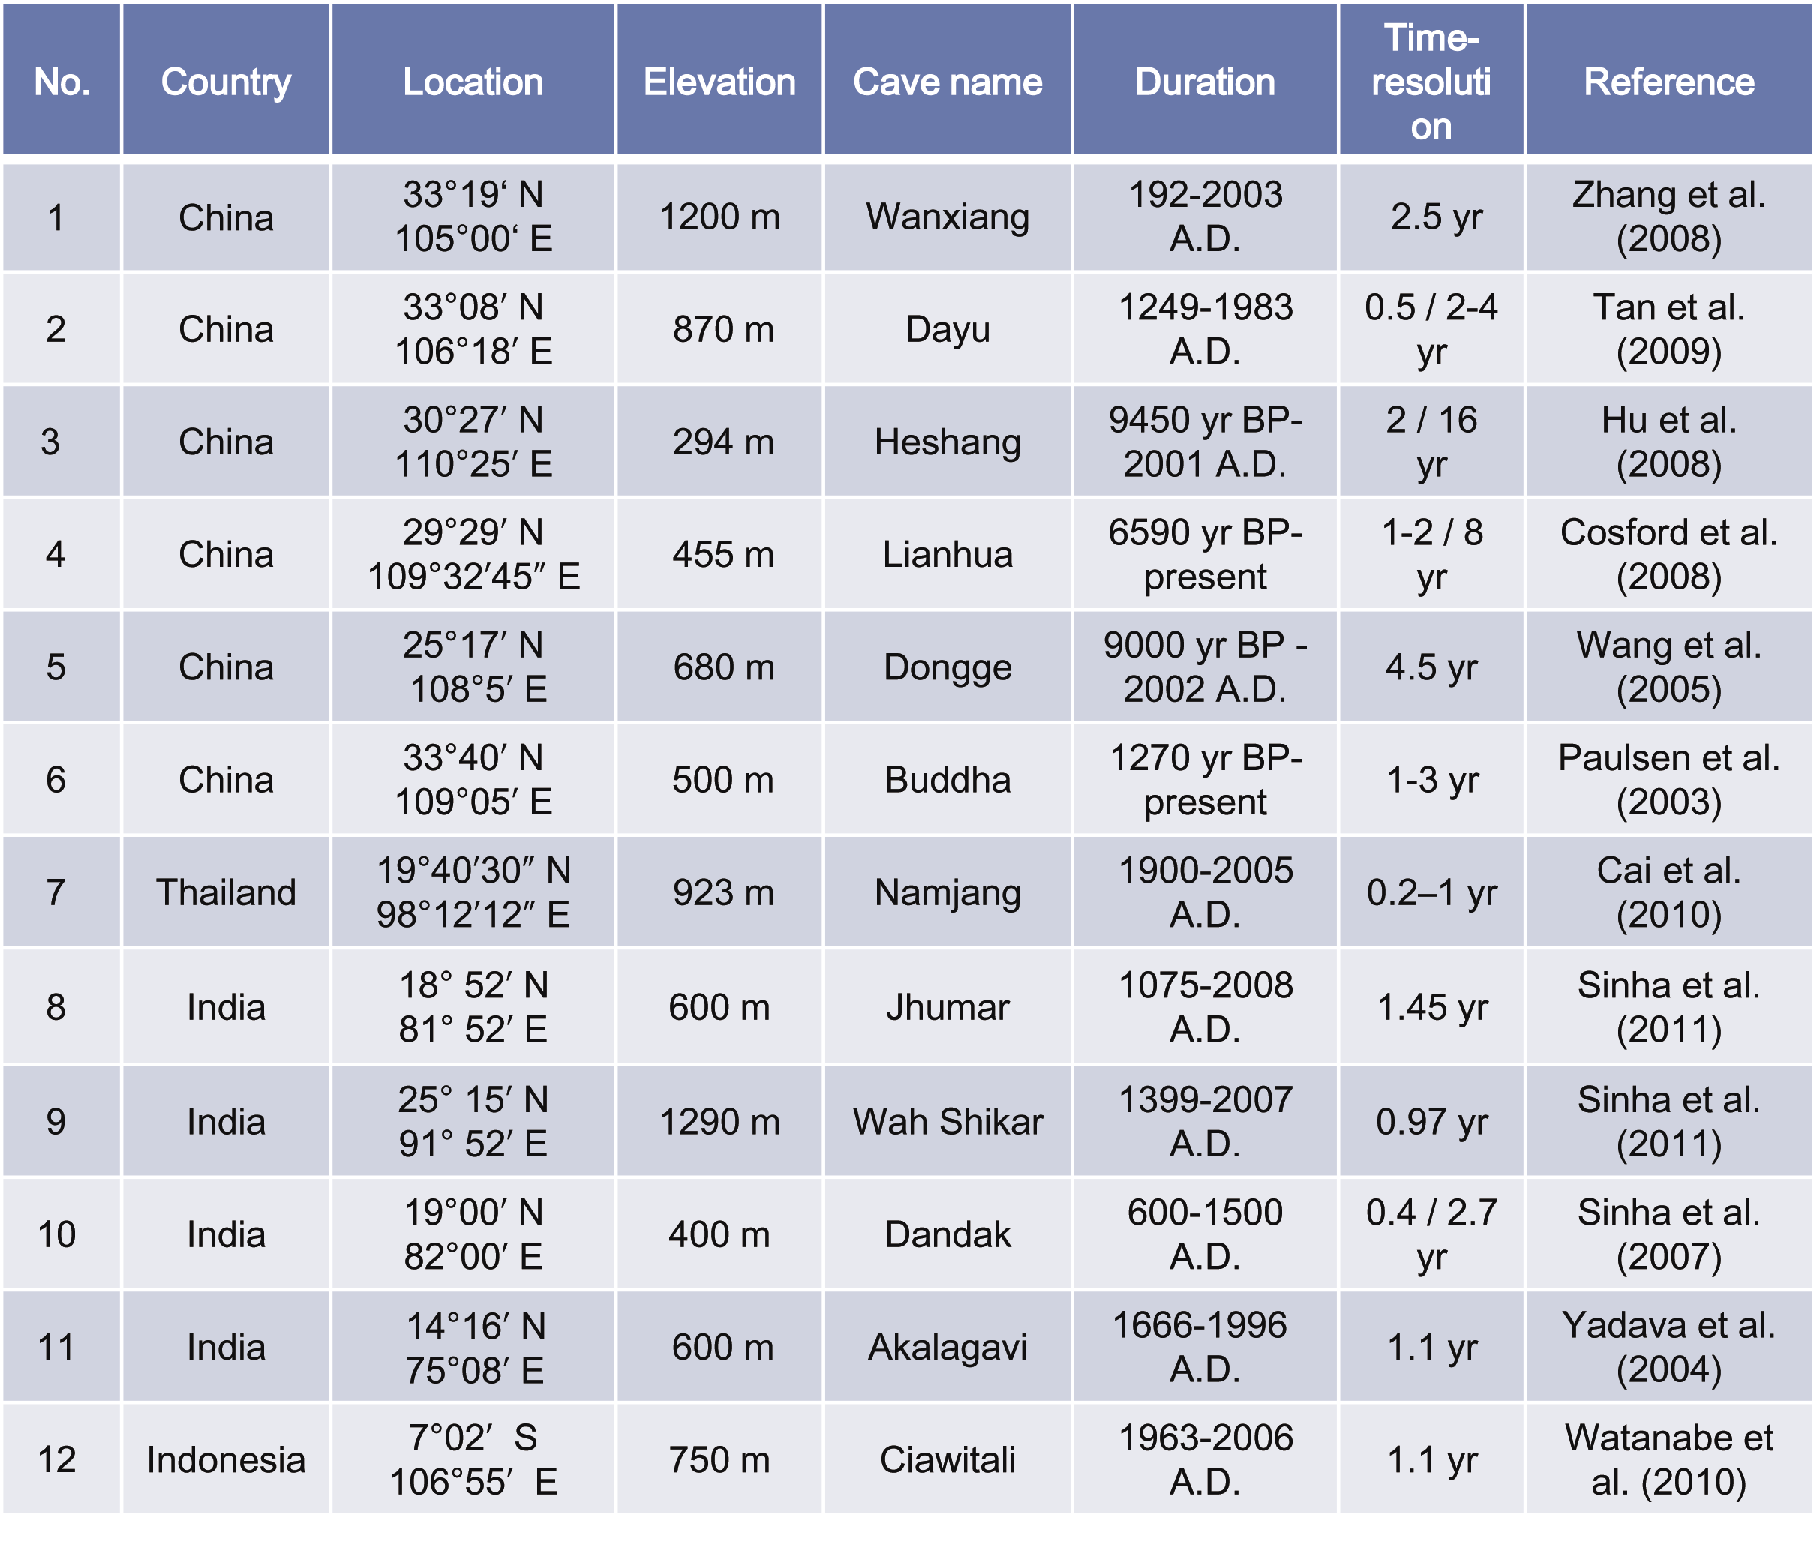 |
|
Figure 2: Study sites of Asian stalagmites used to reconstruct rainfall variations over the last 2000 years. The red star shows the location of the Ciawitali Cave on West Java, Indonesia. |
There are numerous studies based on δ18O and δ13C analyses of stalagmite investigating terrestrial climate changes on Milankovitch and millennial timescales (e.g. McDermott et al. 2001; Wang et al. 2001, 2008). In recent years, some stalagmite studies also focused on shorter timescales. Figure 2 shows stalagmite study sites in Asia targeting reconstructions of rainfall variation during the last 2000 years. Stalagmites collected in China, India and Thailand yield oxygen isotopic variations on subdecadal to subannual timescales (Zhang et al. 2008; Tan et al. 2009; Sinha et al. 2007, 2011; Cai et al. 2010). In these studies, oxygen isotopic variations in the stalagmites were generally interpreted as representing variability in monsoonal rainfall intensity, although the exact interpretation on the climatic causes for isotopic variations in precipitation were different at each study site (e.g. amount effect vs. source effect). While these studies provided important insight in the precipitation regime of southern and eastern Asia, little attention has been paid to the southeastern Asian tropical regions.
Our stalagmite study in Indonesia
The high insolation in the tropics is the driving force of poleward heat transport, and tropical climate anomalies, such as El Niño and La Niña events, also affect the rest of the world through teleconnection. Thus the tropics are a critical region to study the global climate system. However, instrumental meteorological data are very limited compared to Europe and eastern North America (Parker et al. 2000) and need to be supplemented by proxy records. In our study, we performed a systematic comparison between variations in precipitation amount and δ18O and δ13C measurements of an Indonesian stalagmite to reconstruct rainfall variability over the last 500 years.
First, we analyzed a stalagmite collected in the Ciawitali Cave in western Java and compared its δ18O and δ13C records with available instrumental rainfall records back to the 1950s. Negative correlations were statistically significant (r2=0.50 for δ18>O; r2=0.85 for δ13C; Watanabe et al. 2010) and suggest that isotopic ratios of stalagmites are useful proxies for reconstructing rainfall amounts in the region. To account for the time lag of the water percolation from the land surface into the cave, we measured the percolation time of dripwater in the Ciawitali Cave by the 3H-3He dating method (Yamada et al. 2008). We obtained a percolation time of ca. 13 years. Taking this into account, the negative correlation disappears between the isotopic data and the instrumental rainfall record. This suggests that the δ18O and δ13C values of the stalagmite are immediately influenced by the climatic conditions outside the cave, probably via the piston-flow mechanism of groundwater and in-situ CO2 degassing described by Watanabe et al. (2010).
In addition, we measured δ18O and δ13C values over the last 500 years (1440-2006 AD) and found that δ18O and δ13C varied from -7.7 to -5.4‰ and from -14.1 to -11‰, respectively. The δ18O and δ13C variations show synchronous changes throughout the entire period. Enriched 18O signatures around 1600, 1800 and 1990 AD suggest episodes with drier conditions. These episodes coincide with evidence of droughts documented in lake sediments of East Java (Rodysill et al. 2011), and hence are likely associated with regional hydrologic anomalies caused by ENSO dynamics.
Further δ18O and δ13C measurements are in progress to reconstruct rainfall anomalies in the Asian tropics during the past millennium, especially during the Medieval Climate Anomaly and Little Ice Age.
Selected references
Full reference list online under: http://pastglobalchanges.org/products/newsletters/ref2012_2.pdf
Cai B et al. (2010) Journal of Geophysical Research 115, doi: 10.1029/2009JD013378
Sinha A et al. (2011) Geophysical Research Letters 38, doi: 10.1029/2011GL047713
Watanabe Y et al. (2010) Palaeogeography, Palaeoclimatology, Palaeoecology 293: 90-97
Yamada M (2008) Geophysical Research Letters 35, doi: 10.1029/2008GL033237
Koji Fujita and Akiko Sakai
Graduate School of Environmental Studies, Nagoya University, Nagoya, Japan; cozynagoya-u.jp
We reconstructed long-term river runoff from a glaciated catchment to better understand the role of glaciers as a water resource and the impact of climate change on human activities at an oasis on the Silk Road.
The glacier as a water resource
 |
|
Figure 1: A) Location of the Heihe River, northwest China. Red rectangle indicates the area shown in panel B. B) The catchments of upper stream basins. Stations where several decades worth of hydrological and meteorological data are available are indicated (black circles), as is the July 1st Glacier, where glaciological observations were conducted for the period 2002-2005. Blue dots denote glaciers in the basin delineated from satellite images. Each grid square is equivalent to the grid of the used APHRODITE precipitation dataset (0.5°; Yatagai et al. 2009). |
As glaciers continue to retreat due to the on-going effects of global climate change, the availability of water during summer within river systems is expected to decline (e.g. IPCC 2007). Consequently, there has been considerable interest in gaining a better understanding of the contribution of glacial meltwater to river runoff in a number of catchments (e.g. Immerzeel et al. 2010; Kaser et al. 2010; Huss 2011). A mutual conclusion in these studies is that fluctuation of glacier meltwater significantly affects the river runoff if the river flows into arid terrain because water supply from precipitation will for a large part not attain the lower reaches. These studies tend to focus on evaluating the present-day contribution of meltwater to river runoff, and projections of likely future levels. In contrast, there has been less interest in the reconstruction of long-term historical runoff patterns at high temporal resolutions (e.g. annual) in glaciated catchments. One explanation for this may be that while paleoclimatic studies use several established proxies to reconstruct climate indices such as temperature, precipitation, or flood and drought events, finding an appropriate proxy for river runoff remains challenging. In this paper, we use models and climate reconstruction data to estimate the long-term (past 2000 years) runoff of the Heihe River in an arid basin in northwestern China (Fig. 1), where precipitation in the surrounding mountain ranges plays a significant role in providing water for the desert and oasis cities.
Reconstructing glacial runoff
 |
|
Figure 2: Climate and runoff records for the Heihe Basin covering the past two millennia. A) Annual mean temperature anomaly rel. to AD 1966-1995 (Yang et al. 2002), and annual precipitation (Zhang et al. 2003). B) Glacier area and contribution of glacier runoff to total runoff (Sakai et al. 2012). The present and LIA extents are shown by the black dot and line, respectively. C) Total annual catchment runoff, annual glacier runoff (Sakai et al. 2012), and trend of glacier extent (see equation in the main text). D) Five-year moving average of river runoff and drought events recorded in historical documents. Five prolonged drought periods (a-e) are highlighted (Sakai et al. 2012). Thick lines denote drought-free periods, which are discussed in the main text. Green shading denotes trends of agricultural activity in the region as retrieved from historical documents (Inoue et al. 2007; Nakawo 2011). |
We calculated river runoff components using an energy-mass balance model for glacier runoff (Fujita and Ageta 2000; Fujita et al. 2007) and a simple hydrological model for runoff from glacier-free terrain (Sakai et al. 2010). As meteorological variable input for the models, we used temperature and precipitation, and estimated relative humidity and solar radiation from precipitation (Matsuda et al. 2006; Sakai et al. 2010). Temperature and precipitation input data for the past 2000 years were obtained from tree-ring and ice-core studies (Yang et al. 2002; Zhang et al. 2003; Fig. 2A). Statistical downscaling was performed using meteorological data from neighboring stations (Fig. 1B). The spatial distribution and lapse rate were established by reference to gridded datasets (Kalnay et al. 1996; Yatagai et al. 2009) and are assumed to have remained constant through time. Accuracies of the models were tested against observed hydrological and glaciological data in the same region (Sakai et al. 2009, 2010). Changes in the size of the glacier are significant over the long term, as water runoff is significantly affected by changes in the extent of the ice cover. A simple but plausible glacier fluctuation model was established using an area-volume relationship for the glacier (Chen and Ohmura 1990; Liu et al. 2003). Glaciers in the catchment were delineated from a Landsat ETM+ image (Fig. 1B), and were classified into five classes based on the area they cover, as changes in glacier size vary according to their geometry (van de Wal and Wild 2001; Raper and Braithwaite 2006).
Controls on glacial runoff
We validated our calculated results against the known extent of glaciation in the Little Ice Age (LIA), which was determined from the positions of moraines on the satellite image and the present extent (Fig. 2B). River runoff levels reconstructed throughout the last 2000 years correlate closely with precipitation (r = 0.997, p<0.001; Fig. 2A and 2C), due to the small proportion of the catchment that was glaciated (1.3±0.2%). The average contribution from glacier runoff (1.8%) is slightly larger than might be expected based on the proportion of the glaciated catchment (1.3%), due to the effect of altitude on precipitation (it increases with altitude), which allows the glaciers to provide relatively more water than their extent would indicate.
We defined the trend of glacier extent (GT, km2 yr-1) by the following equation,
GT(t)=(GA(t+1)−GA(t−1))/2,
where GA and t denote glacier extent and time, respectively. Glacier runoff, and its contribution to the total river runoff, both showed a strong negative correlation with the trend of glacier extent (r = –0.741 and r = –0.925 respectively, both p<0.001, Fig. 2C). This implies that the glaciers have supplied excess meltwater to the river by reducing their ice storage during periods of glacier shrinkage. In contrast, when the glaciers were expanding during colder or more humid periods, storage of ice mass in the body of the glacier increased, and glacier runoff and its relative contribution to total runoff decreased accordingly. These results suggest that variations in glacier runoff and its contribution to river runoff do not always relate directly to glacier extent, but are also influenced by the nature of glacier response to changing environmental conditions.
Impact of human activities
Many historical documents covering the last 800 years are available for the Heihe River catchment, and allow us to compare our reconstructed river runoff levels with contemporary accounts (Fig. 2D). We use a record of drought events and highlight five of the most significant drought periods, which continued intermittently for periods of several years (labeled a-e), and a record of relative agricultural activity in the middle reach of the river (Inoue et al. 2007; Nakawo 2011). River runoff levels during drought events a, c, and e were relatively small; consequently, we suggest that these droughts were climate driven. In contrast, reconstructed river runoff during drought events b and d were relatively large. Therefore, these drought events may be attributable to human activity rather than climatic factors, and might have been caused for example, by excessive extraction of river water for irrigation. Indeed, in this region, the pioneering phase of agricultural land-use had already begun in the 13th century. In figure 2D, three relatively long drought-free periods are marked with thick lines. During the first period (AD 1355-1425), agricultural land-use had declined; therefore, human-induced droughts were unlikely, as there was a plentiful supply of natural water available (high runoff) to meet demand. The latter two periods (AD 1825-1855 and AD 1885-1925) coincide with the Dongan Revolt, during which agricultural land was left uncultivated.
Our results suggest that longer drought-free periods in the Heihe River catchment only occurred during phases with relatively low human impact and high river runoff (Sakai et al. 2012).
Past or future?
In the studied catchment, glacier extent is too small for glacier runoff to significantly affect the total runoff of Heihe River. Fluctuations in river runoff are primarily controlled by precipitation. Consequently, patterns of past precipitation levels reconstructed from ice cores and tree rings can be used to reconstruct changes of water availability in this region. However, in a more glaciated catchment, river runoff can fluctuate in a more complicated way and the influence of the glaciers is more important. It is generally believed that glacier shrinkage will lead to a shortage of water resources under a warming climate; however, our study suggests that the trend of glacier extent, advancing or retreating, is, on a shorter term, a more significant control on glacier runoff and its contribution to the river system.
Forecasting changes to the extent of glaciers, and the impact on river runoff is a societal need under the present warming climate. Current river-runoff level projections contain numerous uncertainties caused by changing environmental conditions and the application of differing general circulation and regional models. We have shown that our river runoff reconstruction based on paleoclimatological data combined with historical documents from the region, can be used to discriminate the runoff types and attribute the nature of drought events in the arid Heihe River Basin.
Selected references
Full reference list online under: http://pastglobalchanges.org/products/newsletters/ref2012_2.pdf
Fujita K, Ohta T, Ageta Y (2007) Hydrological Processes 21(21): 2882-2891
Immerzeel WW, van Beek LPH, Bierkens MFP (2010) Science 328: 1382-1385
Sakai A, Fujita K, Nakawo M, Yao TD (2009) Hydrological Processes 23(4): 585-596
Sakai A et al. (2010) Hydrological Processes 24(19): 2798-2806
Two centuries of climate events detected in coral records from Ishigaki and Ogasawara Islands, Japan
Atsushi Suzuki
Geological Survey of Japan, National Institute of Advanced Industrial Science and Technology (AIST), Japan; a.suzukiaist.go.jp
Coral records from the subtropical northwestern Pacific reveal abrupt cooling and a shift toward fresher surface ocean conditions between 1900 and 1910 AD.
_opt.png) |
|
Figure 1: Map of the northwestern Pacific showing the locations of the Ishigaki and Ogasawara Islands. The typical winter East Asian sea-level atmospheric pressure distribution (isolines) and the path of the Kuroshio current (red arrow) are also shown. Northerly winds (East Asian winter monsoon) blowing from the Siberian High influence the climate around Japan in winter (blue arrows). Modified from Mishima et al. (2010). |
Only about 100 years or less of observational data for the ocean environment in the subtropical northwestern Pacific exist. Geochemical tracers, such as stable oxygen isotopes (δ18O), strontium/calcium (Sr/Ca) and uranium/calcium (U/Ca) ratios in skeletons of massive corals are excellent paleoclimatic and paleoceanographic proxies to extend our knowledge of the ocean environment beyond the instrumental record. Recently, a coral record going back to 1873 AD from Chichijima in the Ogasawara Islands (Felis et al. 2009) and a 165-year long record from Ishigaki Island, southern Ryukyus (Mishima et al. 2010) have become available (Fig. 1). These coral records reveal several coupled ocean-atmosphere phenomena during the early 20th century in the northwestern subtropical Pacific.
Abrupt freshening event recorded in the Ogasawara coral
The Ogasawara Islands (27°N, 142°E), approximately 1000 km south of Tokyo, Japan, are exposed to the open ocean environment. Felis et al. (2010) reported that the winter Sr/Ca and U/Ca paleotemperature records from an annually banded coral were significantly correlated with the instrumental winter Pacific Decadal Oscillation (PDO) index over the last century. The PDO is an indicator of North Pacific sea surface temperature (SST) anomalies poleward of 20°N.
_LvG_opt.png) |
|
Figure 2: Time series of (A) annual coral δ18O (SST) data, (B) observed winter (December–February average) SST at Ishigaki Island, and (C) residual coral δ18O records (Δδ18O) in the Ogasawara Islands, based on both δ18O and Sr/Ca. VPDB refers to the Vienna PeeDee Belemnite standard. The coral-based sea surface salinity (SSS) anomaly was calculated from the regional δ18O seawater–salinity relationship (0.42‰ per 1 psu; Felis et al. 2009). The yellow bars correspond to the abrupt cooling (1900-1905) inferred at Ishigaki Island and the abrupt freshening (1905-1910) in the Ogasawara Islands. |
Felis et al. (2009) also reconstructed annually resolved sea surface salinity (SSS) variations since 1873 from the δ18O record and identified an abrupt shift toward fresher surface ocean conditions between 1905 and 1910 (Fig. 2C). They concluded that the Ogasawara freshening could not be explained by precipitation changes but resulted from a combination of atmospheric and oceanic convection processes.
The Ishigaki coral record and the East Asian winter monsoon
Ishigaki Island (24°N, 124°E) is in the marginal East China Sea (Fig. 1), where the ocean environment reflects complex influences from the Kuroshio Current and the East Asian monsoon. Although δ18O can record changes in both SST and SSS, at Ishigaki, seasonal SSS changes are very small, whereas seasonal SST are well reflected by the δ18O values. Winter δ18O and observed SST, measured at Ishigaki Port, showed a significant linear correlation (Fig. 2A, B), which suggests that the winter δ18O data from this coral sample is a good proxy for reconstructing past climate change. SST reconstructions can be used to investigate the relationship between the East Asian winter monsoon (EAWM) and the El Niño–Southern Oscillation (ENSO). Before 1988/1989, the coral-based and instrumental winter SSTs were related to the EAWM, whereas after that winter they were more highly correlated to ENSO, reflecting a regional change in the climate regime (Tsunoda et al. 2008).
The Ishigaki δ18O coral record revealed abrupt cooling during 1900-1905 (Fig. 2A). This cold event was also seen in the coral Sr/Ca data, and its timing is consistent with Japanese observations of exceptionally low temperatures in the winter of 1902. The presence of a strong Siberian High coupled with a strong EAWM and weak westerly winds, possibly accompanied by active heat convection in the tropics, might account for the cold winter at this time (Mishima et al. 2010).
Unique observations of coupled early 20th century climate events in the northwestern Pacific
Interestingly, the abrupt cooling at Ishigaki Island occurred several years before the abrupt freshening in the Ogasawara Islands inferred from the coral isotope and trace element variations (Felis et al. 2009). The North Pacific High, which dominates the North Pacific Ocean, affects SSS; a strong North Pacific High is associated with high salinity. Strong westerly winds tend to enhance the North Pacific High because of its great height, approaching the height of the jet stream. Conversely, the freshening at Ogasawara suggests weak westerly winds, possibly associated with a weakened Kuroshio recirculation gyre, which flows from south of Honshu, Japan’s main island, toward the Ogasawara Islands. In contrast, the Kuroshio's path from Taiwan to Ishigaki Island is relatively stable. Thus Ishigaki tends to be always under the influence of the saline Kuroshio and is thus unlikely to experience freshening such as that inferred at Ogasawara.
The decrease in SST indicated in the Ishigaki coral δ18O record was not observed in the Ogasawara coral record. A strong EAWM, which brings cold winds to the Japanese archipelago, is not likely to affect more pelagic environments such as the Ogasawara Islands. The approximately five-year time lag between the cold SSTs at Ishigaki and the freshening in the Ogasawara Islands is consistent with the findings of Deser et al. (1999), who reported that changes in the Kuroshio and associated North Pacific Ocean circulation lagged westerly wind changes by four to five years. By this mechanism, the early 20th century cooling recorded by the Ishigaki coral may be related to the surface ocean freshening record in the Ogasawara coral. Thus, these records are unique evidences of coupled ocean-atmosphere phenomena during the first decade of the 20th century in the subtropical northwestern Pacific.
Future research
The reliability of paleoclimate reconstructions could be improved by applying the dual proxy approach, utilizing element ratios such as Sr/Ca along with oxygen isotope data, to the Ishigaki coral record. This approach would allow independent reconstruction of SST and SSS variation and make it possible to determine whether cold events around Ishigaki Island are associated with successive regional climate regime shifts. Coral-based reconstructions are now being extended to different time windows, including the Little Ice Age, the mid-Holocene warm period (Yokoyama et al. 2011), the last glacial maximum (Mishima et al. 2009), and the mid-Pliocene Warming Period (Watanabe et al. 2011). Also, the investigation of Porites coral tsunami boulders is a promising approach for long-term paleoclimate reconstruction (Suzuki et al. 2008; Araoka et al. 2010). The robustness of Porites coral records has been tested in a series of laboratory culture experiments to provide practical guidelines for the interpretation of coral climate proxies (Suzuki et al. 2005; Omata et al. 2008, Hayashi et al. in press).
Selected references
Full reference list online under: http://pastglobalchanges.org/products/newsletters/ref2012_2.pdf
Felis T et al. (2009) Geology 37: 527-530
Mishima M et al. (2010) Geophysical Research Letters 37, doi: 10.1029/2010GL043451
Suzuki A, Hibino K, Iwase A, Kawahata H (2005) Geochimica et Cosmochimica Acta 69: 4453-4462
Watanabe T et al. (2011) Nature 471: 209-211
Yokoyama Y et al. (2011) Geophysical Research Letters 38, doi: 10.1029/2010GL044231
Hiroko Miyahara1,2, Y. Yokoyama2,3, Y.T. Yamaguchi2,3 and T. Nakatsuka4
Anomalous changes in the heliospheric environment and incident cosmic rays during the Maunder Minimum in the 17th century may enable us to understand the impact of galactic cosmic rays on Earth’s climate system.
Solar activity and climate change
The history of solar activity can be reconstructed by measuring cosmogenic nuclides such as 14C in tree rings and 10Be in ice cores. Comparisons between reconstructed solar activity and climate during the past 10,000 years have revealed that their variations are synchronized at a wide range of time scales, from decades to millennia. Given that the variability in solar irradiance is assumed to be small (~0.1%), it is necessary to consider other solar-related forcings to explain observed climatological phenomena such as the expansion of glaciers and changes in monsoonal activity. One possible medium of solar forcing is galactic cosmic rays modulated by the solar magnetic field in the heliosphere. The decadal and longer cycles of solar activity lead to temporal variations in the attenuation level of cosmic rays. Cosmic rays influence atmospheric ionization and the production of cloud condensation nuclei (Kirkby et al. 2011), although the detailed mechanism of their influence on the amount of clouds in the troposphere is not fully understood. Solar UV and solar wind also influence the climate by promoting chemical reactions in the stratosphere and mesosphere. The intensity of solar-related parameters follows the 11-year cycle of solar activity and is more or less synchronized among the various parameters. This makes it difficult to distinguish the climatic influence of cosmic rays versus other solar-related effects. Here we discuss the cosmic ray events around the 17th century that might help shed some light on the influence of cosmic rays on regional and global climate.
Heliospheric environment and cosmic rays
 |
|
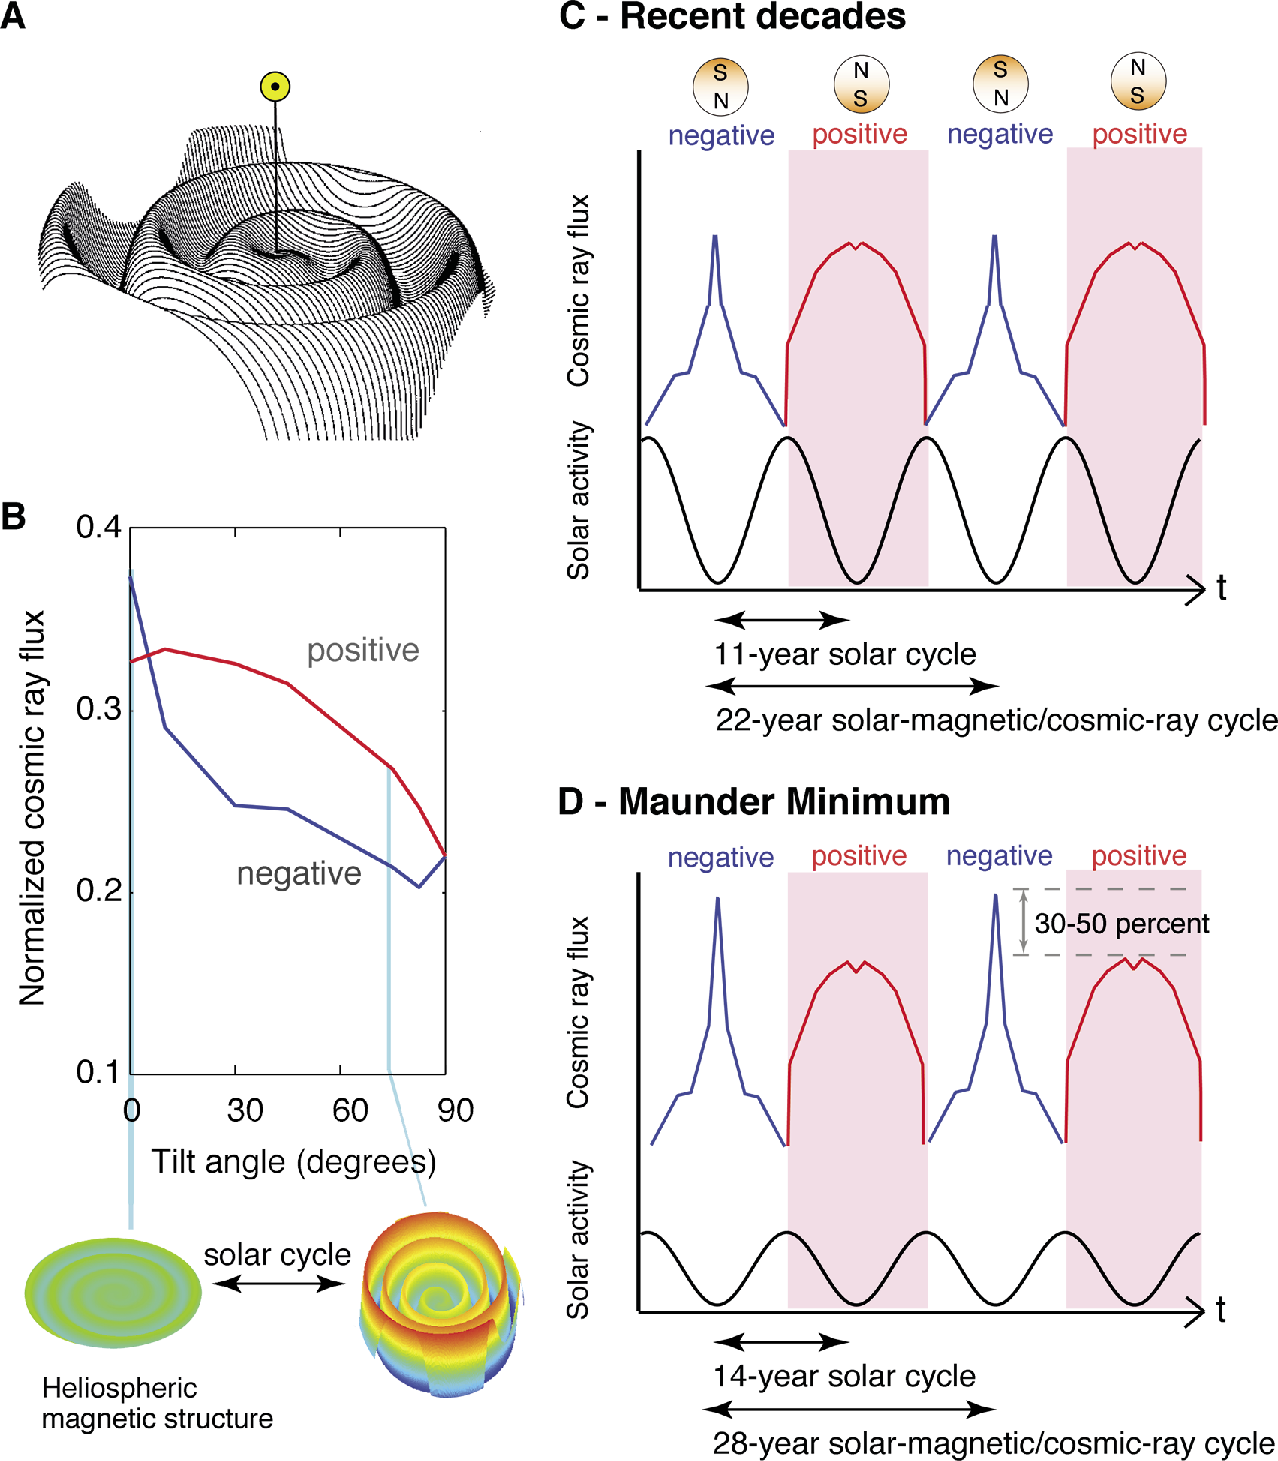
Figure 1: A) Schematic of the heliospheric magnetic field with the Sun located at the center (modified after Jokipii and Thomas 1981). B) Relation between the numerically calculated intensity of galactic cosmic rays at the Earth and the waviness of the heliospheric magnetic field (as illustrated by the schematics below the graph), for both positive and negative polarities of the solar dipole magnetic field (based on Kota and Jokipii 2001). C) Cosmic-ray time profile at the Earth in the case of a tilt angle of 5° at solar cycle minima and 75° at maxima, as is observed during the recent decades. D) As for C), but for tilt angles of 0° at cycle minima, which reproduces the cosmic ray variation at the Maunder Minimum. Note that the polarity reverses at every maximum of the solar cycle, and that the length of the solar cycle tends to be longer (e.g. 14 years during the Maunder Minimum) when solar activity is suppressed. |
 |
|
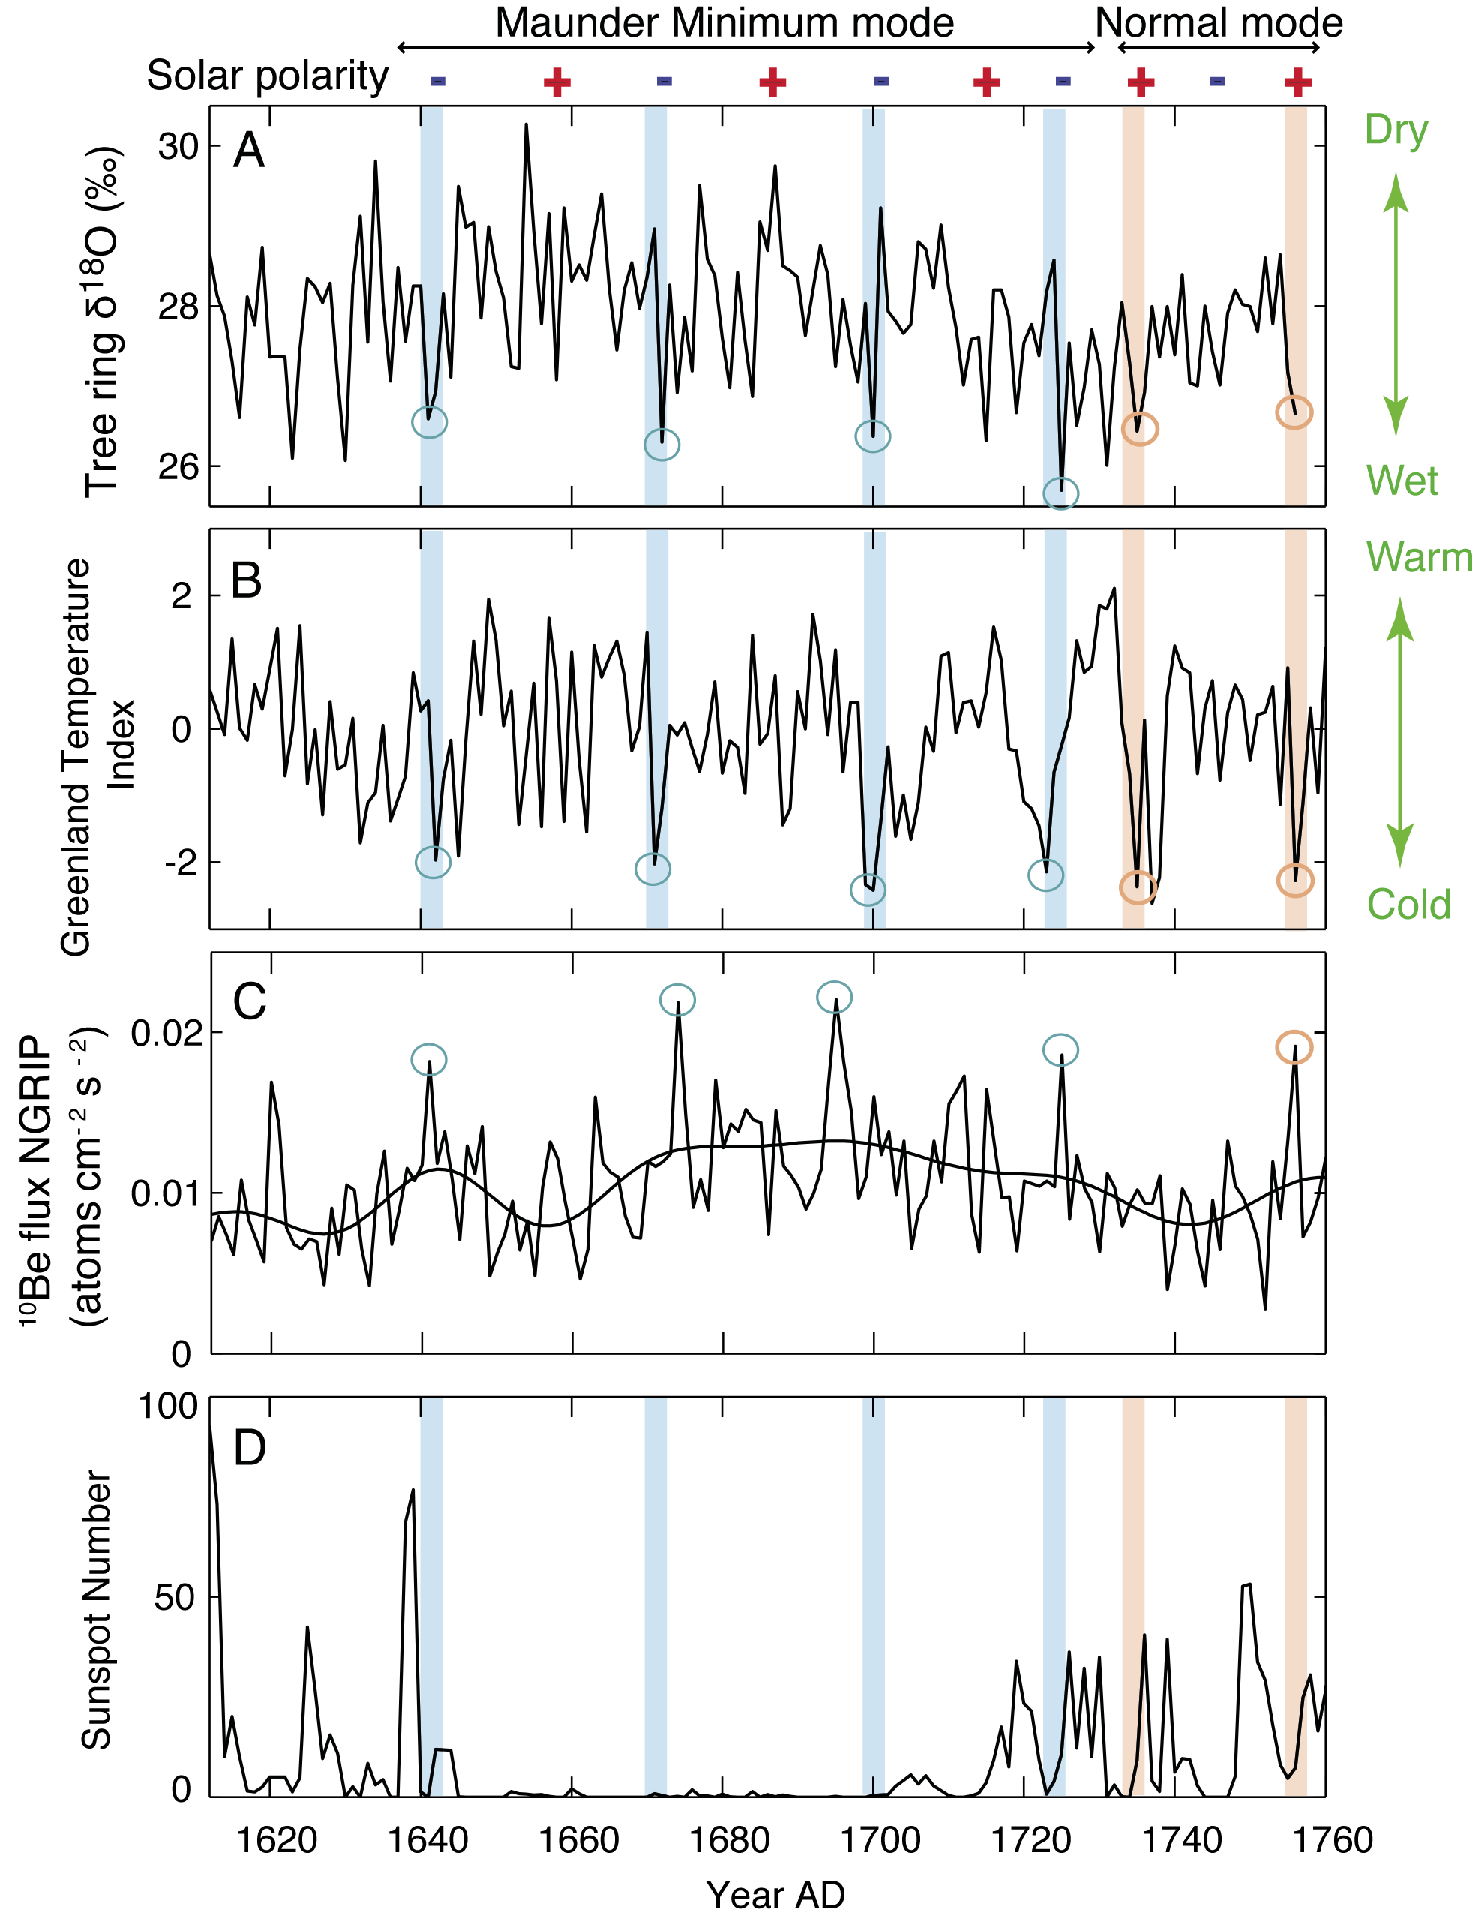
Figure 2: Temporal trends in A) relative humidity in Japan reconstructed based on 18O in tree-ring cellulose (Yamaguchi et al. 2010), B) reconstructed temperature in Greenland based on 18O in ice cores (Vinther et al. 2003), C) cosmic-ray-induced nuclides (Berggren et al. 2009), and D) sunspot numbers (Hoyt and Schatten 1998). Open circles denote annual-scale 30%-50% enhancements in cosmic rays C), and the corresponding climate response (A, B). Blue and red shadings periods of negative and positive solar polarity, respectively. Figure modified from Yamaguchi et al. 2010. |
Galactic cosmic rays are attenuated in the heliosphere, which is an expansion of the wavy solar magnetic field (Fig. 1A). The complex magnetic structure of the solar surface is swirled by the 27-day rotation of the Sun and dragged outward by the solar wind to form a spirally wound heliospheric magnetic field. The attenuation level of cosmic rays is influenced by changes in the intensity of the solar magnetic field, magnetic polarity, and the large-scale structure of the wavy heliospheric magnetic field. The waviness of the field tends to be greater when solar activity is high; consequently, it changes over the 11-year cycle of solar activity as well as at centennial to millennial time scales. The reversal in solar magnetic polarity that occurs at each decadal maximum in the solar cycle is also influencing the attenuation level of cosmic rays. The changes in the polarity of the solar magnetic dipole and in the direction of the solar magnetic field line alter the trajectory of positively charged galactic cosmic rays in the heliosphere. A numerical simulation of the intensity of cosmic rays incident to the Earth can reproduce variations in the intensity of cosmic rays due to changes in solar magnetic polarities (Fig. 1B; Kota and Jokipii 2001). In recent decades, the waviness of the heliospheric magnetic field has been suppressed to about 5° at cycle minima, and has increased to about 75° at cycle maxima. The observed cosmic ray variations are well reproduced by the simulated time profile in Figure 1C; however, changes in the range of tilt angles can cause anomalous variations in the time profile of cosmic rays incident to the Earth. For example, if we assume that the heliospheric magnetic field is completely flattened at every cycle minimum, the graph in Fig. 1B suggests that the time profile of cosmic rays would become that shown in Fig. 1D. Indeed, the record of beryllium-10 from an ice core in Greenland (Fig. 2C; Berggren et al. 2009) reveals that cosmic ray variations at the Maunder Minimum, a period of very low sunspot activity in the 17th century, may have had the profile shown in Fig. 1D (Yamaguchi et al. 2010). The 10Be record around the Maunder Minimum (AD 1645-1715) shows four anomalous spikes near minima of the solar cycle at negative polarity. The intensities of the cosmic-ray spikes are 30%-50% greater than those of peaks during times of positive polarity. We propose that the disappearance of sunspots at the Maunder Minimum (Fig. 2D) resulted in a completely flattened heliospheric magnetic field at solar minima, and caused anomalous enhancements in incident cosmic rays. It is also possible that maxima in long-term solar activity, such as the Medieval Solar Maximum, are characterized by anomalous temporal variations in cosmic rays.
Regional and global responses to cosmic ray spikes
The anomalous variations in cosmic rays during the Maunder Minimum enable us to trace the response of regional–global climate to galactic cosmic rays, and to understand the response of the climate system overall. It can be assumed that decadal-scale variations in solar irradiance and UV were suppressed during this 70-year period, given the absence of sunspots. In contrast, variations in cosmic rays were amplified during this period due to changes in the heliospheric environment, and four anomalous spikes occurred during this time. A comparison of the reconstructed climate and cosmic-ray-induced nuclides during the Maunder Minimum reveals that annually resolved records of climate from Greenland and Japan have synchronized 1-year-scale anomalies around the time of these four spikes (Fig. 2; Yamaguchi et al. 2010). The 10Be record from the Greenland ice core has a dating error of several years, giving rise to a discrepancy in timing between the 10Be record and the two climate records; however, a comparison of the superimposed spikes in 14C and climate data obtained from annually-dated tree rings suggests that the climate responded to the 1-year cosmic ray spikes without a time lag. A search for these 1-year spikes in climate records (e.g. precipitation and temperature) over the globe may help to understand how cosmic rays affect the climate system.
Changes in the 11-year solar cycle
Frequency analyses of annually resolved 14C records obtained from absolutely-dated tree rings enable a reconstruction of past changes in the solar decadal cycle. The long-term record of 14C reveals that solar activity has quasi-periodic variations at centennial to multi-decadal time scales, and that a long-term absence of sunspots occurs every 100-300 years. The 14C records also show that the solar cycle continues uninterrupted during periods without sunspots, such as the Maunder Minimum, although the length of the cycle increases from 11 to ~14 years (Fig. 1D). Inversely, the 14C record indicates shorter periods in the solar cycle during maxima in long-term solar activity. During the Early Medieval Solar Maximum (9th-10th centuries), the length of the solar cycles decreased from 11 to ~9 years (Miyahara et al. 2008).
These results suggest that the incident cosmic rays have complex time profiles at decadal to multi-decadal scale, due to the changing solar cycle length and the heliospheric environment. This variation may help explain the complexity of multi-decadal climate variations.
affiliations
1Institute for Cosmic Ray Research, The University of Tokyo, Kashiwa, Japan; hmiyaicrr.u-tokyo.ac.jp
2Japan Agency for Marine-Earth Science and Technology, Yokosuka, Japan
3Atmosphere and Ocean Research Institute, The University of Tokyo, Kashiwa, Japan
4Graduate School of Environmental Studies, Nagoya University, Nagoya, Japan
selected references
Full reference list online under: http://pastglobalchanges.org/products/newsletters/ref2012_2.pdf
Berggren AM et al. (2009) Geophysical Research Letters 36, doi: 10.1029/2009GL038004
Kota J and Jokipii JR (2001) Advances in Space Research 27: 529–534
Kirkby J et al. (2011) Nature 476(7361): 429-433
Miyahara H, Yokoyama Y, Masuda K (2008) Earth and Planetary Science Letters 272: 290-295
Masumi Zaiki1, M.J. Grossman2 and T. Mikami3
Proxy and instrumental data from historical documents in Japan provide a picture of climate variability during the “Little Ice Age”.
Paleoclimate reconstruction is essential for understanding past climate variability and its driving mechanisms within the global climate system. From the abundant historical documents preserved in Japan, unique climate reconstructions have been developed using qualitative meteorological information contained in them. Additionally, documents with instrumental meteorological data collected before 1872, when official meteorological observations began, were recently discovered and prepared for scientific analysis. Such approaches to reconstructing past climates are included in the field of historical climatology. In this article, the characteristics of these proxy and instrumental data from documentary sources are introduced and reconstructed climatic variations in and around Japan are described.
Qualitative meteorological information from historical documents
In Japan, official meteorological data collected by the Japan Meteorological Agency (JMA) have been available only since 1872. There are however, several kinds of historical documentary sources, which enable reconstructions of climate variations before the 19th century in and around Japan. Historical documents including diaries of individuals, logs of clan offices, government documents, and reports from temples and shrines are preserved in local libraries and museums. These documents often contain daily weather descriptions such as “cold”, “fine”, “rainy” and “windy”, and mention special climate-related natural phenomena such as “lake freezing” and “flower blooming”.
_LvG_opt.png) |
|
Figure 1: Time series of reconstructed (green lines) and observed (black/gray lines) July temperatures in Tokyo for 1721-2000. Thin lines indicate year-to-year variations and thick lines indicate 11-year running mean. Figure modified and updated from Mikami (1996). |
Figure 1 is an example of a summer temperature reconstruction based on daily weather descriptions from the Ishikawa diaries; continuous family diaries kept in the western suburbs of Tokyo from 1721 to 1940 (Mikami 1996). Under present conditions, generally hot summers are experienced in Japan under the influence of strong subtropical highs, which bring dry and sunny weather conditions. Cool summers occur under the influence of stagnant polar fronts and passing extra-tropical cyclones, which bring cloudy and rainy weather conditions. As the number of rainy days highly correlates with the mean temperature in a summer month, especially in July (the correlation coefficient is -0.70 based on the JMA data for 1876-1940), it is possible to reconstruct July temperatures in Tokyo for the period 1721-1940 based on the weather records in the Ishikawa diaries. The reconstructed temperature series show several cooler and warmer periods. From 1721 to 1790, temperatures are estimated to have been about 1 to 1.5°C lower than at present. It should be noted that the temperatures in the 1780s were often very low with large inter-annual variations. In the summer of 1783, an extremely poor rice harvest occurred due to exceedingly cool and wet conditions, and this unusual weather led to a severe famine in Japan. In the 19th century, in contrast to the warmer periods of the 1810s and the early 1850s, the 1830s, late 1860s and late 1890s were relatively cool, and great famines occurred in the 1830s as they had in the 1780s. For the temperatures during the modern period, it is also notable that Tokyo has a very strong urban heat island effect and this is likely to have contributed to warming evident in the 20th century.
As with the reconstruction of summer temperatures, winter temperatures in Nagasaki, in southwestern Japan have been reconstructed based on a highly correlated relationship between snowfall ratio and monthly winter temperatures (Mikami 1992).
In addition to the temperature reconstructions, historical documents and other documentary sources have been used to reconstruct a chronology of typhoons affecting Japan in the 19th century based on diary weather descriptions of “strong wind” and “strong rain” which could be assumed to describe typhoon events. These weather descriptions were corroborated by reports in other historical documents (Grossman and Zaiki 2009).
Information about special climate-related natural phenomena such as “lake freezing” and “flower blooming” are also contained in historical documents. The dates of the complete freezing of Lake Suwa in central Japan have been recorded by the Suwa shrine since the 15th century and winter temperatures were reconstructed based on correlations between the freezing dates and December/January temperatures (Mikami and Ishiguro 1998). Additionally, March mean temperatures in Kyoto since the 9th century have been derived from the cherry blossom flowering date records (Aono and Kazui 2008; Aono and Saito 2010).
Instrumental records before the foundation of the Meteorological Agency
Prior to the founding of JMA, no instrumental meteorological records were believed to exist in Japan apart from qualitative weather descriptions in historical documents. However, documents containing instrumental meteorological data collected in several locations in the 19th century have been (re)discovered. Sub-daily meteorological records from the first half of the 19th century were collected routinely by Dutch scientists living in Japan and by the so-called “Dutch Study”, Japanese scholars who learnt modern western science from the Dutch. Also, in the second half of the 19th century at the end of the period of international isolation of Japan, various Europeans (French, German, Russian) and Americans came to Japan and carried out meteorological observations.
The recovered instrumental observations cover the periods 1825-1828, 1839-1855, and 1872-1875 in Tokyo; 1860-1874 in Yokohama; 1828-1833 and 1869-1871 in Osaka; 1869-1871 and 1875-1888 in Kobe; and 1819-1878 in Dejima/Nagasaki (Können et al. 2003; Zaiki et al. 2006). Before the scientific analysis of the recovered data, the temperature and pressure data were converted to modern units and digitized into a computer readable format. The pressure data were corrected for temperature, elevation, and gravity where needed. The temperature data were homogenized to compensate for changes in recording location. Then, both data sets were homogenized to account for varying observation schedules. The corrected and homogenized data were shown to be reasonable after further testing for homogeneity and comparison with modern JMA data.
_LvG_opt.png) |
|
Figure 2: Time series of West-Japan Temperature (WJT) anomaly for the period 1820-2010. Blue line is derived from newly recovered meteorological data, black line is from official JMA data, and the gray thick line is a smoothed 11-year running mean. Figure modified and updated from Zaiki et al. (2006). |
The availability of the recovered 19th century temperature observations taken at five locations made it possible to construct a West-Japan Temperature (WJT) series, a representative temperature series for the western Japan region (Fig. 2; Zaiki et al. 2006). The results indicate the existence of a relatively warm period from the late 1840s to the 1850s with a few interspersed cold years over western Japan followed by a downward temperature trend that lasted until the early 20th century as previously observed in the documentary data.
The significance of historical meteorological data recovery in Japan reaches beyond just being an extension of the Japanese instrumental record back in time. First, the recovered series occur in a region of the world that is poorly covered by instrumental data, and second, it overlaps with the series of qualitative weather descriptions in historical documents kept at many places in Japan.
Conclusions
A number of climate reconstructions based on qualitative weather descriptions have been carried out in Japan. Although the reconstructed data represent temperatures in particular months or seasons, they have sufficient time resolution to characterize inter-annual variations. Additionally, using this approach for reconstructing a chronology of typhoons further demonstrates the importance of historical climatology in Japan. The instrumental meteorological data collected before the founding of the JMA provide sub-daily meteorological data. In the future, more records will be needed to fill in gaps in this fragmented record.
Past climate variations reconstructed from Japanese historical documents partly enable us to discuss the “Little Ice Age” period especially with regard to regional differences and the magnitude of the cold. To achieve this, further exchange of and constructive corroboration with past climate information reconstructed from various proxy sources will be needed.
affiliations
1Department of Economics, Seikei University, Tokyo, Japan; mzaikiecon.seikei.ac.jp
2Department of Geography, Southern Illinois University Edwardsville, USA
3Department of History, Teikyo University, Tokyo, Japan
selected references
Full reference list online under: http://pastglobalchanges.org/products/newsletters/ref2012_2.pdf
Aono Y, Kazui K (2008) International Journal of Climatology 28: 905-914
Grossman MJ, Zaiki M (2009) Weather 64: 315-322
Können GP et al. (2003) Journal of Climate 16: 118-131
Mikami T (1996) Geographical Reports of Tokyo Metropolitan University 31: 157-165.
Zaiki M et al. (2006) International Journal of Climatology 26: 399-423
Takakazu Yumoto
To reconstruct the relationship between humans and their environment in the Japanese Archipelago, several chronological charts were compiled based on a collective work by interdisciplinary research groups.
Japan is one among 34 global biodiversity hotspots (Conservation International 2012). The Japanese Archipelago extends over 3000 km from north to south, and includes subarctic, cool temperate, warm temperate and subtropical climatic zones. There is evidence that these diverse climatic zones existed even during the global environmental changes that have taken place over the past 100 ka (Tsukada 1983). Under the influence of climatic change and human activities, the distribution of individual species of plants and animals in the Japanese Archipelago has constantly changed. Populations have repeatedly divided, expanded and diminished in response to changes in the availability of suitable habitat. Where suitable habitat was unavailable, the species became extinct.
The knowledge and skills that humans have developed seem to harbor the idea that biological resources should be used in a sustainable way, and the desire to harvest without fear of exhausting the limited resources. Throughout the period of human habitation, the Japanese Archipelago has been blessed with a warm climate and abundant rainfall, and consequently abundant bio-resources. But were those resources overused and exhausted in the past? To answer these questions, we initiated a project to investigate: 1) How subsistence and economic systems were maintained in the past, and how and why they ended, and 2) the underlying social system (social structure, economic foundation, system of spatial organization, technical system, perception of nature) and how it evolved after the collapse of the subsistence and economic systems.
Research methods and structure
To elucidate the historical process of change in human-nature relationships in Japan, we used regional pollen records, archeological remains and historical documents. In addition, we examined the historical and economic background, in particular knowledge and skills concerning the environment, to study their relation to the disappearance or thriving of plants and animals that were closely related to human subsistence. The project was subdivided into several working groups:
1) To reconstruct and analyze ancient vegetation and changes in the distribution of plant and animal species based on fossil records (Sasaki and Takahara 2011; Sasaki and Takahara 2012), DNA from living organisms, and historical documents (Kawase et al. 2010; Tsujino et al. 2010).
2) To reconstruct regional human diets by analyzing stable isotopes on human and faunal bones (Kusaka et al. 2010).
3) To reconstruct the past human-nature relations and analyze the regional social systems.
4) To synthesize the evidence and ideas from the project, and propose policy and guidelines for better human-environment interaction.
Compiled chronological charts
_LvG_opt.png) |
|
Figure 1: Chronological chart of the Japanese Archipelago during 0-2000 AD. The periods of governance and their names are given at the top of the figure. |
_LvG_opt.png) |
|
Figure 2: Chronological chart of the Japanese Archipelago during 1850-2010 AD. The periods of governance and their names are given at the top of the figure. |
A series of chronological charts of environmental history for each region were compiled from epoch-making events on environmental issues and policy changes on resource managements (Fig. 1 and 2). The charts were completed by adding data of estimated vegetation changes (based on pollen analysis) and population change (based on historical demography). In total, more than 6000 chronological data were compiled in a time-sequence database. High-resolution climatic data are still missing in the compilation, but will be implemented at a later stage. The chronological charts revealed that the multi-layered governance (e.g. community, local government, national government, international organization) either sustainably managed their bio-resources or collapsed.
“Wise use” of what, by whom, for whom
The expression “wise use” was defined as the knowledge and skills needed to use the bio-resources and ecosystem services in sustainable ways. Examples of “wise use” and “unwise use” from each region were sorted out and categorized by identifying which multi-layered governance took an initiative role. Our results showed that governance at the community level always played a critical part in the sustainable use of the ecosystem services, whereas regional governance covering wider areas sometimes led to their collapse. This is an important lesson from the past, showing that the community level or local layer of governance driven by the people who suffer most from the degradation of the ecosystem service should be given priority over larger-scale governance. Also, in cases showing sustainability or recovery from a collapse, collaboration between the local communities and regional to national governances was critical.
affiliation
Research Institute of Humanity and Nature, Kyoto, Japan; yumotochikyu.ac.jp
selected references
Full reference list online under: http://pastglobalchanges.org/products/newsletters/ref2012_2.pdf
Kawase D et al. (2010) Journal of Heredity 101: 292-297
Kusaka S et al. (2010) Journal of Archaeological Science 37: 1968-1977
Sasaki N, Takahara H (2011) Journal of Archaeological Science 38: 1199-1208
Sasaki N, Takahara H (2012) Quaternary International 254: 3-11
Tsujino R, Ishimaru E, Yumoto T (2010) Mammal Study 35: 179-189
Eugene R. Wahl1, H.F. Diaz2, V. Trouet3 and E.R. Cook4
A tree-ring based reconstruction of decadal annual mean temperature over temperate North America for the period 1200–1980 is presented. Temperatures generally cool from the early 1300s to the early 1800s and are consistently above the long-term mean after the early 1900s, a unique feature in this record.
The PAGES 2k Network initiative aims to reconstruct basic climate variables for the last 2000 years. This article describes an effort to produce a long (1200-1980 AD) annual temperature reconstruction for temperate North America (30-55°N, 75-130°W) at decadal-average resolution based on tree-ring records primarily from western North America. We describe the methodology used in the reconstruction, briefly compare it with lower resolution regional temperature reconstructions based on fossil lake pollen records from upper midwestern and northeastern United States (Wahl et al. 2012; Viau et al. 2012), and offer a brief discussion of our results in the context of other climate reconstruction studies (e.g. Hughes et al. 2011).
Two semi-independent tree-ring data sets (approximately 30% overlap) are used in the reconstruction. One set extends from 1500-1980 AD covering an area in western mid-latitude North America bounded by 30°-55°N, 95°-130°W (with one additional chronology in west-central Mexico, Wahl and Smerdon 2012). The proxy data were calibrated and validated using the HadCRUT3v 5°x5° gridded surface temperature data for the selected region for the period 1875-1980. The resulting annual temperature reconstruction is hereafter referred to as the WS12 series. A second tree-ring data set covering a longer period (1200-1980 AD) and extending into eastern North America in the same latitude range and into Alaska and the Canadian Yukon was calibrated and validated against the western-region modern record in the same manner as WS12.
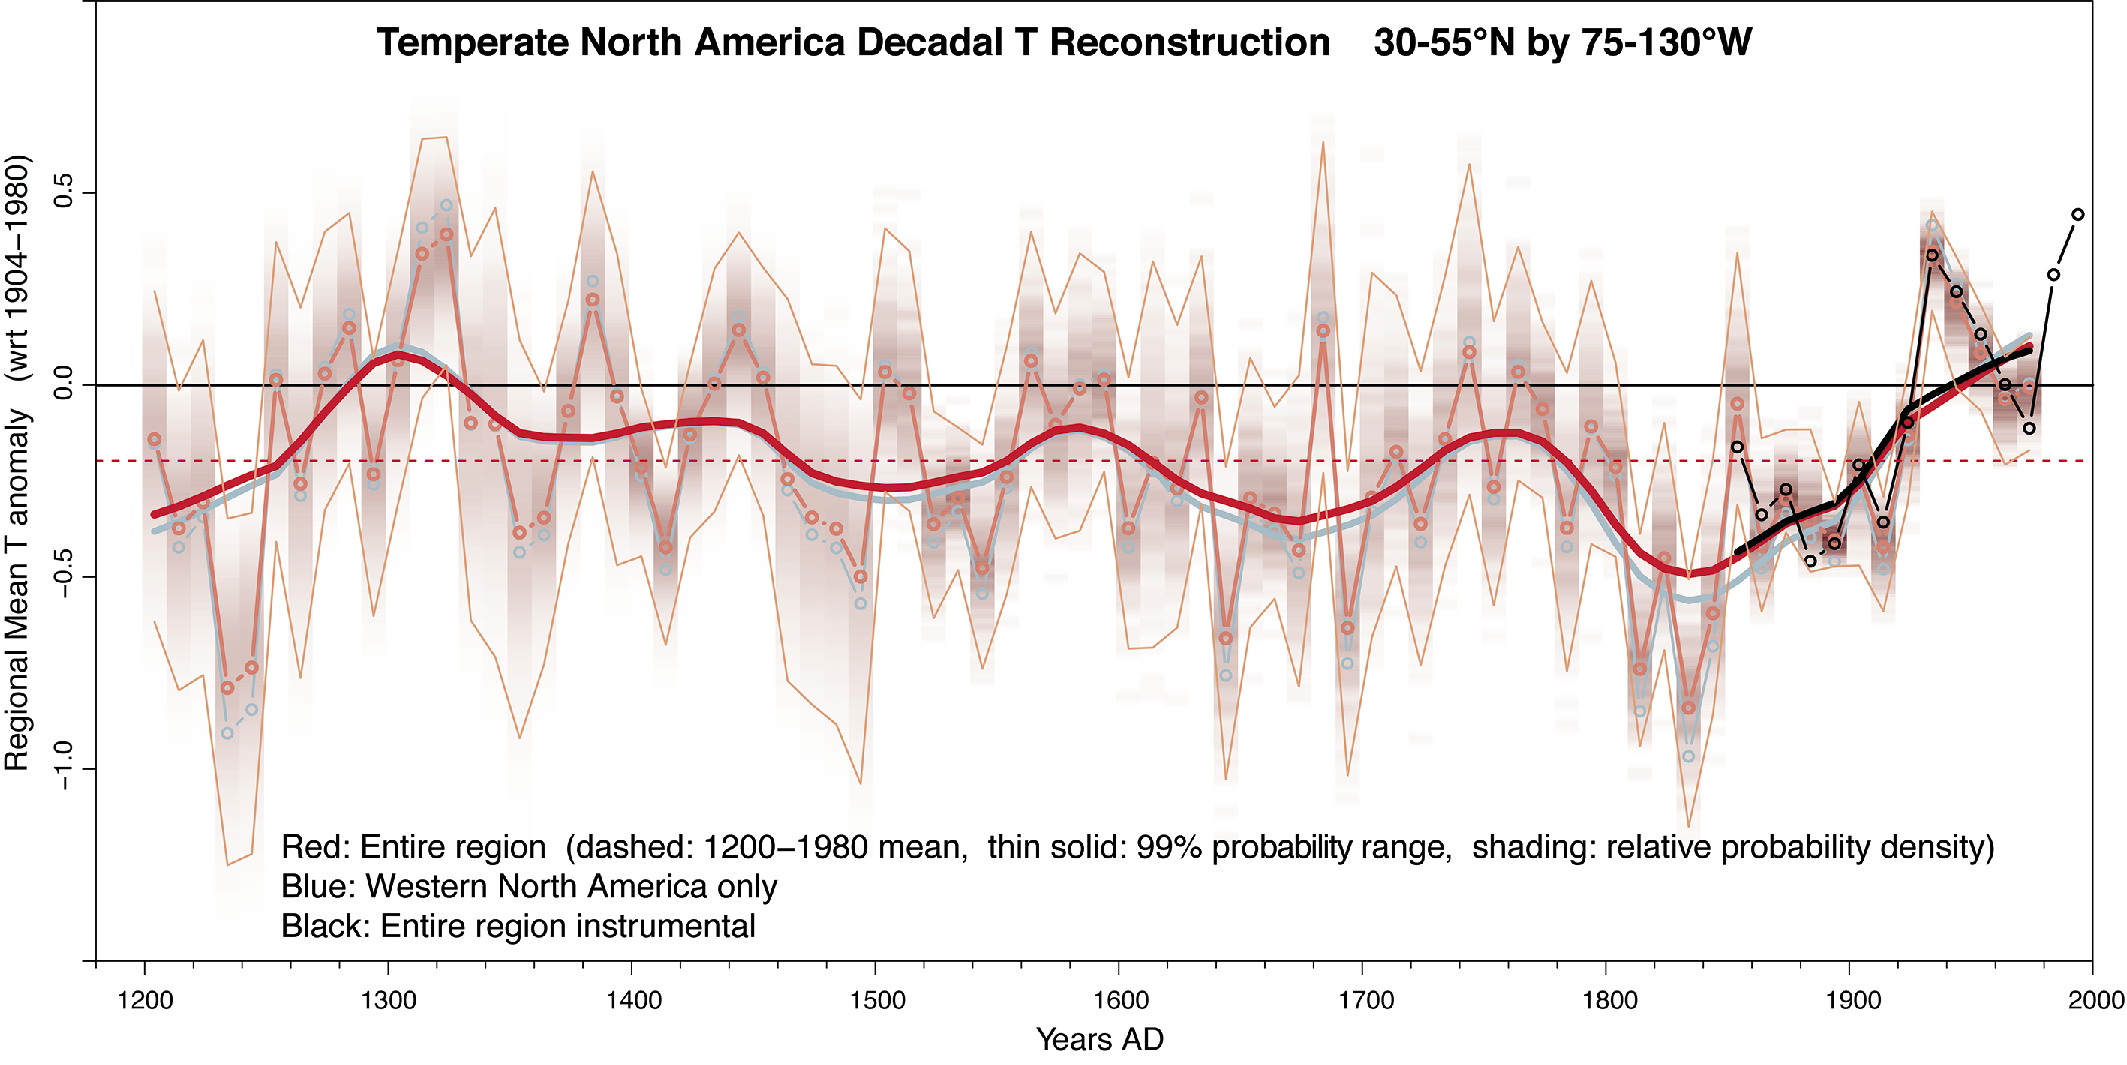
Similar to other reconstructions that use sequential calibrations going back in time, the longer time series (1200-on), while well validated, exhibits lower skill than the shorter WS12 reconstruction. WS12 exhibits validation grid-scale RE/spatial-mean RE/spatial-mean CE of 0.40/0.62/0.42, respectively, while the 1200-on reconstruction exhibits 0.13/0.53/0.31 for the same measures, respectively. We thus used WS12 as the reconstruction for 1500-1980 AD and joined the 1200-on reconstruction to it to cover the period 1200-1499 AD. To ensure comparability across the splice at 1500 AD, we regressed WS12 onto the 1200-on reconstruction over the 1500-1980 AD period, and then used this regression and the 1200-on reconstructed values to fit WS12-consistent values for the western region spatial mean during 1200-1499 AD. Decadal averages of this common 1200-1980 AD western temperate-reconstruction were then used as predictors in a calibration against instrumental decadal averages of annual temperatures over the larger mid-latitude domain 30°-55°N, 75°-130°W, for a period covering 1850-1980 AD (n=13, using the infilled instrumental data set of Mann et al. 2009). Finally, this calibration fit was used to reconstruct decadal averages of annual temperature over the larger domain for the entire 1200-1980 AD period (n=78). In both regressions, the fitted values were scaled so that their variance matched that of the target data during the fitting period. The results are shown in Figure 1; the red (blue) curves give the full (western) North American expected value (EV) reconstructions, and the black curve shows the 1850-2000 AD full North American instrumental values.
 |
|
Figure 1: Reconstruction of annual mean temperature deviations from a 1904-1980 AD average (thin black line) for North America (30°-55°N, 75°-130°W). Values shown are decadal means and a lowess filter to highlight low frequency fluctuations. The average for the full period of record (1200-1980 AD) for the entire region is shown as a dotted red line, variable shading gives relative probability density for each decadal value, thin red envelope lines denote 99% probability range associated with each decadal mean value. |
Uncertainty estimation was done using the uncertainty ensembles generated for both the WS12 and the 1200-on reconstructions (see Wahl and Smerdon 2012 for the statistical bootstrap method used) in a two-way Monte Carlo design. In this design, the process described above to estimate the EV reconstructions was repeated for each possible combination of 500 WS12 and 500 1200-on ensemble members. The 99% probability range estimated by this analysis (from the 0.005 and 0.995 quantiles of the MC output) is shown by the thin solid red line in Figure 1. Note that these 99% ranges are for the decadal means and thus are significantly narrower than the corresponding ranges for annual values would be expected to be, from theory of the standard error of the mean.
Several side-by-side comparisons of the tree-ring derived reconstruction with observations were done to investigate its ability to reproduce the large-scale patterns of change on decadal and multi-decadal time scales. The comparisons (not shown) indicate that the western North America-based reconstruction captures the primary features of temporal variability during the instrumental period, along with many sub-regional spatial features such as warming in the interior Southwest associated with the 1950s drought, and also likely captures decadal variability over the larger continental region east to 75°W. Additionally, the reconstruction was compared against lake-sediment pollen temperature reconstructions for the Upper Midwest and eastern portion of the mid-North American continent (Wahl et al. 2012; Viau et al. 2012; Trouet et al., this issue). We find general agreement between the results shown here and the bulk of the regional temperature reconstructions reported in these pollen-based studies.
There have been relatively few reconstruction studies of long-term North American temperature compared to precipitation or related drought indices (e.g. Cook et al. 1999, 2007). We single out two recent articles (Kaufman et al. 2009; Ljunqvist et al. 2012) that present millennial length reconstructions for portions of the Northern Hemisphere, since they include some information regarding North American temperature changes. A direct comparison between these reconstructions and that of Figure 1 is not possible however, because of differing reference periods and data sources on the one hand (Ljunqvist et al. 2012) and a pan-Arctic regional focus on the other (Kaufmann et al. 2009). Nevertheless, some similarities are evident, particularly the cold periods of the 17th and 19th centuries, and warmer temperatures prevailing prior to the 15th century.
affiliations
1National Climactic Data Center, National Oceanic and Atmospheric Administration, Boulder, USA; Eugene.R.Wahlnoaa.gov
2Cooperative Institute for Research in Environmental Science, University of Colorado, Boulder, USA
3Laboratory of Tree-Ring Research, University of Arizona, Tucson, USA
4Tree-Ring Lab, Lamont-Doherty Earth Observatory, Palisades, USA
selected references
Full reference list online under: http://pastglobalchanges.org/products/newsletters/ref2012_2.pdf
Kaufmann DS et al. (2009) Science 325: 1236-1239
Ljunqvist FC, Krusic PJ, Brattström G, Sundqvist HS (2012) Climate of the Past 8: 227-249
Viau AE, Ladd M, Gajewski K (2012) Global and Planetary Change 84-85: 75-83
Wahl EW, Diaz HF, Ohlwein C (2012) Global and Planetary Change 84-85: 66-74
Wahl ER, Smerdon JE (2012) Geophysical Research Letters 39, doi: 10.1029/2012GL051086