PAGES Magazine articles
Valerie Trouet1, H.F. Diaz2, A.E. Viau3, E.R. Wahl4
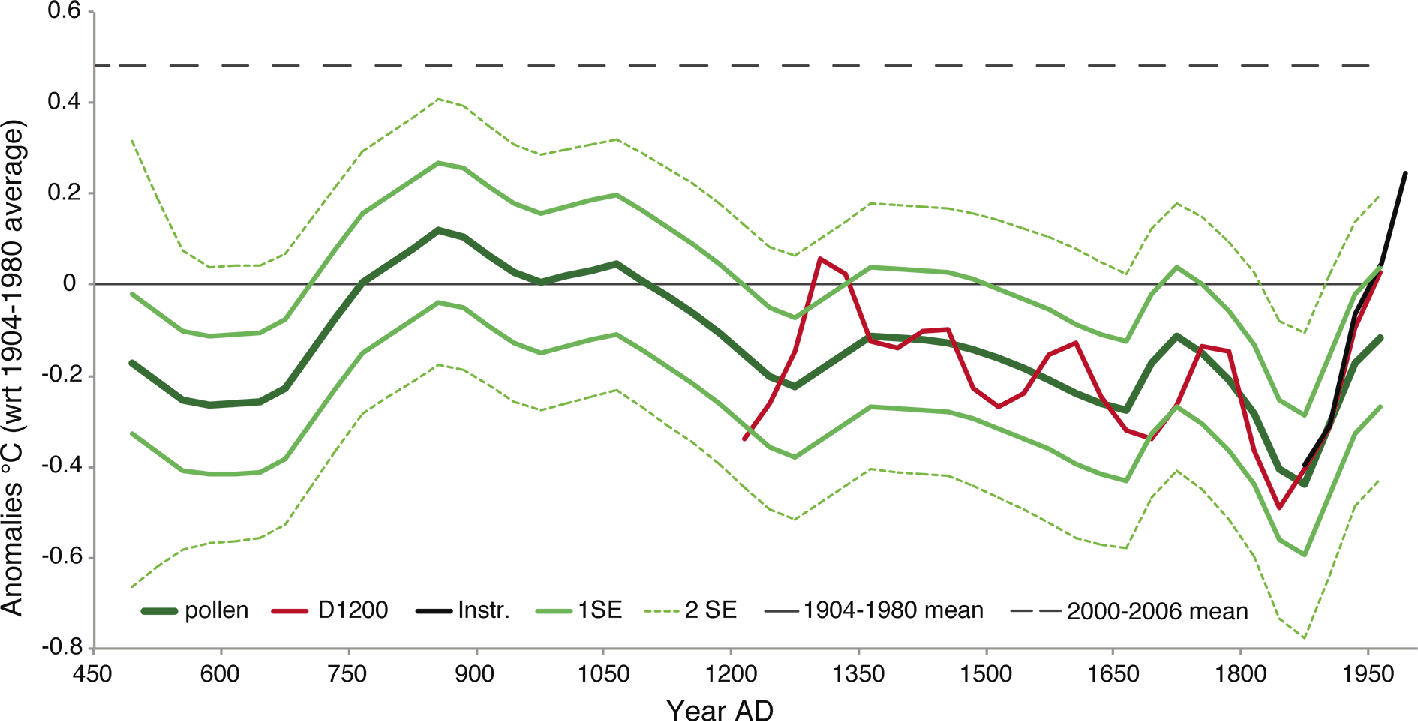
We present a tree-ring and pollen based mean annual temperature reconstruction for temperate North America (480-1980 AD) that shows two prominent low-frequency periods: the warmer Medieval Climate Anomaly (750-1100 AD) and the cooler Little Ice Age (1300-1850 AD).
The PAGES 2k Network initiative aims to reconstruct climate variables for the last 2000 years. In a parallel effort, the NAM2K group produced an 800-year (1200-1980 AD) decadal scale annual mean temperature reconstruction using a network of tree-ring records in western North America (Wahl et al. 2012a, this issue; Wahl and Smerdon 2012). That reconstruction is referred to henceforth as D1200 (for decadal 1200). Here we present a pollen-based 30-year resolution mean annual temperature reconstruction for the temperate region of North America (30˚-55˚N, 95˚-130˚W) extending D1200 back to 480 AD. In the following, we describe the methodology used for this reconstruction and briefly compare it with other regional temperature reconstructions.
We performed a principal component analysis (PCA) using four North American regional pollen-based temperature reconstructions (Viau et al. 2012); specifically those based on pollen sequences from deciduous, hardwood, boreal, and mountain ecoregions of North America. The prairie ecoregion reconstruction for the center of Northern America was not used as its vegetation is mainly controlled by precipitation (Viau et al. 2012). Mean annual temperature reconstructions were used instead of summer temperature anomalies as in Viau et al. (2012) for a more direct comparison of the pollen reconstructions to D1200. The resulting 30-year PCA scores (360-1950 AD; n=54) were then included in a stepwise multiple linear regression against the D1200 curve. For this purpose, D1200 was smoothed using a ~110 year lowess filter and sampled every 30 years to conform with the time scale and sampling resolution of the pollen-based reconstructions. Three combined PC axes explaining 87% of the common variance in the pollen reconstructions were retained in the stepwise regression and explained 33.4% of the variance (corrected for autocorrelation) in D1200.
Uncertainty was estimated based on the 1 and 2 standard error (SE) limits for the pollen-based reconstructions and the SE of the regression model. The SEs for the pollen-based reconstructions were developed using a Monte Carlo resampling technique that generated random sequences by sampling values at each time step of the individual pollen series within each series' uncertainty limits. This process was repeated 10,000 times to generate the pollen-based reconstruction uncertainty bands. These were then inputted into the previously developed PCA and multiple linear regression equations to determine the component of the overall 1SE and 2SE uncertainty limits that is inherent in the pollen-based reconstruction method. The pollen-based reconstruction 1SE and 2SE limits estimated in this manner were augmented with the corresponding regression 1SE and 2SE values at each time step, by adding the squares of the errors and taking the square root of the sum. Because estimated uncertainties were unrealistically high prior to 480 AD, we truncated our temperature reconstruction at this date.
 |
|
Figure 1: Reconstruction (dark green curve) of 30-year averages of annual mean temperature deviations from a 1904-1980 AD average for North America (30˚-55˚N, 75˚-130˚W). Values shown correspond to the combination of three pollen-reconstruction PCs resulting from a stepwise multiple linear regression with the 30-year-subsampled RC temperature series (red curve), and thus reflects low frequency variations. Dashed (full) light green lines give 2SE (1SE) uncertainty estimations associated with each 30-year value. Full black curve shows comparably smoothed instrumental temperature values. Dotted black line represents the average deviation for the period 2000-2006 AD, also from comparably smoothed instrumental data. |
Comparison between D1200 and the pollen reconstruction is quite reasonable (Fig. 1). Except for a peak around 1300 AD, the smoothed D1200 falls nearly entirely within the 1SE uncertainty envelope. The overall amplitude of change for the entire period is ~±0.55°C and thus falls within the range of amplitudes found for hemispheric-scale temperature reconstructions over the last millennium (0.4-1°C, see Esper et al. 2012). The start date of our reconstruction is too recent to capture warmth during Roman times (0-400 AD) and this is likely one of the reasons why a millennium-scale cooling trend, caused by orbital forcing, is not as evident as in high-latitude temperature reconstructions for the same period (Kaufman et al. 2009; Esper et al. 2012).
There are three prominent low-frequency periods in the North American extended reconstruction, notably the cooler Dark Ages (ca. 500-700 AD), Little Ice Age (ca. 1300-1850 AD), and warmer Medieval Climate Anomaly (MCA; see also Wahl et al. 2012b). Our results show that the MCA, here between ca. 750 and 1100 AD, was slightly warmer than the baseline period (1904-1980 AD), but much cooler than the early 21st century (Fig. 1). The MCA shows peaks around 850 and 1050 AD. Following the MCA, mean annual temperatures decreased until the mid-19th century, after which temperature began to increase rapidly. Our reconstruction shows similarities with other long temperature reconstructions, not only at the centennial scale (e.g. cold Dark Ages in Büntgen et al. 2011), but also at the decadal scale. Warmth in the mid-11th century and cool 17th and 19th centuries, in particular, are well replicated in multiple hemispheric-scale temperature reconstructions (e.g. Frank et al. 2010; Mann et al. 2009; Moberg et al. 2005).
affiliations
1Laboratory of Tree-Ring Research, University of Arizona, Tucson, USA; trouet email.arizona.edu
2Cooperative Institute for Research in Environmental Sciences, University of Colorado, Boulder, USA
3Department of Geography, University of Ottawa, Canada
4National Climatic Data Center, National Oceanic and Atmospheric Administration, Boulder, USA
selected references
Full reference list online under: http://pastglobalchanges.org/products/newsletters/ref2012_2.pdf
Esper J et al. (2012) Nature Climate Change, doi: doi:10.1038/nclimate1589
Kaufman DS et al. (2009) Science 325: 1236-1239
Viau AE, Ladd M, Gajewski K (2012) Global and Planetary Change 84-85: 75-83
Wahl EW, Diaz HF, Trouet V, Cook ER (2012a) PAGES News 20(2): 86-87
Wahl ER, Smerdon JE (2012) Geophysical Research Letters 39, doi: 10.1029/2012GL051086
Thorsten Kiefer
Change is on the way for Global Environmental Change
 |
You may have heard some buzz around an initiative called Future Earth. The project, in the works since 2009, will affect all Global Change scientists, and is expected to become operational over the next 1-2 years.
Future Earth is expected to give Global Environmental Change (GEC) science a total makeover, by unifying existing programs and removing disciplinary boundaries, ultimately creating more streamlined communication and cooperation across the broad range of GEC disciplines.
An alliance of several organizations—jointly representing international cooperation, education, and GEC science funding—is behind Future Earth. The program will unify three of the four existing GEC programs, namely the International Human Dimensions Programme (IHDP), DIVERSITAS, and PAGES’ parent organization, the International Geosphere-Biosphere Programme (IGBP). The fourth GEC program, the World Climate Research Programme (WCRP), will be associated with Future Earth while remaining a separate entity.
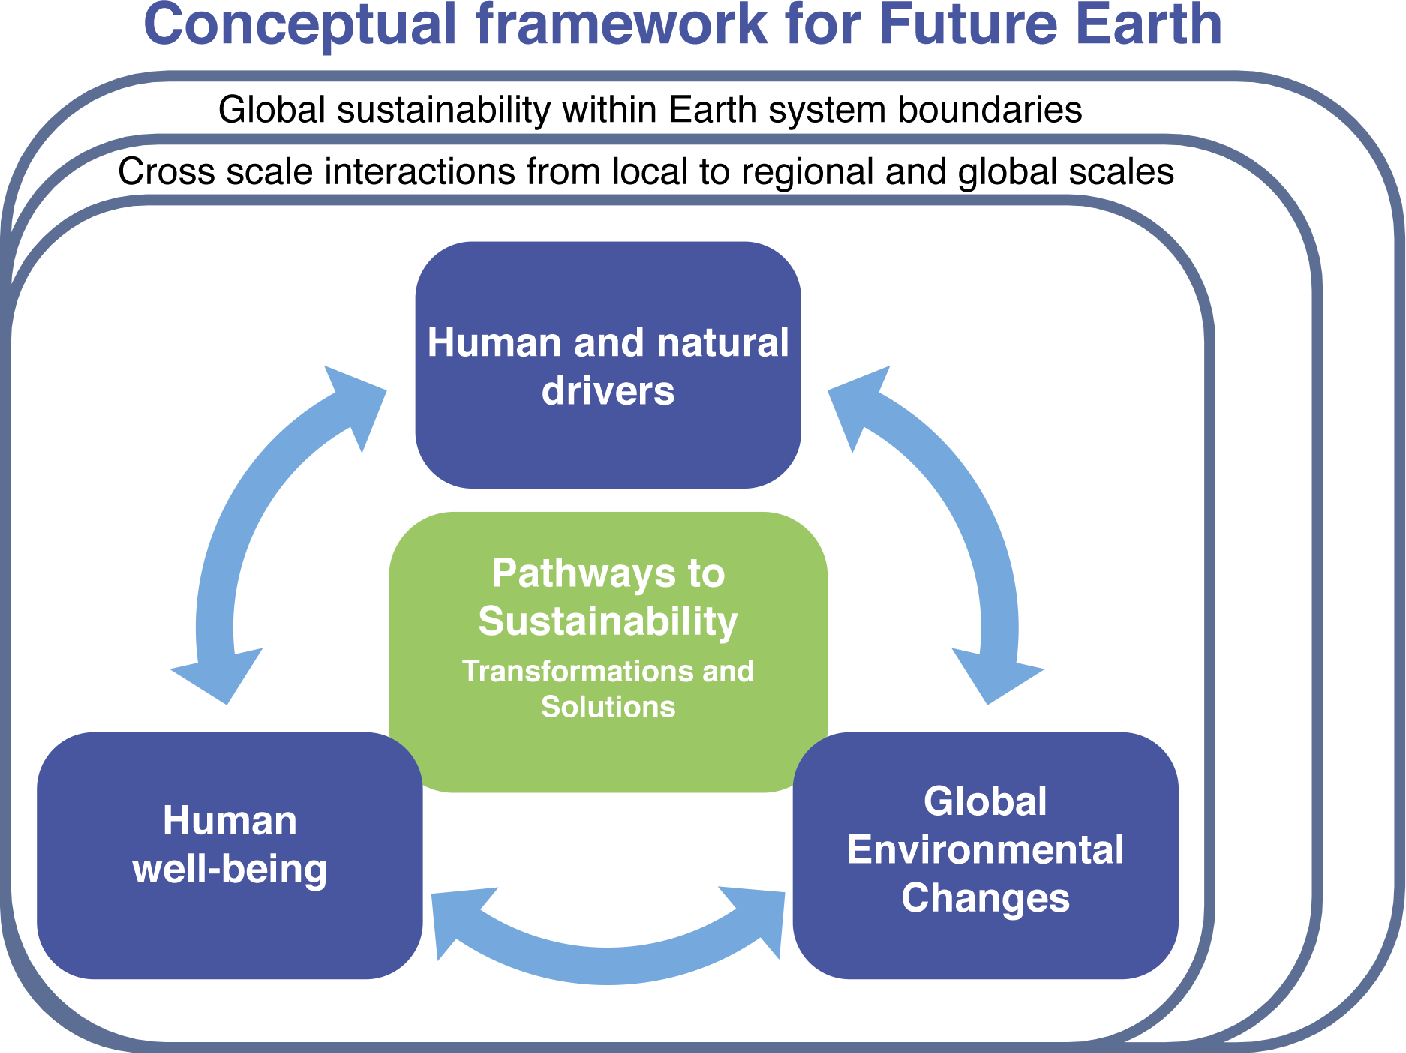
The program’s full name, "Future Earth– research for global sustainability", indicates that it is more than a mere merger of program themes, however. Future Earth activities will be expected to contribute to finding solutions toward challenges that societies face as a direct or indirect consequence of environmental change. (See Figure 1 for a visual illustration of these goals.)
Achieving this will require lively communication between the producers and users of scientific knowledge, i.e. between scientists and stakeholders. Thus, Future Earth is set to involve not only a broad spectrum of scientists, but also of stakeholders, from policy-makers to those in industry. The idea is to invite stakeholders to co-design research agendas and to even co-produce knowledge. By bringing together natural and social sciences, humanities, economics, and technology development, Future Earth aims at a broadly interdisciplinary and inclusive effort, better suited for effectively tackling interconnected and multifaceted problems.
Future Earth at Present
So far, a task force group (Transition Team) has been set up, which has drafted frameworks for the research and for the structural organization of Future Earth. While still subject to modifications, the current version of the research framework contains three broad themes:
(1) Dynamic Planet: Observing, explaining, understanding, projecting Earth, environmental and societal system trends, drivers and processes and their interactions; anticipating global thresholds and risks.
(2) Global Development: Providing the knowledge for sustainable, secure, and fair stewardship of food, water, biodiversity, health, energy, materials, and other ecosystem functions and services.
(3) Transformation toward Sustainability: Understanding transformation processes and options, assessing how these relate to human values, emerging technologies and economic development pathways, and evaluating strategies for governing and managing the global environment across sectors and scales.
Future Earth and PAGES
PAGES has provided occasional input to Future Earth’s development in several ways. Given that Paleoscience can obviously contribute a lot to Theme 1, and to some aspects of Theme 2, PAGES has provided the Future Earth Transition Team with two “Past lessons” essays that explain how paleoscience can contribute generally to climatic and environmental themes. These essays can be downloaded from the PAGES website (Products > Other).
Additionally, the PAGES Scientific Steering Committee has put forward several requests to developers of Future Earth: To make sure that existing communities and expertise are maintained, to commit to basic science, to complement disciplinary science with a well-funded platform for interdisciplinary science, to provide professional science communication, and to adopt long-term and historical/geological observations as part of their observation strategy.
The shifting framework of GEC science is prompting associated communities and organizations to revisit their agendas and strategies. For PAGES, the upcoming Open Science Meeting titled "The Past: A Compass for Future Earth" will serve as a platform to discuss the opportunities and challenges Future Earth could bring to paleoscientific research, and how PAGES can help to make best use of the opportunities while mastering the challenges.
This Program News article provides only a brief introduction to Future Earth. For more detailed information, please visit the Future Earth website at: http://futureearth.org/
affiliation
PAGES (Past Global Changes) International Project Office, Bern, Switzerland; thorsten.kieferpages.unibe.ch
Eric Wolff1, A. de Vernal2 and R. Gersonde3 (co-chairs of the SIP WG)
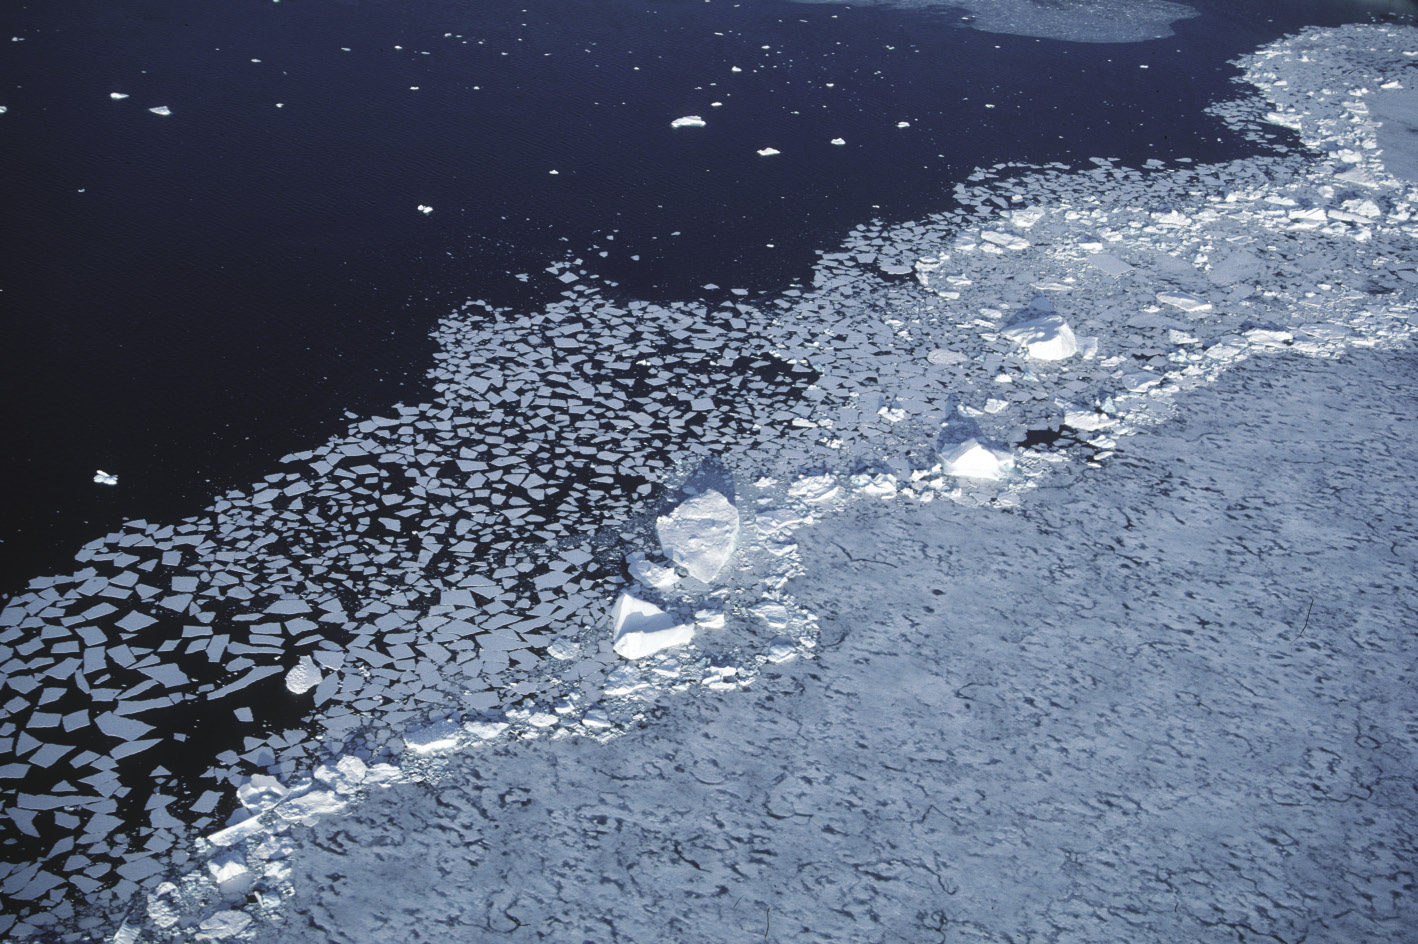
Figure 1: The edge of the pack ice in the Weddell Sea. Photo by P. Bucktrout (British Antarctic Survey, UK).
The sea ice is a crucial component of the polar climate system, and has an impact on albedo, heat and gas exchange, primary productivity and carbon export, atmospheric and ocean circulation, freshwater budget, ocean stratification, and deep water mass formation. It is therefore critical that it is correctly specified as a forcing or predicted as a feedback in modeling studies.
However, full and reliable knowledge (through satellite observation) of the area and seasonal variability of sea ice extends only to 1978. Some earlier observational data are available, but their coverage is patchy and their reliability uncertain. Proxy data are therefore critical for extending the sea-ice record to the geological past, to improve understanding of the interplay between sea ice and the climate system over a broad range of conditions.
Apart from the more intermittent (such as occurrence of terrigenous components, driftwood or whalebone) or indirect (inference of climate and hence sea ice from terrestrial data) methods, the most important sea-ice proxies are derived from marine sediments and ice cores. In the marine records, proxies such as diatom or dinoflagellate cyst assemblages and organic biomarker occurrence have been used. In ice cores, sea salt and methanesulfonic acid have been proposed as chemical proxies. However, there are uncertainties on the reliability of each proxy, and insufficient knowledge of the modern processes that control them.
PAGES has therefore set up the Sea Ice Proxies (SIP) Working Group with the objective to critically assess and compare the different proxies for sea ice, in order to make recommendations on their reliability and applicability in the Arctic and Antarctic. An extended objective will be to facilitate the production of new synthesis estimates of past sea-ice extent based on the assessed proxies.
In the Southern Hemisphere most sea-ice extent estimates from marine sediments are based on diatom assemblages from marine sediments, but different methods and species are considered and a new biomarker-based proxy (similar to the isoprenoid biomarker IP25 used in the Arctic) is under development.
In the Arctic Ocean and subarctic seas, a wide range of proxies is used in marine cores, including the occurrence of particular diatoms, dinoflagellate cysts, foraminifera and ostracodes; more recently the concentration of IP25 has become a popular proxy. In ice cores, both methanesulfonic acid and sea salt sodium have been proposed as sea ice indicators.
Goals of this WG
(i) To assess each proxy individually: What is the physical, chemical and biological basis for its use? What is the sea-ice related parameter for which it may permit reconstruction? How has it been calibrated and how robust and stationary is that calibration? In what geographical and temporal range is the proxy reliable?
(ii) Where different proxies are available, to inter-compare their findings and develop a strategy for multi-proxy compilation and reconstructions.
(iii) To prepare recommendations on proxies suitable for making robust estimates of past sea ice conditions.
These methodological aspects will make up the majority of the work of the Working Group. However we will work with existing projects such as the EU Past4Future to deliver new synthesis estimates of past sea-ice extent for key time periods.
A first workshop was held at GEOTOP in Montreal, Canada in March 2012 and a separate report will be submitted summarizing that. It was aimed mainly at assessing the significance of each proxy and addressing the questions in paragraph (i) above.
A second workshop will be held in Cambridge (UK) in 2013.
affiliations
1British Antarctic Survey, Cambridge, UK; ewwobas.ac.uk
2GEOTOP, Université de Québec à Montréal, Canada
3Geosciences, Alfred-Wegener-Institute for Polar & Marine Research, Bremerhaven, Germany
Jürg Beer
 |
|
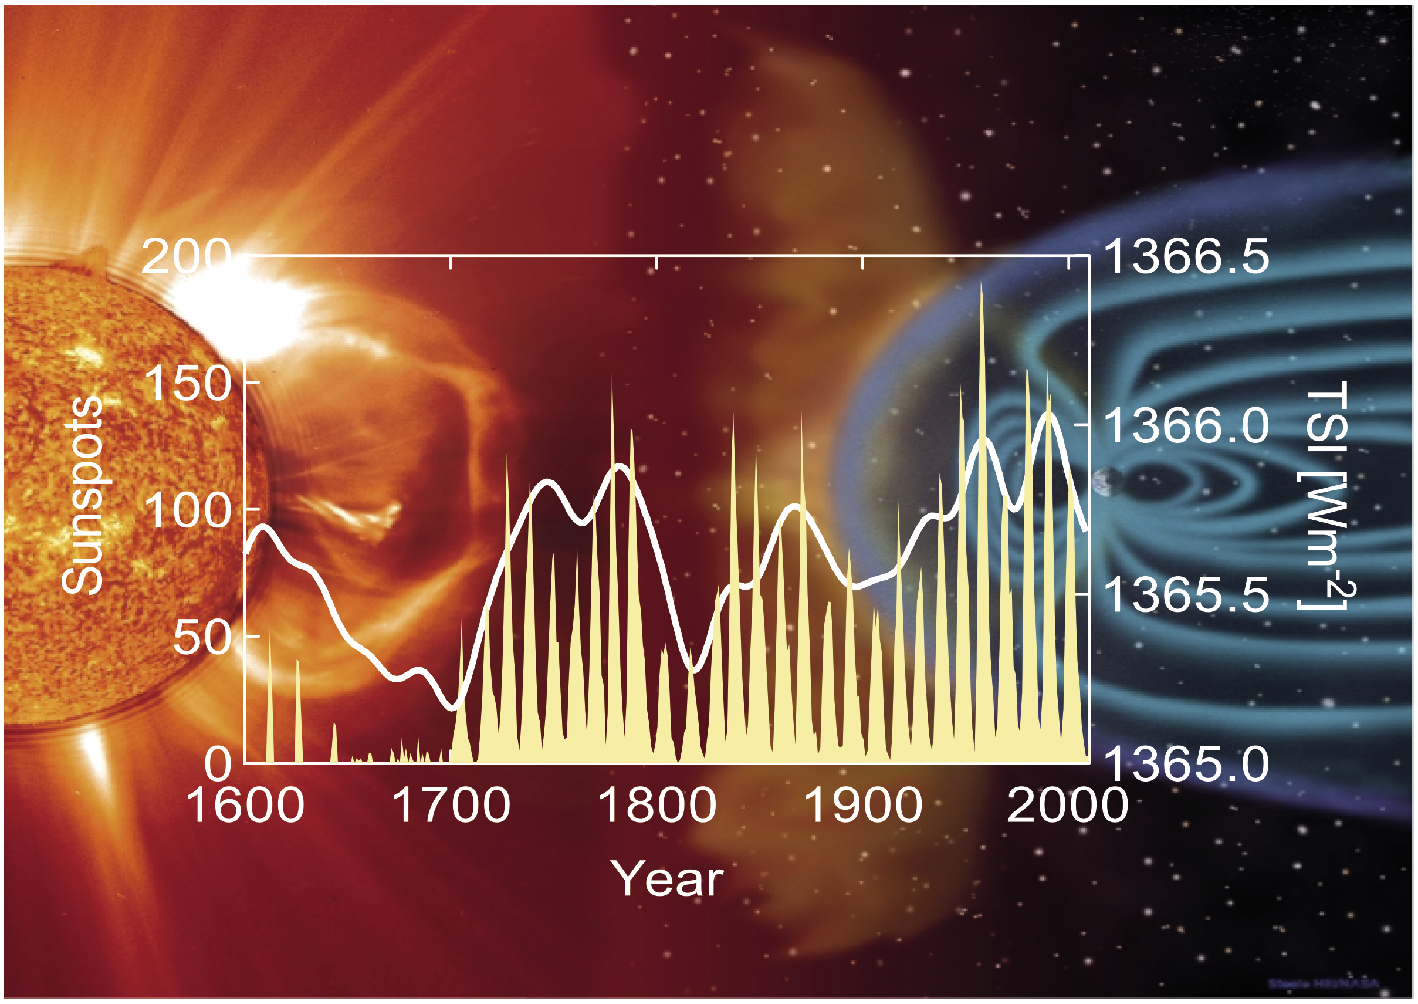
Figure 1: Background picture - The Sun emitting electromagnetic radiation and hot plasma (solar wind) carrying magnetic fields. While the radiation reaches the Earth directly solar particles are partly shielded by the geomagnetic field. Graph - Sunspot numbers reflect the solar magnetic activity which is dominated by the 11-year Schwabe cycle. The reconstructed smoothed total solar irradiance (TSI) follows the envelope of the sunspot record with minima at 1645-1715 AD (Maunder Minimum) and at 1790-1830 AD (Dalton Minimum) and a maximum in the second half of the 20th century. |
The Sun is the main driver of the climate system. However, its contribution to climate change is still highly uncertain despite the considerable scientific advances made in recent years. A large number of new paleoclimate records with high temporal resolution have been produced. Simultaneously, high precision measurements of the solar total (TSI) and spectral (SSI) irradiance have been performed using satellite bound radiation monitors. Attempts have been made to use proxies of solar activity to extend the instrumental records of TSI and SSI back in time for the past 10 ka. In order to link the solar forcing with the observed climate response, climate models have been improved to simulate dynamical couplings between stratosphere and troposphere, the effect of UV changes on the ozone, and the influence of solar energetic particles and cosmic rays on the upper atmospheric chemistry (Gray et al. 2010; Wanner et al. 2008).
In spite of these significant efforts many open questions remain; some of which will be addressed by the new PAGES working group on solar forcing.
Calibration of the instrumental TSI record
Since 1978 TSI is continuously measured most of the time simultaneously by several instruments on different satellites. Different research groups applying different corrections produced at least three different TSI composites with significant discrepancies. A new instrument points to a mean TSI that is about 5 Wm-2 lower than the often-assumed value of 1365 Wm-2. Nevertheless, simple semi-empirical models of TSI are capable of reproducing the observed annual and shorter changes. However, the physical mechanisms that relate solar activity with TSI and SSI changes are still not well understood.
Past role of solar forcing
Even larger discrepancies exist between the long-term reconstructions that are based on proxy data such as cosmogenic radionuclides. These nuclides are produced by cosmic rays in the atmosphere and stored in polar ice (10Be) and tree rings (14C). Their production rate is to a large extent modulated by solar activity. However, the geomagnetic field intensity and the transport from the atmosphere into the archive also play a role. The main problem is that these proxies need to be calibrated by the instrumental TSI data, which besides their own uncertainties only cover 30 years of high and relatively constant solar activity (grand maximum). The instrumental record is therefore not representative of the mean global solar activity of the Holocene. This raises the fundamental question of how much lower TSI and SSI were during grand solar minima such as the Maunder Minimum. There is general agreement on the shape of the past solar forcing record, which is characterized by specific cycles of 11, 87, 208 and 500 years and prolonged periods of solar minima (e.g. Maunder) and maxima. However, there is still considerable uncertainty regarding the amplitudes of these changes.
The solar cycle minimum of 2008
The 2008 solar minimum was lower (fewer sunspots, lower TSI) and lasted longer than previous ones. Are the current TSI models capable of explaining it? Does it point to an imminent new grand minimum?
Future role of solar forcing
The fact that the past six decades or so were a period of very high solar activity suggests that solar activity will decrease in the near future. This expectation is corroborated by the last solar minimum of 2008. The possibility of an imminent new grand solar minimum has led to claims that the diminished solar activity will reduce global warming considerably. Although this is very unlikely, a solid quantitative estimate of such a scenario is very important.
To address all these questions an interdisciplinary working group has been set up (http://pastglobalchanges.org/science/wg/former/solar-forcing/intro). Solar physicists try to better understand the known physical processes and to identify potential new mechanisms responsible for solar forcing. Experts in atmospheric physics and climatology address the response of the Earth system to the solar forcing and in particular the effects of solar induced changes in the upper atmosphere on the climate. Paleoclimatologists provide observational data, which need to be explained by climate modelers complementing their models with additional processes and putting some important constraints on the role the Sun has played in the past and will possibly play in the future.
affiliation
Swiss Federal Institute of Aquatic Science and Technology, Dübendorf, Switzerland; juerg.beereawag.ch
references
Gray LJ et al. (2010) Reviews of Geophysics 48, doi: 10.1029/2009RG000282
Wanner H et al. (2008) Quaternary Science Reviews 27: 1791-1828
Sami Hanhijärvi
Department of Environmental Sciences, University of Helsinki, Finland; sami.hanhijarvihelsinki.fi
Helsinki, Finland, 15-16 November 2011
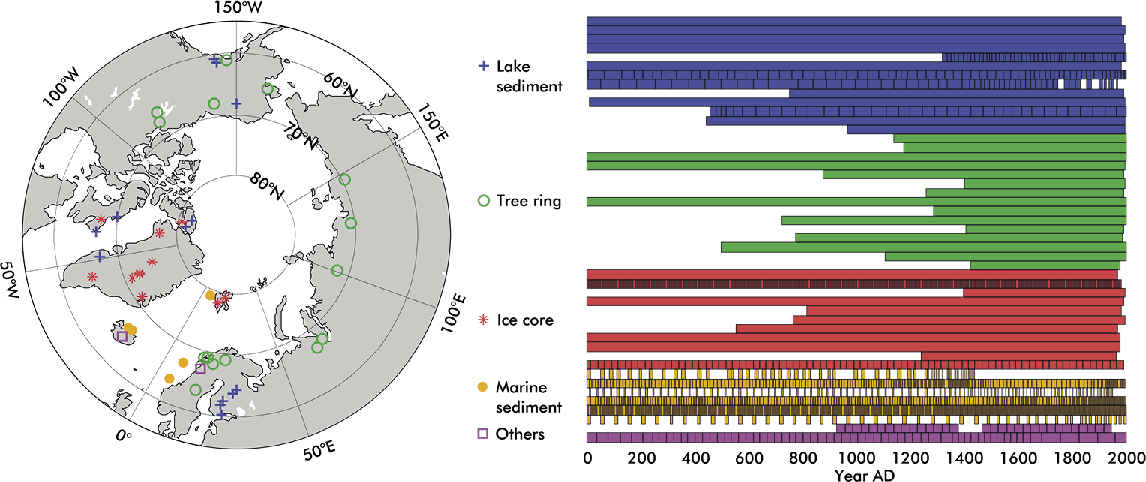
The Arctic2k Working Group aims at elucidating the variability of the arctic climate in the past to provide a reference context for the recent rapid warming in the region. Thirteen Working Group members attended the workshop, reviewed the collected proxy records and the preliminary temperature reconstructions made thereof, and prepared the groundwork for a publication on results and methods.
 |
|
Figure 1: Spatial and temporal distribution of the Arctic2k proxy records. Single solid box in temporal extent signifies annual resolution. Otherwise, each box represents the time frame of a single value of a single proxy record. Records have been truncated prior to 1 BC. All proxy series in this figure are or will be archived on the NOAA paleoclimatology database. |
While the arctic region was found to feature many proxy records covering much of the area between 60° and 80° northern latitudes, records further north are virtually non-existent. When the collected records were subjected to the stringent selection criteria set in the previous Working Group workshop (Hanhijärvi 2011), the number of acceptable records was reduced by a large fraction. Furthermore, the temporal extent of the selected records is generally short, so that the coverage diminishes rapidly when going back in time. Figure 1 shows the spatial and temporal extent of proxy records used for the Arctic2k project. Both spatial and temporal sparsity had to be taken into account when carrying out the reconstructions.
The correlations between the gathered proxy record data were presented and analyzed, and the amount of shared signal between the records compared. The same procedure was repeated with the NASA GISS instrumental temperature station data (Hansen et al. 2006) and between the proxy records and instrumental data. The analyses displayed significant correlations between many of the records, indicating that the reconstructions will reflect a real climate behavior.
The proxy data are inherently heterogeneous and the records have different temporal resolutions. Interpolation was discussed and was shown to be a suboptimal solution for unifying the temporal resolution. Instead it was suggested that the proxy records are used in their original resolution while considering each sample (e.g. slice of a core) of a proxy record to represent a time frame, and to use reconstruction methods that can handle such data.
Two new methods, PaiCo (Pairwise Comparisons) and MuReMo (Multi-Resolution Monotonic), were presented, both of which can handle data of various resolutions in their original format. Furthermore, both methods use the assumption that the transfer functions from climate parameter to proxy are monotonic, instead of linear, unlike all other approaches. PaiCo is a new, yet unpublished method that can calculate the most likely common climate parameter time series from a collection of proxy records. MuReMo combines the idea of PaiCo with the Bayesian model of BARCAST (Tingley and Huybers 2010) to reconstruct spatiotemporal fields. The qualitative properties of these methods compare favorably with the existing methods, and will thus be used for calculating the climate reconstructions. Preliminary results were coherent with the existing knowledge about the arctic climate, and therefore considered promising.
The next research milestone of the working group is to finalize the reconstruction of the arctic temperatures during the past 2000 years. As Kaufmann et al. (2009) have already presented a similar reconstruction, it was decided that an important goal would also be the calculation of a spatial temperature field for the Arctic. This will build upon the previous knowledge and reveal spatial climate patterns.
references
Hanhijärvi S (2011) PAGES news 19(2): 73
Hansen J et al. (2006) PNAS 103: 14288-14293
Kaufmann DS et al. (2009) Science 325: 1236-1239
Tingley MP, Huybers P (2010) Journal of Climate 23: 2759-2781
Masaki Sano1, Shi Feng2, Takeshi Nakatsuka1 and Asia2k members
1Graduate School of Environmental Studies, Nagoya University, Japan; sano.masakib.mbox.nagoya-u.ac.jp
2Cold and Arid Regions Environmental and Engineering Research Institute, Chinese Academy of Sciences, China
Chiang Mai, Thailand, 9-11 January 2012
The 2nd Workshop of the PAGES Asia2k Working Group was attended by 21 paleoclimate researchers from Japan, China, USA, Russia, Switzerland, Sweden, Nepal, and Pakistan. The workshop aimed at (1) collecting proxy records that are not yet stored in any public repositories, (2) producing and discussing a preliminary reconstruction of annual temperature fields based on the available proxy records, and (3) conducting a methodological training course focused on statistical climate reconstruction techniques.
 |
|
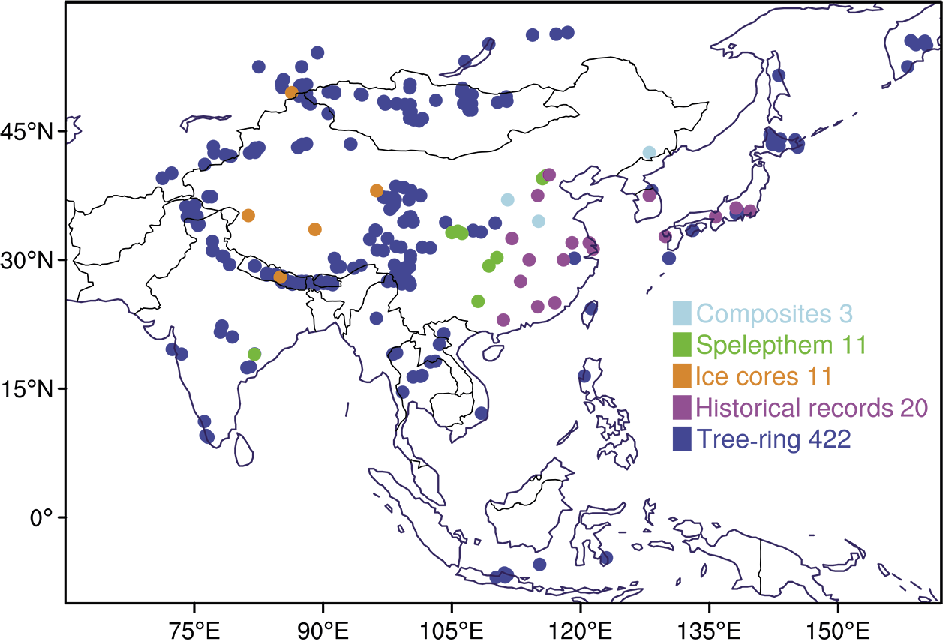
Figure 1: The locations, types and numbers of available proxy records considered by the Asia2k group. |
Asia2k committee member Edward Cook (Lamont-Doherty Earth Observatory, USA) gave an introduction to the temperature field reconstruction methods, followed by presentations from data holders who contributed their data to the workshop. While the Monsoon Asia Drought Atlas (MADA; Cook et al. 2010) derived from 327 tree-ring chronologies is currently the most extensive, high-temporal resolution reconstruction record available for Asia, a variety of new proxy records consisting of additional tree rings, ice cores, speleothems, lake sediments, and historical documents were contributed. The new records were incorporated into the Asia2k database along with the MADA series resulting in a total of 467 proxy records (Fig. 1).
A task group was assigned to produce a preliminary reconstruction of temperature fields. As shown in Figure 1, tree rings are the dominant proxy records in Asia. By incorporating the well-organized MADA procedures, a preliminary analysis using tree-ring records was created, including the newly contributed data. More specifically, a modified form of point-by-point regression (PPR), a well-tested and easily interpreted principal component regression method, was employed to produce past temperature fields.
The participants discussed all proxy records with an emphasis on climatic interpretation, seasonality, preservation of low- and high-frequency variability, and calibration/verification. The integration of time series of different resolution was also discussed, acknowledging that creating a multi-proxy reconstruction is undoubtedly a challenging task. In this regard, the Working Group agreed to produce a comprehensive reconstruction of temperature fields based on two different approaches. One approach is based solely on tree-ring data, to which a variety of methods is employed to reduce uncertainties and biases. The other approach also attempts to utilize several methods, but will also include non-annually resolved proxy records. Both analyses are conducted independently, making it possible to objectively compare and improve the final reconstruction products.
references
Jürg Luterbacher1, F.J. Gonzalez-Rouco2, D. McCarroll3, S. Wagner4 and E. Zorita4
1Department of Geography, University of Giessen, Germany; Juerg.luterbachergeogr.uni-giessen.de
2Department of Astrophysics and Atmospheric Sciences and Instituto de Geociencias UCM-CSIC (IGEO), Complutense University, Madrid, Spain
3Department of Geography, Swansea University, UK
4Helmholtz Center for Materials and Coastal Research, Geesthacht, Germany
2nd Meeting of the PAGES Euro-Med2k Working Group – Hamburg, Germany, 21-23 May 2012
 |
|
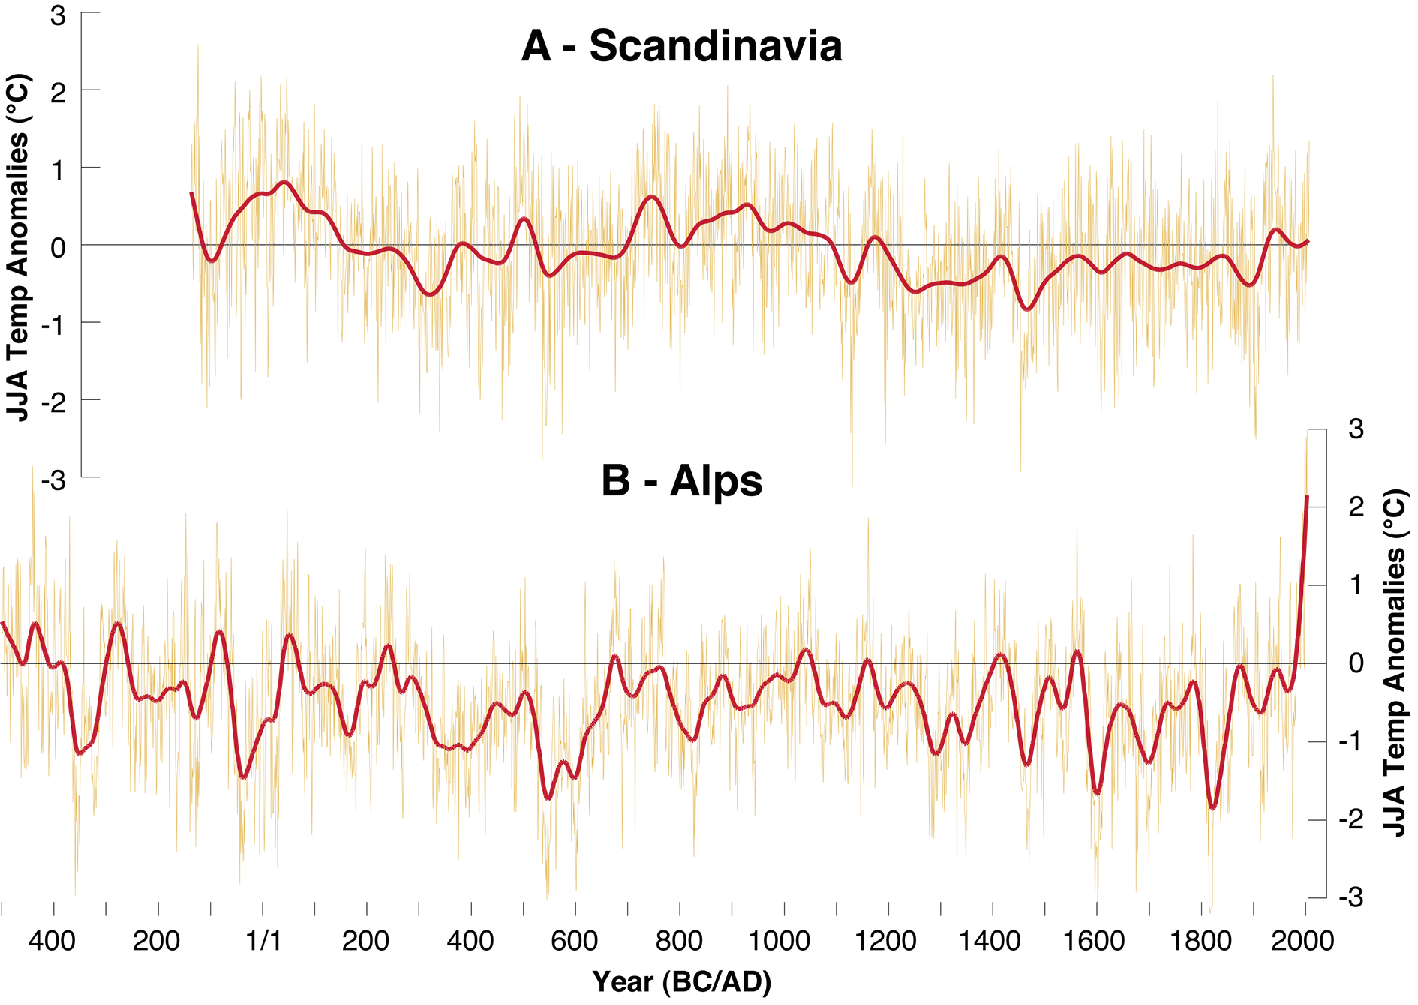
Figure 1: Reconstructed 2000 years of Northern Scandinavian (A) and Alpine (B) summer temperatures based on tree-ring data (Büntgen et al. 2011; Esper et al. 2012) |
The PAGES Euro-Med2k Working Group was initiated to reconstruct and analyze the climate of the European/Mediterranean region within the past 2000 years. To date, the Working Group’s efforts have been focused on collecting proxies with high spatio-temporal resolution from natural and documentary archives. This meeting was attended by 20 participants and focused on discussing new proxy evidence for summer temperatures in the Euro-Med region, with annual resolution and continuous sampling over time. Eleven annually-resolved tree-ring chronologies that preserve low-frequency variability and documentary records from 10 European countries/regions were selected for the subsequent European scale reconstructions to be developed (Figure 1 shows the two longest series from the Alps and Northern Scandinavia; Büntgen et al. 2011; Esper et al. 2012).
During the second part of the meeting the strengths and weaknesses of different statistical methods to reconstruct temperature variations over the past 2000 years were discussed. Composite-Plus-Scaling (CPS) and Bayesian Hierarchical Modeling (BHM) were considered as options for the mean European estimates and BHM for the gridded reconstructions over the last 1200 years. BHM has recently been proposed as a method suitable to overcome the known loss-of-variance problems of conventional multivariate statistical reconstruction methods (Tingley and Huybers 2010; Werner et al. 2012). One of the advantages of BHM is the possibility to form models for the underlying processes and the system response (instrumental measurements and proxies) and to assess different contributions to uncertainties. Discussions also included questions concerning the representation of low and high frequency variability in the proxy-based reconstructions, calibration/verification issues, uncertainty estimation, spatial dependence and autocorrelation. The third and final part of the workshop was devoted to discussing the approaches for model-data comparisons at continental scale. Results from a large multi-model archive, including simulations prior to Fernández-Donado et al. (2012) and those belonging to the CMIP5/PMIP3 initiative were considered.
The Group submitted peer-reviewed papers on two new European summer temperature reconstructions: a 2100 year CPS and BHM-based mean European and a 1200 year BHM-based gridded reconstruction. The workshop outputs will be used to address the extreme character of the recent decades in the context of the last two millennia and the comparisons of reconstructions with the ensemble of simulations for key climate periods related to the medieval period and the “Little Ice Age”. This will allow us to assess the degree of consistency between the mutually independent model and paleo proxy histories at regional scales, involving the ability of climate models to reproduce the continental summer temperature response to external forcings and to generate realistically the low-frequency internal variability at these spatial scales.
references
Büntgen U et al. (2011) Science 331: 578-582
Esper J et al. (2012) Nature Climate Change, doi: 10.1038/nclimate1589
Fernández-Donado L et al. (2012) Climate of the Past Discussions 8: 4003-4073
Tingley MP, Huybers P (2010) Journal of Climate 23: 2759-2781
Werner JP, Luterbacher J, Smerdon JE (2012) Journal of Climate, doi: 10.1175/jcli-d-12-00016.1
Bernd Zolitschka1, P. Francus2, A.E.K. Ojala3 and A. Schimmelmann4
1Institute of Geography, University of Bremen, Germany; zoliuni-bremen.de
2National Institute of Scientific Research, Québec, Canada
3Geological Survey of Finland, Espoo, Finland
4Department of Geological Sciences, Indiana University, Bloomington, USA
3rd Workshop of PAGES Varves Working Group, Manderscheid, Germany, 20-25 March 2012
 |
|
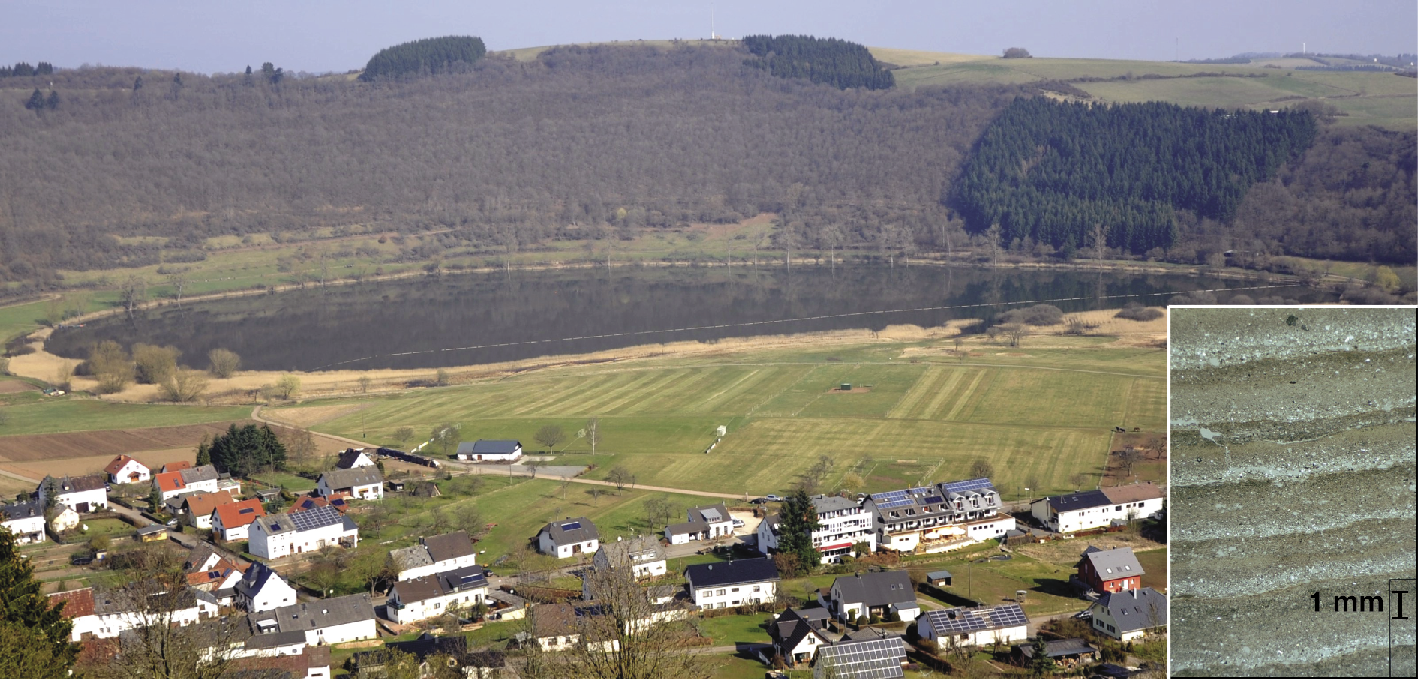
Figure 1: Lakes like Meerfelder Maar are important archives for climatic and environmental reconstructions since the Late-Glacial. The record of this site extends back into the Weichselian and provides a potential target for a future integrated lake deep drilling project. Most of the Holocene and Late Glacial sediments are annually laminated (varved). As an example the microphotography (inset) shows minerogenic varves of Younger Dryas age (courtesy A. Brauer). |
The workshop was hosted by the Maarmuseum in Manderscheid in the Eifel region, and was an opportunity for stimulating discussions amongst scientists active in analyzing annually laminated (varved) lacustrine and marine sediments for climatic and environmental reconstruction. Supporting funds were obtained from the German Science Foundation and PAGES. The Maarmuseum’s director Martin Koziol provided invaluable logistical support.
A diverse range of high-resolution archives from five continents and the marine realm was discussed. Forty-one scientists from 16 countries, including 16 early career scientists, represented a wide range of research fields including climate modelers, geophysicists, and biologists. This cross-disciplinary communication between data and model specialists was essential to understand relationships between climatic and environmental changes.
The workshop focused on deciphering climatic and environmental signals contained in varved sediments by applying complementary process-related studies. We learned from other scientific disciplines about alternative techniques for proxy development, calibration and validation. Additional foci were advances in studying varved records, identification of challenging new coring sites, and managing data.
The first session was devoted to the reconstruction of hydro-climatic events. In his keynote lecture Scott Lamoureux (Canada) presented long-term process studies at varved Arctic lake sites to demonstrate complex links between climatic forcing and sedimentological responses.
The second session’s focus was directed toward calibration of biological proxies. The keynote given by Andy Lotter (The Netherlands) highlighted the potential of biota-based transfer functions that provide enough temporal resolution to study the resilience and recovery time of ecosystems after external and internal disturbances.
Learning from other communities in terms of calibration and validation was the topic of the third session with three keynotes. Joel Guiot (France) presented the evolution of climate reconstruction methods from statistical techniques to complex model inversions and emphasized the need for high temporal resolution data as provided by varved records. The second keynote by Dominik Fleitmann (Switzerland) about speleothems directed the attention to annual growth bands of stalagmites and their paleoclimatic significance. Finally, keynote speaker Tom Swetnam (USA) linked dendrochronology with varved records pointing out the challenges obtained by combining both archives. Complemented by moderated poster and wrap-up sessions, the workshop was characterized by lively scientific discussions. Compiled abstracts of all talks and posters are available online (Zolitschka 2012).
The first product emerging from the VWG – a multi-authored article in Quaternary Science Reviews – relates to the worldwide distribution of varved records and the fidelity of their chronologies (Ojala et al. 2012). Discussions resulted in the plan to produce a second publication stressing the need for the development of best practice examples for varve counting applied to different varve types, including error estimations and corroboration by radiometric dating techniques and automated image analyzing methods for comparison. A different product of the VWG is the growing on-line varve image library (preliminary version at: www.geopolar.uni-bremen.de/varves) to help researchers in the evaluation of laminated sediments. It shows annotated examples of the overall macroscopic appearance, internal structure and composition of varves.
Another highlight of the 3rd workshop of the VWG was the one-day field trip to the iconic maar lakes (Fig. 1) of the West Eifel Volcanic Field boasting Central Europe’s longest varve chronology – 23,220 calendar years BP at Lake Holzmaar.
references
Ojala AEK et al. (2012) Quaternary Science Reviews 43: 45-60
James M. Russell1, A.S. Cohen2, T.C. Johnson3 and C.A. Scholz4
1Department of Geological Sciences, Brown University, Providence, USA; James_RussellBrown.edu
2Department of Geosciences, University of Arizona, Tucson, USA
3Large Lakes Observatory, University of Minnesota Duluth, USA
4Department of Earth Sciences, Syracuse University, USA
Providence, USA, 14-16 November 2011
 |
|
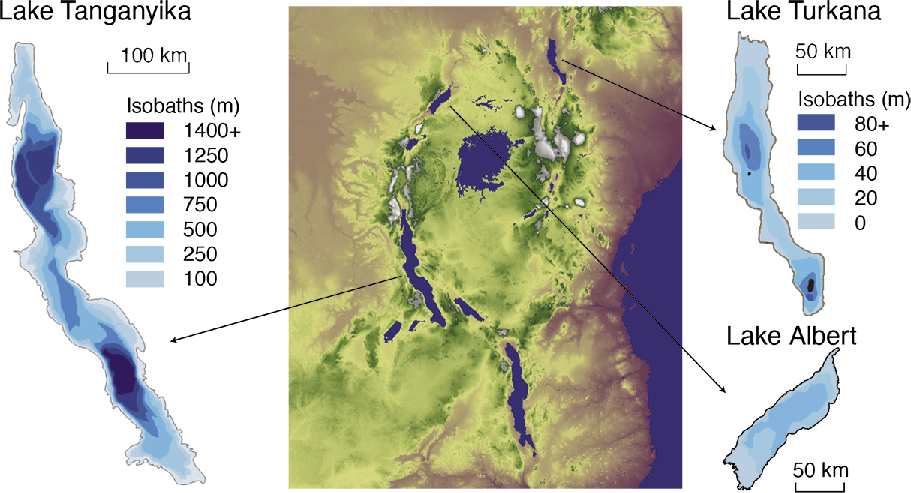
Figure 1: Map of East Africa with bathymetric maps of Lakes Tanganyika, Turkana, and Albert. Note the different scale for Tanganyika. |
The East African Rift Lakes offer unparalleled opportunities to investigate long-term environmental and climatic change in a low-latitude continental setting. Their sediments hold signals of the evolution of tropical temperature and rainfall at seasonal to geological timescales (Cohen et al. 2006; Tierney et al. 2008), record the environmental backdrop against which Africa’s flora and fauna – including our own species – evolved (Martens 1997), and provide insight into tectonic processes that shape the world’s largest active continental rift system (Ebinger 1989). The past decade has witnessed enormous advances in our efforts to obtain long records of East African climate, highlighted by the scientific drilling of Lake Malawi in 2005 (Scholz et al. 2007). Recent and ongoing geophysical surveys of a number of potential future drilling targets, including Lakes Turkana, Albert, and Tanganyika (Fig. 1), have set the stage for the next phase of continental scientific drilling in East Africa. To this end, PAGES and the US National Science Foundation supported a “Continental Drilling in the East African Rift Lakes” strategic planning workshop, attended by about 40 African, European, and US scientists.
We used plenary presentations on current initiatives to reconstruct and model East African paleoenvironments using marine and lacustrine sediments, the mechanisms behind the geologic and biological evolution of the East African rift, and the stratigraphic architecture and environmental history of Lakes Turkana, Albert, and Tanganyika to initiate a series of breakout discussions. These breakouts defined critical scientific hypotheses and questions for future drilling projects, including:
- What are the timing and dynamics of key transitions in the Plio-Pleistocene evolution of African climate as a consequence of global and tropical climate reorganizations, including the expansion of Northern Hemisphere ice sheets, the termination of a permanent Pliocene El Niño, and the closure of the Indonesian seaway?
- What is the sensitivity of East African temperature and rainfall to radiative forcing (insolation and greenhouse gases) and high-latitude processes?
- What are the rates and amplitudes of millennial to decadal East African climate change, and how do these vary with changes in the Earth’s mean climate state?
- What are the rates, sensitivities, and thresholds for ecological and evolutionary responses of ecosystems and communities to climate and environmental change across different timescales?
- What are the regulating mechanisms and emergent properties of the dissociation and reassembly of aquatic ecosystems and communities through time?
- What are the rates of border fault slip in the rift basins, how are they controlled by geothermal gradients and volatile concentrations, and how do long-term fault slip rates relate to short-term seismic hazards such as earthquake frequency?
Addressing these questions will require analysis of long and continuous sediment cores that archive signals of climate variability at a hierarchy of timescales (seasonal, interannual, orbital); sites that preserve a variety of biological materials such as pollen, diatoms, ostracods, and fish remains; and integrated, 4-D studies of rift evolution.
While Albert, Turkana, and Tanganyika can all provide insight into the climatic, biological, and geological evolution of East Africa, the group nominated Lake Tanganyika as its highest priority target. Tanganyika uniquely holds long and continuous sedimentary records extending well into the Pliocene at modest (1-1.5 km) drilling depths (McGlue et al. 2008), an extraordinary variety of endemic lacustrine fauna and flora with proven fossil records, and a relatively simple rift architecture uncomplicated by extensive volcanism. Efforts are now underway to acquire new intermediate resolution seismic reflection data from Tanganyika to site drilling targets, reanalyze existing Tanganyika sediment cores to expand our arsenal of proxies, and to build our knowledge of the structural evolution and tephra stratigraphy of this basin. These activities will refine our understanding of the environmental evolution of tropical East Africa, and serve as milestones in the road to drilling Lake Tanganyika.
references
Cohen AS et al. (2006) Journal of Paleolimnology 36(2): 189-209
Ebinger CJ (1989) Geological Society of America Bulletin 101: 117-133
Martens K (1997) Trends in Ecology and Evolution 12: 177-182
McGlue MM et al. (2008) Journal of Paleolimnology 40: 635-653
Jan-Berend Stuut1,2, U. Merkel2 and D.-D. Rousseau3
1NIOZ - Netherlands Institute for Sea Research, Den Burg, The Netherlands; jbstuutnioz.nl
2MARUM - Center for Marine Environmental Sciences, University of Bremen, Germany
3Ecole Normale Supérieure, Laboratoire de Météorologie Dynamique & CERES-ERTI, Paris, France
2nd meeting of PAGES ADOM Working Group, Bremen, Germany, 31 Oct-3 Nov 2011
 |
|
Figure 1: Dust storm over China in April 2001. Dust from this event crossed the Pacific Ocean and was deposited as far as the Great Lakes region in the USA. Image credit: NASA. |
Understanding the role of mineral dust in the climate system and its radiative impact is expected to reduce existing uncertainties about global climate change. In this context, the PAGES "Atmospheric Dust during the last glacial cycle: Observations and Modeling (ADOM)" working group intends to combine the evidence from aeolian records from continents, oceans, and ice sheets with model simulations of the past atmospheric circulation and modern process understanding.
Following up on the first ADOM workshop (Hyères-les-Palmiers, France, 2009; Rousseau et al. 2009), and the results of the DUSTSPEC meeting (Lamont, USA, 2010; Winckler et al. 2010), it was recognized that there is a specific need for an integration of datasets of dust deposition on land and in the ocean. Furthermore, it has been acknowledged that there are still large gaps in our knowledge on dust processes and dynamics. Open questions exist about emission-related processes at the various sources of dust, dispersion at different altitudes in the atmosphere, deposition on both terrestrial and marine environments and the effects of mineral dust after deposition.
To address these questions, the second ADOM workshop focused on strategies to derive quantitative and physically consistent synoptic reconstructions by integration of dust records, climate observations, and model simulations.
The workshop was organized according to the following themes: (1) Present-day dust, meteorology and remote sensing; (2) Ice, marine, and terrestrial dust archives; (3) Modern and (paleo-) dust modeling; (4) Open discussion on future activities and strategies.
The open discussion raised different questions of importance: Which are the relevant (paleo) sources of dust (a key point for climate model setups)? Are the differences between atmospheric measurements and observations of paleo-dust particle size distributions significant? Which size range should be used in climate models given the fact that present-day observations of particle-size variations cannot be explained in terms of basic physics? How reliable is the reconstruction of wind-strength variations from dust/loess grain-size data given that grain size is also determined and constrained by other factors such as transport-distance and altitude or mixing? Which parameters influence the atmospheric processing of dust, including dry and wet deposition?
Several recommendations resulted from the final discussion. These include a strategic remapping of global soil distributions and the collection of more meteorological and mineral-dust data closer to the dust sources. Methods on dating and the measurement of particle grain size and shape should be standardized, and the definitions of isotope ratios for the characterization of different source regions refined. 222Rn should be monitored in polar regions to constrain atmospheric transport times. Furthermore, new marine sediment proxies should be developed to constrain the provenance of dust in Antarctica. Seasonal to millennial timescales should be taken into account when studying dust processes and mechanisms. In the context of abrupt climate change, selected Dansgaard/Oeschger events deserve more focus where detailed evidence from ice cores exists. Finally, there is a need for a coordinated exchange of data between the paleo and modeling communities, which should flank ongoing database initiatives such as DUSTSPEC, PASH2 or DIRTMAP.
Almost 50 participants from 10 countries made this workshop a very successful and fruitful one. It was organized by Jan-Berend Stuut, Ute Merkel, and Denis-Didier Rousseau, with sponsorship from MARUM, NIOZ and PAGES. A PAGES newsletter dedicated to the dust topic is planned.
More information:
www.marum.de/dust-workshop2011.html
and
http://pastglobalchanges.org/science/wg/former/adom/intro
references