PAGES Magazine articles
Kenneth G. Miller1, M.E. Raymo2, J.V. Browning1, Y. Rosenthal1 and J.D. Wright1
Re-evaluation of Pliocene sea levels indicates large errors (up to ±15 m), precluding firm estimates. Sea level appears to have peaked at ~10-20 m above present, consistent with some ice loss from the East Antarctic ice sheet (EAIS) as suggested by models and Antarctic sediments. More accurate estimates of Pliocene peak sea level require improved modeling techniques and proxy evaluation.
The Pliocene recorded a period of global warmth and high sea level that can provide constraints on relationships among global climate, atmospheric CO2, and sea-level changes (Raymo et al. 2009, 2011; Miller et al. 2012). Global surface temperatures during the most recent period of Pliocene warmth at ca. 3 Ma were 2–3°C warmer than the 20th century (Dowsett et al. 2013). Pliocene atmospheric CO2 estimates of 400±25 ppmv (e.g. Bartoli et al. 2011) are similar to those observed today.
Published estimates of the peak Pliocene sea level span a wide range, though a peak of 25 m is often cited (e.g. Dowsett et al. 2013). Miller et al. (2012) estimated a peak of 22±10 m by comparing continental margin (Wanganui Basin, New Zealand; VA, USA), atoll (Enewetak), and deep-sea benthic foraminiferal δ18O (δ18Obenthic) and Mg/Ca records. More recent work has shown that much of the variance among continental records can be attributed to regional changes in mantle dynamic topography (MDT) and glacial isostatic adjustment (GIA) (e.g. Raymo et al. 2011) and that estimates derived from continental sections have large errors of ±10 m or larger due to these effects (Rovere et al. 2014). Deep-sea δ18Obenthic and Mg/Ca records potentially provide a means of independently estimating ice volume, and hence global mean sea level (GMSL) variations. For example, Woodard et al. (2014) used δ18Obenthic and Mg/Ca records to provide estimates of the Pliocene peak of 21±10 m. However, Raymo et al. (2018) provided extensive discussion of errors on δ18Obenthic-Mg/Ca method, showing that they are potentially quite large (±15 m or larger) due to diagenesis and changing ocean chemistry over millions of years. These are critical areas for future study and advancement.
Measuring sea level relative to the continents
Continental margins contain a record of over a billion years of sea-level change, though the water depth changes observed as transgressions and regressions reflect many processes including GMSL (eustasy), subsidence/uplift (including MDT), and sediment input/loading. “Backstripping” is a method that progressively removes the effects of compaction, loading, and thermal subsidence from water-depth changes, with the residual reflecting the effects of GMSL and non-thermal tectonism (e.g. Kominz et al. 2016), including changes in MDT.
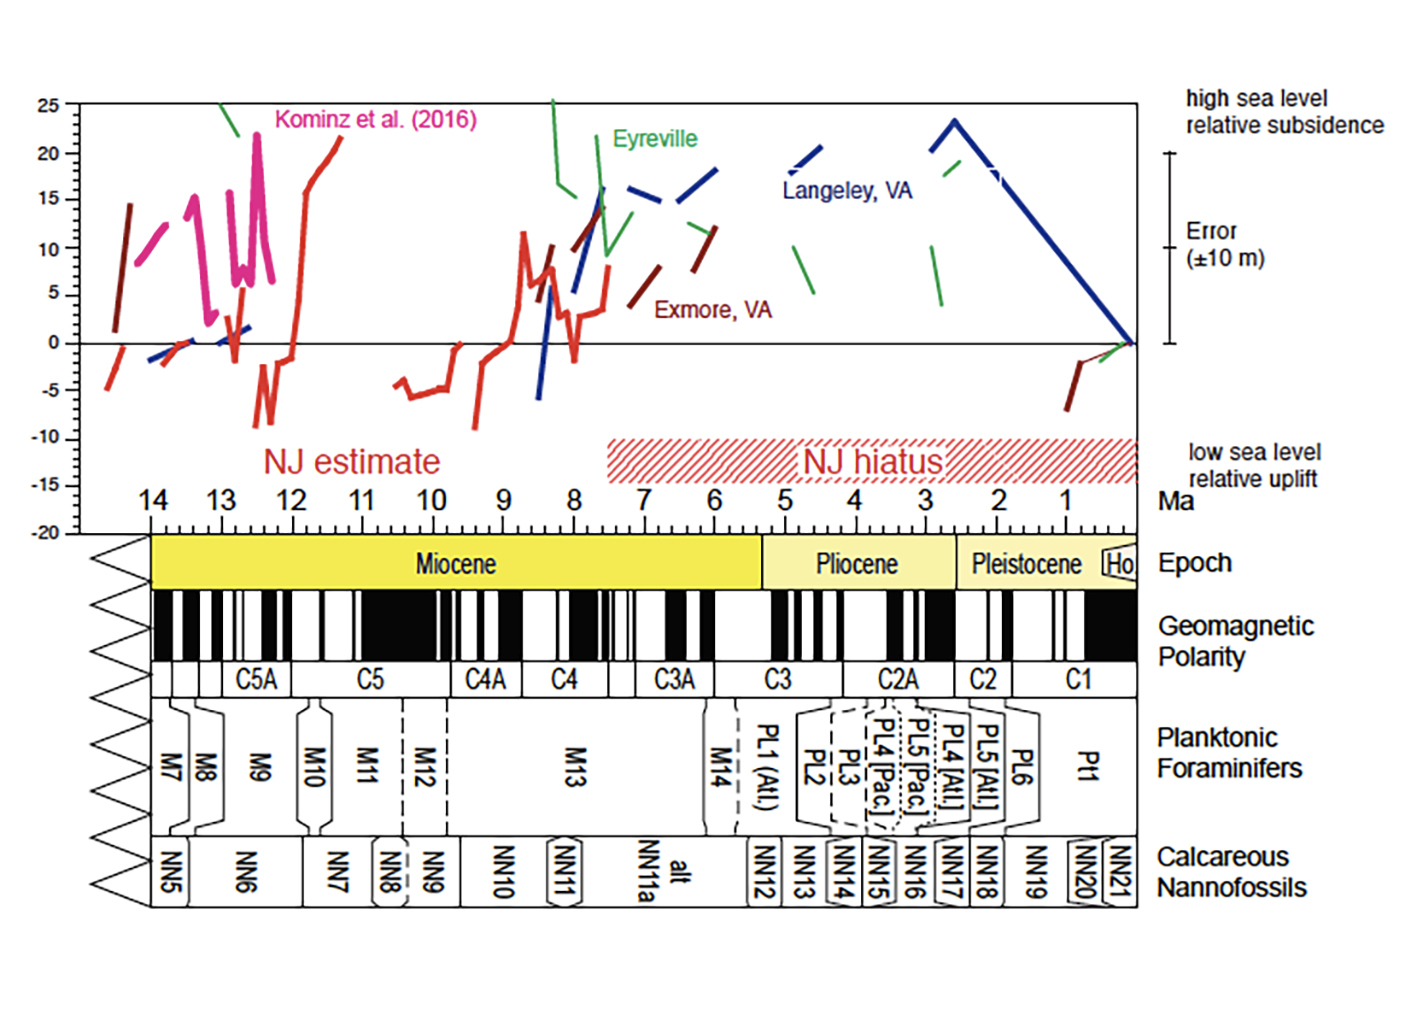
Using the backstripping technique, it is possible to quantify Pliocene differential movement between Virginia (VA) and New Jersey (NJ; Fig. 1). Both records are similar in the Miocene until ~7.5 Myr BP when a hiatus is observed in NJ cores. Backstripping of water depth variations suggests at least ~20 m of differential movement between VA and NJ (Fig. 1). We attribute the difference between VA and NJ to MDT, as suggested by modeling by Rowley et al. (2013). In the absence of other datasets, it would be impossible to tell if VA subsided or if NJ was uplifted (Fig. 1), calling into question the estimates of 17±10 m obtained from the VA records (e.g. Miller et al. 2012).
 |
|
Figure 1: Relative sea level from the US east coast. This figure illustrates differential movement between VA and NJ during the Late Miocene to Pliocene due to MDT as modeled by Rowley et al. (2013). Shown are NJ backstripped estimates (red = Miller et al. 2005; magenta = Kominz et al. 2016), and VA estimates (blue = Langley, purple = Exmore, both after Hayden et al. 2008; green = Exmore after Miller et al. 2012). The marine Miocene section in NJ is replaced by Pliocene upland gravels in outcrop deposited above sea level indicating relative uplift in NJ. |
A new δ18O-Mg/Ca based sea-level record
Previous Pliocene studies used δ18O as a sea-level proxy and relied on the Lisiecki and Raymo (2005; hereafter LR04) benthic foraminiferal δ18O stack (Miller et al. 2011) or Atlantic δ18O and Mg/Ca records overprinted by North Atlantic circulation effects (e.g. Woodard et al. 2014). The LR04 stack incorporates Atlantic and Pacific records though it is weighted toward Atlantic records. LR04 provides a pristine chronology, but like any stack, it shows a reduction in the amplitude of δ18Obenthic signal caused by combining records.
Pacific δ18Obenthic changes reflect variations in deep-water temperature and δ18Oseawater; they are less affected by regional circulation and other changes because the Pacific comprises 60% of the global ocean reservoir. Differences in Pacific δ18Obenthic values between the peak Pliocene values and modern values provide a constraint on high sea-level estimates. The relatively minor difference in δ18Obenthic between the modern and Pliocene in the LR04 stack may possibly be attributed to various biases and not accurately scale to the difference in ice volume (Raymo et al. 2018). Still, Pacific δ18Obenthic values can place constraints on sea level during the mid-Pliocene warm extremes.
Here, we use the best-resolved Pacific benthic foraminiferal (Uvigerina) record compiled from Pacific Site 846 (3°06'S, 90°49'W, 3307 m water depth; data compiled and astronomically dated by Lisiecki and Raymo 2005; lorraine-lisiecki.com/stack.html). At Site 846, the difference between peak Pliocene δ18Obenthic values and modern is ~0.63‰, similar to the 0.5‰ difference observed at Pacific Site 1208 (3346 m water depth; Woodard et al. 2014), but significantly larger than observed in the LR04 stack (0.3‰). Pacific deep-water temperatures during Pliocene interglacials were warmer than present (~1.5±0.5°C warmer from Mg/Ca; Woodard et al. 2014), suggesting that only 0.13-0.25‰ of the δ18Obenthic signal can be attributed to δ18Oseawater and 10-20 m higher sea levels due to melting of ice sheets. Values less than 10 m can also be excluded by our intuition that sea level in the Pliocene was higher than the last major interglacial (Marine Isotope Stage 5e that has a GMSL 8±2 m above present; Dutton et al. 2015) due to the enhanced Pliocene global warmth.
 |
|
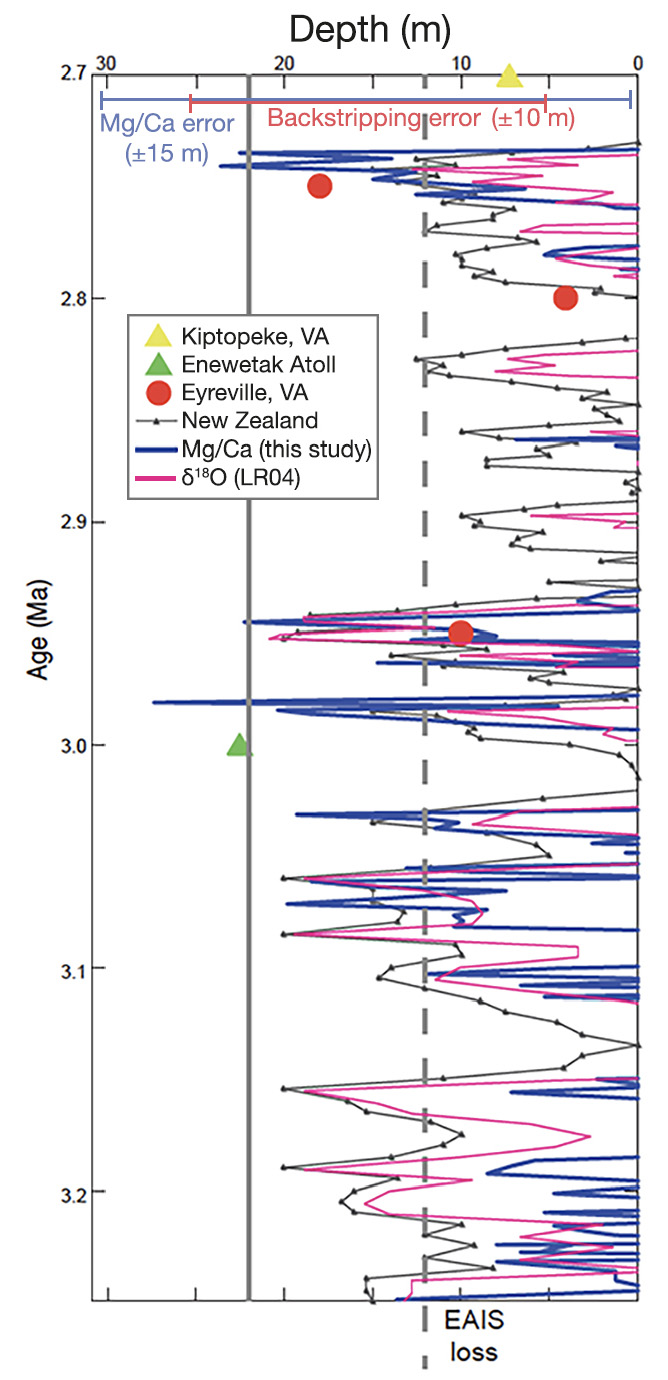
Figure 2: δ18O-Mg/Ca based sea-level estimate updated from Miller et al. (2012). Map shows Exmore (E), Kiptopeke (K) and Langley (L) coreholes and Wanganui Basin (W). Sea levels to the left of the dashed vertical line suggest some melting of the EIAS. |
We use the Site 846 δ18Obenthic record to provide a new sea-level curve following the approach of Cramer et al. (2011), assuming Milankovitch scale (104-105 year) temperature changes comprise ~20% of the δ18Obenthic changes, and the δ18Oseawater-sealevel calibration of 0.13‰/10 m (Winnick and Caves 2015). Comparison of the δ18O-Mg/Ca based sea-level estimate with the backstripped estimates from VA, Enewetak, and New Zealand illustrate general agreement and indicate peak values indicative of some loss of the EAIS, but again with large error estimates (Fig. 2). Given the errors in the various analyses (e.g. up to ±15 m; Fig. 2) it could be argued that any agreement in amplitude is entirely serendipitous. Despite the limitations of these methods at present, it is extremely likely (>95% probability) that maximum Pliocene sea levels were higher than modern, and very likely higher (>90% probability) than the last interglacial (8±2m; Dutton et al. 2015) during the peak highstands of the Pliocene warm period.
Summary and future work
Studies of continental margin and deep-sea sediments have increased age resolution and provided improved constraints on the amplitude of sea-level changes. However, our sea-level estimates have large uncertainties (±10 to ±15 m), thus precluding a definitive statement regarding EAIS melt during the Pliocene. For example, the estimate of 22±10 m could allow melting between 0 and 40% of the EAIS (Miller et al. 2012). The Site 846 δ18Obenthic record places constraints likely excluding values above 20 m. Our best estimate of approximately 12-20 m is consistent with melting of the EAIS in the Wilkes and Aurora sub-basins suggested by models (DeConto and Pollard 2003) and sediment tracer data (e.g. Bertram et al. 2018). Future studies would benefit from improved modeling of the effects of MDT, improved understanding of evolution ocean Mg/Ca and diagenesis, and key observations around Antarctica by ocean/ice drilling to pinpoint active and decaying ice sectors through time.
affiliations
1Department of Earth and Planetary Sciences and Rutgers Institute of Earth, Ocean, and Atmospheric Sciences, The State University of New Jersey, New Brunswick, USA
2Lamont Doherty Earth Observatory and Department of Earth and Environmental Science, Columbia University, Palisades, NY, USA
contact
Kenneth G. Miller: kgm rutgers.edu
references
Bartoli G et al. (2011) Paleoceanography 26: PA4213
Bertram R et al. (2018) Earth Planet Sci Lett 494: 109-116
Cramer B et al. (2011) J Geophys Res 116: C12023
DeConto R, Pollard D (2003) Palaeogeogr, Palaeoclimatol, Palaeoecol 198: 39-52
Dowsett H et al. (2013) Sci Rep 3: 2013
Dutton A et al. (2015) Science 349: aaa4019
Hayden T et al. (2008) Geology 36: 327-330
Kominz M et al. (2016) Geosphere 12: 1437-1456
Lisiecki L, Raymo M (2005) Paleoceanography 20: PA1003
Miller K et al. (2005) Science 310: 1293-1298
Miller K et al. (2011) Oceanography 24: 40-53
Miller K et al. (2012) Geology 40: 407-410
Raymo M et al. (2009) PAGES News 17: 58-59
Raymo M et al. (2011) Nat Geosci 4: 328-332
Raymo M et al. (2018) Earth-Sci Rev 177: 291-302
Rovere A et al. (2014) Earth Planet Sci Lett 387: 27–33
Rowley D et al. (2013) Science 340: 1560-1563
Natasha L.M. Barlow1, G.A. Milne2 and J.D. Shakun3
In 2019, the PAGES and INQUA-CMP (inqua.org/commissions/cmp) working group PALeo constraints on SEA level rise (PALSEA) entered its third phase. Established in 2008 by Mark Siddall and colleagues (Siddall et al. 2009), the second phase of PALSEA (PALSEA2, 2013-2017) was led by Anders Carlson, Andrea Dutton, Antony Long and Glenn Milne. The group continued the successful approach of bringing together observational and modeling scientists focusing on ice-sheet, climate and sea-level change to better define constraints on ice-sheet-driven paleo sea-level rise and apply this knowledge to inform projections of future change. Increased dialogue between these, and broader, communities over the past 10 years of PALSEA have resulted in over 100 peer-reviewed publications tackling societally important questions as to the drivers of ice-sheet and sea-level change. The consequences have been far-reaching, with a key indicator being the significant paleo sea-level and ice-sheet components included in the IPCC AR5 report (Church et al. 2013; Masson-Delmotte et al. 2013), and several members of the PALSEA community currently working as authors of the IPCC AR6 report.
One standout contribution of the PALSEA working group has been the considerable progress made by the observational community to agree on best practice for methods to reconstruct the elevation of former sea levels (Khan et al. p. 10). This has resulted in the production of a standardized sea-level database protocol (Düsterhus et al. 2016; Khan et al. p. 10) and a growing number of high-quality regional and global databases for different time periods (Miller et al. p. 4; Dutton and Barlow, p. 6; Barnett et al. p. 8; Khan et al. p. 10) that provide the foundation for empirical and process-based modeling studies which aim to identify the underlying driving mechanisms across a range of temporal and spatial scales.
 |
|
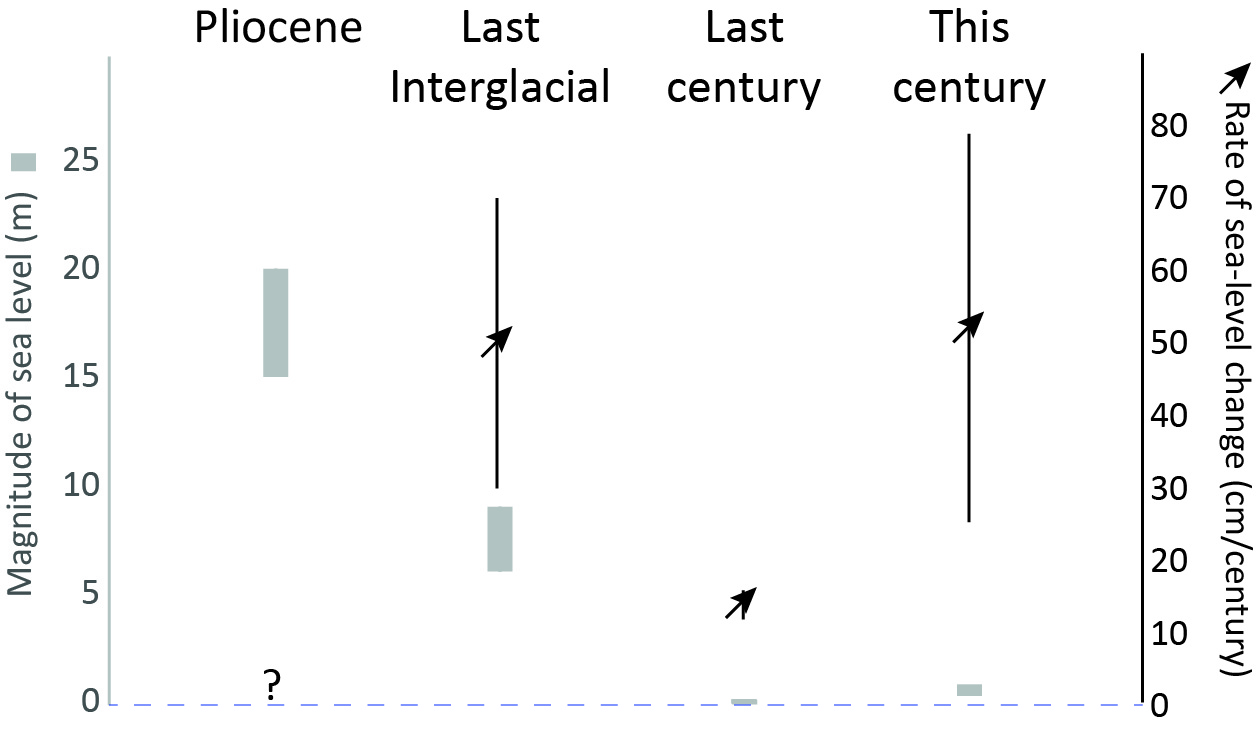
Figure 1: Summary of the magnitude of GMSL highstand during the Pliocene (Miller et al. p. 4), the Last Interglacial (Dutton and Barlow, p. 6; Dutton et al. 2015) relative to present, the last century relative to pre-industrial (1900 CE; Barnett et al. p.8; Kopp et al. 2016) values, and this century relative to the year 2000 (Church et al. 2013). The rate of GMSL change during the Pliocene is not well constrained; LIG estimate based upon the "likely" range of 3-7 m/kyr from Kopp et al. (2013); rate for the last century based upon the year 1900-2000 rate from Kopp et al. (2016); and the rate for this century based upon the average rates of GMSL rise for the 21st century using the projected rise for the period 1986-2005 to 2081-2100 as given in Table 13.5 of Church et al. (2013) using the "likely" ranges for RCPs 2.6 and 8.5 (specifically, the lower bound for RCP 2.6 and upper bound for RCP 8.5). |
Research stimulated by PALSEA has identified processes that complicate estimates of global mean sea level (GMSL), and thus ice volume, from a geographically distributed set of local releative sea level (RSL) reconstructions. This has led to ongoing efforts to improve our understanding and ability to more accurately model processes such as glacial isostatic adjustment (Milne et al. p. 16), mantle dynamic topography (Austermann and Forte, p. 18), sediment flux and associated loading (Ferrier et al. p. 24), and overprinting records of extreme storm or wave events (Engelhart et al. p. 26). As these models improve, so too will estimates of global ice volume during past warm periods, providing a target and stimulus for the data and modeling communities to determine the minimum extent of the Greenland and Antarctic ice sheets and thus the climate drivers of sea-level rise during key intervals of Earth’s history (Carlson and Larsen. p. 12; Sime et al. p. 14; de Boer et al. p. 20; Otto-Bliesner et al. p. 22).
Late Holocene RSL research (Barnett et al. p. 8) has shown that an ability to constrain rates of sea-level change can provide important insights into drivers, synchronicity, and feedbacks in the coupled Earth system. However, prior to the radiocarbon dating window (ca. >40 kyr BP), establishing rates of both ice-sheet and sea-level change continues to be a challenge (Miller et al. p. 4; Dutton and Barlow, p. 6). While community efforts to better quantify GMSL have been successful, constraining rates of change during past warm periods remains an elusive target (Fig. 1), but a critical one to more effectively use paleo observations in future projections (Horton et al. p. 28). The spatial aspect of the problem has also been brought to the fore though PALSEA activities. Sea-level change is not globally uniform and so there is now a clear shift towards developing and understanding regional sea-level changes and relating these to GMSL.
The new phase of PALSEA, led by researchers who have benefited from the PALSEA network as early-career scientists (Jacqueline Austermann, Natasha Barlow, Alessio Rovere and Jeremy Shakun), seeks to build on past success and focus efforts on moving towards some of the outstanding goals outlined above. As the contemporary system exhibits accelerated and potentially irreversible changes (e.g. Shepherd et al. 2018), the relevance of the paleo record, which contains information on such responses in the past, becomes even more critical (Horton et al. p. 28). This Past Global Changes Magazine brings together contributions that summarize the state-of-the-science following the last decade of investigation and collaboration, as well as provide a stimulus into critical areas of research for PALSEA and the wider community.
affiliations
1School of Earth and Environment, University of Leeds, UK
2Department of Earth and Environmental Sciences, University of Ottawa, Canada
3Department of Earth and Environmental Sciences, Boston College, USA
contact
Natasha Barlow: N.L.M.Barlowleeds.ac.uk
references
Düsterhus A et al. (2016) Clim Past 12: 911-921
Dutton A et al. (2015) Science 349: aaa4019
Kopp RE et al. (2013) Geophys J Int 193: 711-716
Kopp RE et al. (2016) Proc Natl Acad Sci 113: E1434-E1441
Yu Liu1, J.R. Dodson1,2 and W. Cai3
Xi’an, China, 18-21 June 2018
This workshop was organized by the Institute of Earth Environment at the Chinese Academy of Sciences and attracted speakers from across China, as well as Australia, India, Japan, and USA. A total of 35 talks were presented, covering diverse topics from identifying abrupt events and their impact on past societies; interdecadal variability; modeling and dynamical forcing from the Atlantic, Indian and Pacific Oceans; the Sun; and aerosols. A large number of new high-resolution datasets were presented. A key feature of the meeting was the large number of presentations by young scientists, a sure sign of a healthy future for Holocene science.
In the past there have been conflicts arising from climate changes and even possibly dynastic collapses. Understanding how humans coped with changes in the past, evident in high-resolution time series, provides a template relevant for policy and planning issues. The role of humans as drivers of abrupt changes in the Holocene in various parts of the world was discussed, as well as the expression of abrupt changes such as the 9.2, 8.2 and 4.2 ka BP cooling and drying events, which are represented to varying degrees in different regions. Several analyses focused on modern process studies and on how these can help improve precision in interpretation of paleoseries. The recent international cooperative ocean monitoring program (led by the Ocean University of China, Qingdao) is an outstanding example of this, and despite its yet still short time series, it is already yielding new insights into ocean dynamics.
 |
|
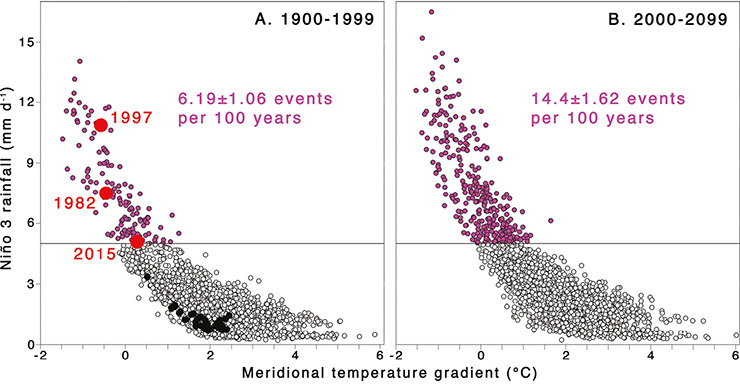
Figure 1: Relationship of meridional SST gradient (5-10°N, 150-90°W minus 2.5°S-2.5°N, 150-90°W) with December-January-February (DJF) mean Niño 3 (5°S-5°N, 150-90°W) rainfall, for (A), Control Climate (1900-1999 CE) and (B), Climate Change (2000-2099 CE) periods, respectively, aggregated over 21 selected CMIP5 models. Purple dots indicate modeled extreme El Niño events with a Niño 3 DJF rainfall greater than 5 mm per day and black circles indicate other modeled events. The corresponding average frequency of modeled extreme El Niño over the Control Climate period and Climate Change period is labelled in each panel, with the 95% confidence intervals based on a Poisson distribution. Red dots in (A) indicate observed 1982/83, 1997/98 and 2015/16 CE extreme El Niño events and black dots indicate other observed events since 1979. For more details see Cai et al. (2014). |
ENSO events now show evidence of enhancement by volcanic forcing, and appear to be stronger in the 20th century than any other period in the Holocene. The future expression of ENSO is of vital concern for many parts of the world. While no two ENSO events are the same, Figure 1 shows how a modeled future configuration will lead to increasing numbers of extreme events. New evidence is emerging on the frequency of droughts in eastern Asia and on how these are related to variability and intensity of the Asian Summer Monsoons, especially in the later Holocene. There is now a strong case emerging for the forcing of climate change in eastern Asia modulated by both the Atlantic Meridional Ocean Oscillation and the Pacific Decadal Oscillation. It was noted that much good science emerges from international cooperation, and at present this is taking place in good spirit and above regional geopolitical considerations.
Some time was spent identifying areas that are particularly vulnerable to future change in Asia. These include Central Asia, the Indian Monsoon region and North East China, and are likely to provide challenges for the people who live there and from a geopolitical aspect.
Young scientists were challenged to think beyond simple series comparisons when considering their own data, and to keep in mind that while some series do in fact show similarities, these sometimes break down due to phase shifts and altered forcing conditions. Systems become better understood when the full range of variability is revealed and studied.
affiliations
1Institute of Earth Environment, Chinese Academy of Sciences, Xi’an, China
2Faculty of Science, Medicine and Health, University of Wollongong, Australia
3Centre for Southern Hemisphere Oceans Research, Hobart, Australia
contact
John R. Dodson: johnieecas.cn
references
David A. Byers1, M. Lima1, A. Gil2, E. Gayo3, C. Latorre3, E. Robinson4 and R. Villalba2
San Rafael, Argentina, 14-18 May 2018
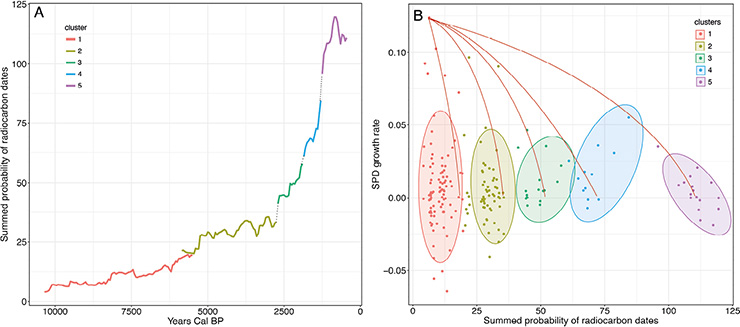
The PEOPLE 3000 working group focuses on integrating archaeological and paleoecological case studies with mathematical modeling. We seek to understand how co-evolving human societies and ecosystems can successfully cope with the interrelated forces of population growth, increasing social complexity and climate change, and the diversity of trajectories of reorganization that social-ecological systems follow. Our work focuses on the observation that human societies experienced periods of social and economic development followed by major reorganizations throughout the Holocene. Thus, we are investigating explanations for what appears to be widespread and, potentially, climate-driven patterns.
Much of our research builds on the Variance Reduction Safe Operating Space (VRSOS) hypothesis (Anderies 2006). The VRSOS proposes that population growth, increasing complexity, and increasing energy consumption reduce variation in human subsistence economies. This, in turn, results in systems where individuals are well adapted to a specific range of climate variation, but where those same strategies are easily disrupted by climate change outside the range to which a society has adapted. Whether social-ecological systems follow a collapse trajectory or a new growth trajectory depends on the adaptive capacity of individuals within ecological and institutional constraints. To date, we have begun to explore such relationships with a series of related publications and grant proposals (Freeman et al. 2018a,b).
The May 2018 workshop moved our research forward by synthesizing radiocarbon, paleoecological, and subsistence data in ways that allow the working group to integrate them with mathematical models. The workshop resulted in the following outcomes:
1. The collation of radiocarbon and paleoenvironmental records from North and South America, Europe and Australia.
2. Outlines of manuscripts exploring ways the VRSOS hypothesis can predict broad shifts in human subsistence and settlement decisions across the Holocene. This hypothesis allows for the identification of periods when we would predict societal reorganizations and how those adaptive shifts may occur. Our data suggest that Late Holocene prehistoric societies across the globe experienced trajectories of adaptive reorganization, subsistence specialization, and sometimes societal collapse in response to environmental changes as predicted by the VRSOS.
 |
|
Figure 1: (A) Summed probability distribution of California, USA, radiocarbon ages against time for five demographic regimes. (B) Discrete time logistic growth models for each of the five demographic regimes for the California case study. |
3. Outlines of manuscripts deploying well-established logistical growth models derived from population ecology to understand how shifts in carrying capacity can condition demographic regimes across the Holocene. In this case we define a demographic regime as a one defined by a fixed carrying capacity. Shifting carrying capacity moves a population into a new demographic regime. We explore this idea by identifying different patterns of growth and climate-mediated collapses in the more distant past (Lima Arce 2014). For example, Figure 1a illustrates the long-term growth (trends) and medium-term fluctuations (peaks and valleys) of human populations and economies from the California (USA) case study discussed at the workshop. This case displays long-term growth, but with various medium-term spurts of growth and decline. However, although the broad trend displays long-term growth, the type of growth is variable. Figure 1b applies discrete time logistic growth models to the data and suggests that in California, the long-term growth of human societies was driven by a shift in their carrying capacity, either through social-technological change or climate change. This methodology allows us to compare demographic regimes and better understand how and why they change.
The workshop outcomes opened several new lines of research. Specifically, we will move forward by exploring relationships between archaeological and paleoecological datasets within the context of the VRSOS and logistic models discussed above. Of greatest interest to us are the ways that low-frequency, but high-amplitude, environmental events can prompt for societal adaptations resulting in either positive or negative demographic changes. Understanding what social and ecological factors conspire to condition the direction of demographic changes, and using this information to predict the direction and magnitude of change for specific archaeological phenomena, outline our next challenges — ones we aim to address in future studies.
affiliations
1Anthropology Program, Utah State University, Logan, USA
2CONICET-IANIGLA/San Rafael, Technological National University (UTN-FRSR), Mendoza, Argentina
3Department of Ecology, Pontifical Catholic University of Chile, Santiago, Chile
4Department of Anthropology, University of Wyoming, Laramie, USA
contact
David A. Byers: david.byersusu.edu
references
Anderies JM (2006) J Institut Eco 2: 133-155
Freeman J et al. (2018a) Radiocarbon 60: 453-467
Janne Repschläger1, A. Schmittner2, J. Lippold3, L. Skinner4 and J. Muglia2
IPODS-OC3 workshop, Cambridge, UK, 6-9 September 2018
The transition of Earth’s climate from the cold Last Glacial Maximum (LGM) to the warm Holocene is still not fully understood. It is associated with a rise in atmospheric CO2 acting as an important driver of the global warming. Although changing ocean circulation during the deglaciation has been linked to the rates of CO2 increase, its exact mechanism remains unclear, and quantifying changes in the ocean circulation and carbon storage remain challenging tasks.
The overarching goal of PAGES’ working group Ocean Circulation and Carbon Cycling (OC3) is to compile global foraminiferal carbon (δ13C) and oxygen (δ18O) isotope data and compare them with model simulations to better understand changes in ocean circulation and carbon cycling during the last deglaciation. INQUA’s Investigating Past Ocean Dynamics (IPODS) focus group works towards the same scientific objective by synthesizing complementary global ocean circulation proxy data such as radiocarbon (Δ14C), εNd and Pa/Th. This joint IPODS-OC3 workshop aimed to make progress through new regional and global data syntheses and their combination with isotope-enabled model simulations.
The workshop brought together 40 international scientists – sea-going paleoceanographers and modelers – to report the progress within the working groups, to discuss potential overlaps between the communities and to identify potential joint aims.
On the first day of activities, OC3 regional syntheses group leaders gave updates of current activities and work progress from different ocean basins (North and South Atlantic, and Indian Ocean). Additionally, posters were presented on regional datasets and modeling approaches. δ13C and δ18O data were discussed with respect to the importance of deep and intermediate water distribution and circulation, and importance of the different ocean regions for CO2 storage and deglacial CO2 release.
The focus of the discussion was on new age-model and data-visualization software tools, including age-model approaches PARIS (Claire Waelbroeck), HMM-Match (Lorraine Lisiecki) and the age-model software and visualization tool PaleoDataView (Stefan Mulitza). Discussions included the differences of the approaches, age-model error assessments and uncertainties in reservoir age corrections.
 |
|
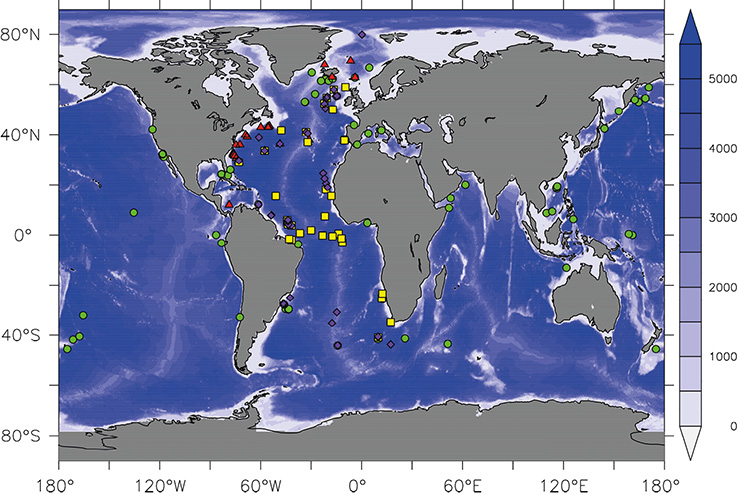
Figure 1: Map showing cores included in the OC3 and IPODS databases covering the last deglaciation. Green circles show published high-resolution δ13C data prioritized for quality control. Red triangles are radiocarbon data from Zhao et al. (2018). Yellow squares are Pa/Th data (Ng et al. 2018) and purple diamonds are εNd data. |
Age models are an important backbone of OC3 and IPODs databases. As nearly all cores in the IPODS database are also included in the OC3 database (Fig. 1), the same age models will be used for the global synthesis to enable the direct comparison of different proxy records from the same cores.
The second day of the conference was designated to the IPODS working group. General summaries of the current knowledge in εNd, Pa/Th and ∆14C were given by work-group leaders, followed by presentations of recent compilation studies (Pietrowski, Blaser; Ng et al. 2018).
The final day of the workshop was dedicated to future plans of OC3 and IPODS. The participants encouraged OC3 to proceed with the database effort and developed a strategy for the refinement of the data synthesis, including the development of quality-check guidelines and consistent age-model generation. Extensive labor is needed to generate consistent age models and to ensure data quality. A detailed work plan for the next year includes the release of the final database structure with already published regional synthesis datasets, publishing of the Atlantic Ocean synthesis in the beginning of 2019, and work on syntheses papers in the summer of 2019. The chair of OC3 was passed from Andreas Schmittner to Janne Repschläger. Juan Muglia will join the steering committee in the function of database manager.
The workshop added momentum to IPODS and OC3 activities such as the writing of an εNd review paper, the creation of a joint database including δ13C, δ18O, εNd, Pa/Th and ∆14C, and the exploration of common plans for the future.
affiliations
1Max-Planck Institute for Chemistry, Climate Geochemistry, Mainz, Germany
2College of Earth, Ocean, and Atmospheric Sciences, Oregon State University, Corvallis, USA
3Institute of Earth Sciences, Heidelberg University, Germany
4Department of Earth Sciences, University of Cambridge, UK
contact
Janne Repschläger: J.Repschlaegermpic.de
references
Gisela Winckler1, F. Lambert2 and E. Shoenfelt1
Las Cruces, Chile, 8-10 January 2018
Mineral-dust aerosols are critically important components of climate and Earth system dynamics as they affect radiative forcing, precipitation, atmospheric chemistry, surface albedo of ice sheets, and marine and terrestrial biogeochemistry, over significant portions of the planet. Dust-borne iron is recognized to be an important micronutrient in regulating the magnitude and dynamics of ocean primary productivity and affecting the carbon cycle under past and modern climate conditions. Paleodata suggest large fluctuations in atmospheric dust over the geological past. However, dust-transport models struggle to reproduce observed spatial and temporal dust-flux variability. In addition, observational and modeling studies based in the current climate suggest that not all iron in dust is equally available to continental and ocean biota. Iron solubility varies dramatically, depending on mineralogy and state of soils, as well as atmospheric processing by acids. Modeling studies, however, still mostly assume constant solubility.
The PAGES Dust Impact on Climate and Environment (DICE) working group held its first workshop on The Role of Dust in Climate Change: A Biogeochemistry Perspective. Twenty-seven experts from nine different countries came together at the Coastal Marine Research Station of the Catholic University of Chile in Las Cruces for the three-day workshop that was jointly supported by PAGES and the Chilean Comisión Nacional de Investigación Científica y Tecnológica. About half of the participants were early-career researchers or scientists from developing countries. The workshop format combined keynote talks with shorter thematically matching pop-up talks, followed by discussion and brainstorming of future research avenues among all participants.
This workshop was a highly interdisciplinary effort to better quantify and simulate biogeochemical impacts of dust deposition. It gave observationalists and modelers the chance to combine perspectives on the role of dust in ocean biogeochemical cycles and the greater carbon cycle. The specific goal of the workshop was to more precisely quantify the effects of mineral dust, and specifically iron, during various climate states, and to strategize how to further foster this relationship in future work.
The major themes of the keynote presentations followed the pathways of dust emissions, from geochemically identifying and tracing source regions to deposition in the surface ocean. Participants discussed the effects on the solubility and bioavailability of iron at each of these stations in the dust cycle, including the influence of dust source and mineralogy on dust solubility and bioavailability, the role of atmospheric processing in dust solubility, and the importance of organic ligands and aggregation to iron lifetime in the mixed layer of the ocean for bioavailability in modern and past oceans.
Halfway through the workshop, participants split into three breakout groups for extended discussion on the following three avenues of future research (1) Ocean iron sources (aeolian versus others), (2) Iron solubility past, present, future, and (3) Dust particles: shape, size and composition.
 |
|
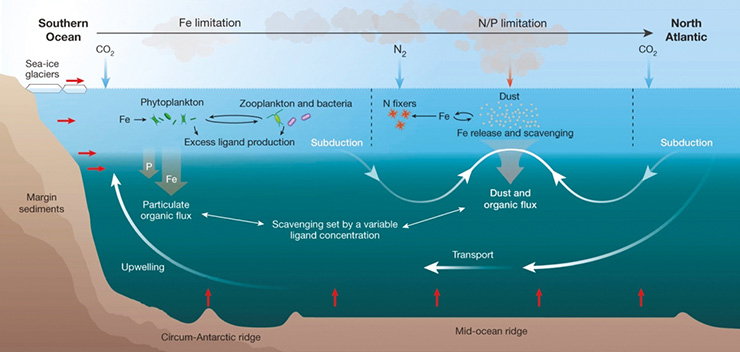
Figure 1: Representation of the major processes in the ocean iron cycle from Tagliabue et al. 2017. Reprinted by permission from Springer Nature. |
As a direct interdisciplinary outcome of the workshop, participants are developing a model that evaluates the relative importance of atmospheric processing, mineralogy, size fraction, settling rate, and ligand-mediated dissolution on the solubility of dust-borne iron that reaches the ocean (Fig. 1). This is in an effort to combine experimental and modeling results to improve the estimates of iron solubility in biogeochemical models – moving beyond the assumptions of constant iron solubility. The group plans to combine observational data on dust-source mineralogy, dust deposition, atmospheric processing, and ligand concentrations and strengths with kinetic models of dust dissolution in the water column. Such a model can be applied to both modern as well as past dust sources that may have been more highly impacted by glacier physical weathering, and have been shown to have a different mineral composition as a result. The goal of this effort is to combine the highly varied range of expertise to better quantify the bioavailable iron in different dust sources across space and time.
affiliations
1Lamont-Doherty Earth Observatory, Columbia University, New York, USA
2Department of Physical Geography, Pontifical Catholic University of Chile, Santiago, Chile
contact
Gisela Winckler: wincklerldeo.columbia.edu (winckler[at]ldeo[dot]columbia[dot]edu)
references
Julie Loisel1 and Angela Gallego-Sala2
College Station, USA, 10-13 May 2018
Members of the C-PEAT working group met at Texas A&M University to define their research plan for Phase 2. The past three years have led to the development and publication of a large database containing over 500 peat records that have been primarily used to (1) reconstruct Holocene carbon and nitrogen sequestration rates across the northern peatland domain, and (2) connect centennial- and millennial-scale changes in carbon sequestration rates to key climatic forcings and environmental controls (Charman et al. 2012; Loisel et al. 2014; Treat et al. 2015). C-PEAT is in the process of making its entire peatland database available on WDS-PANGAEA; 164 sites are readily available under the project name PAGES_C-PEAT. Those same peat profiles have also been ingested in the International Soil Carbon Network’s database (ISCN) and are accessible on its website. These two data sharing activities took place during a “data hackathon” shortly before this workshop. An article in Earth System Science Data, describing the entire database, is in development.
Building on the success of Phase 1, there is a clear need to grow C-PEAT’s research scope. Workshop participants identified future tasks that ultimately aim to further integrate peatlands into land-surface models:
Predict peatland responses to natural and anthropogenic disturbance. Workshop participants agreed that “sensitive processes” such as (a) peatland dynamics that govern decadal-scale vertical peat accumulation and net carbon balance, and (b) margin dynamics that control horizontal peat development (expansion vs. contraction) need to be further connected to disturbance regime including fire, permafrost thaw, invasion by new species, drainage, prescribed burning, and other land-management scenarios. Here, the paleo perspective acquired during Phase I will be used to compare and contrast the importance of climatic forcings, environmental controls, and land management on peat formation and carbon sequestration. Workshop participants are preparing a manuscript that addresses these new research directions and highlights the relevance of peatland dynamics in land-surface models.
Further develop and promote the use of multi-proxy peatland records as paleoclimatic archives. The peat cores included in the C-PEAT database could be used in conjunction with those from other archives such as lake sediments, tree rings and ice cores. For example, there is an array of traditional and novel peat-based proxies for temperature and hydrology. Of particular interest to the C-PEAT group is (a) a combination of compound-specific stable isotope measurements to back-calculate changes in rainfall regimes (Amesbury et al. 2015), (b) a suite of novel organic biomarkers that are sensitive to temperature and pH or that provide insight into the carbon cycle (Naafs et al. 2017), and (c) the integration of more-traditional proxies such as plant macrofossils and testate amoebae into process-based peat models such as DigiBog (Baird et al. 2012) and the Holocene Peat Model (Frolking et al. 2010) to further understand the encoding of these proxies into the peat matrix over time. Many of these datasets are already integrated to WDS-Neotoma.
 |
|
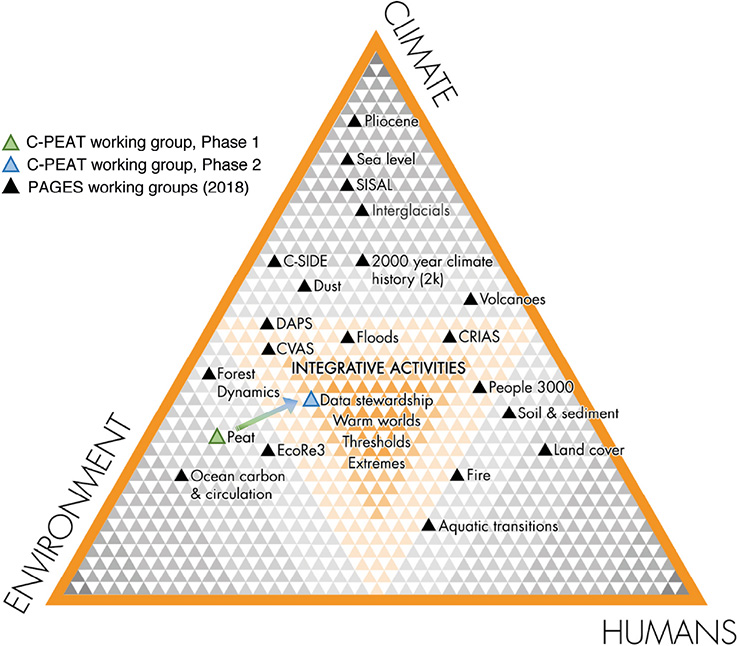
Figure 1: A new, more-integrative place for the C-PEAT working group within PAGES’ science structure. This change for Phase 2 reflects the inclusion of tropical and extra-tropical peatlands, which are largely impacted by land management, and the development of new peat-based paleoclimatic proxies. |
Thus far, the C-PEAT working group has been associated with “environmental research” in the PAGES science structure (Fig. 1), as peatlands are key biosphere ecosystems that interact with the climate and introduce feedbacks into the Earth system. While this remains true, Phase 2 brings peat towards the center of the triangle (Fig. 1), as this working group is integrating land-use change and natural disturbance.
acknowledgements
We thank PAGES, INQUA, and Texas A&M’s Department of Geography for financial and logistical support.
affiliations
1Department of Geography, Texas A&M University, College Station, USA
2Department of Geography, College of Life and Environmental Science, University of Exeter, UK
contact
Julie Loisel: julieloiseltamu.edu (julieloisel[at]tamu[dot]edu)
references
Amesbury MJ et al. (2015) Geochim Cosmochim Acta 164: 161-174
Baird AJ et al. (2012) Ecohydrology 5: 242-255
Charman DJ et al. (2012) Biogeosciences 10: 929-944
Frolking S et al. (2010) Earth Sys Dyn 1: 1-21
Naafs BDA et al. (2017) Geochim Cosmochim Acta 208: 285-301
Nicki Whitehouse1, M. Madella2 and F. Antolín3
Barcelona, Spain, 21-23 May 2018
The LandCover6k working group investigates whether prehistoric and historic human impacts on land cover (i.e. anthropogenic land-cover change due to land use - LULC) were sufficiently large to have a significant impact on regional climates. This workshop focused on reconstructing land use for the European continent by synthesizing farming and landscape management patterns derived from the archaeological record, for a 6000 BP time slice. We were also interested in the location of settlements, field systems, and industrial activities. The main objectives of the workshop were to:
(i) Review LU classifications developed for other regions (Morrison et al. 2018), ensure these are usable for Europe at 6000 BP, and develop geography-specific lower-classification categories;
(ii) Establish regions with good datasets for LU and produce preliminary LU maps following the methodology of Morrison et al. (2018);
(iii) Identify high-resolution case-study areas for detailed LU mapping;
(iv) Agree on a publication strategy and subsequent analyses.
 |
|
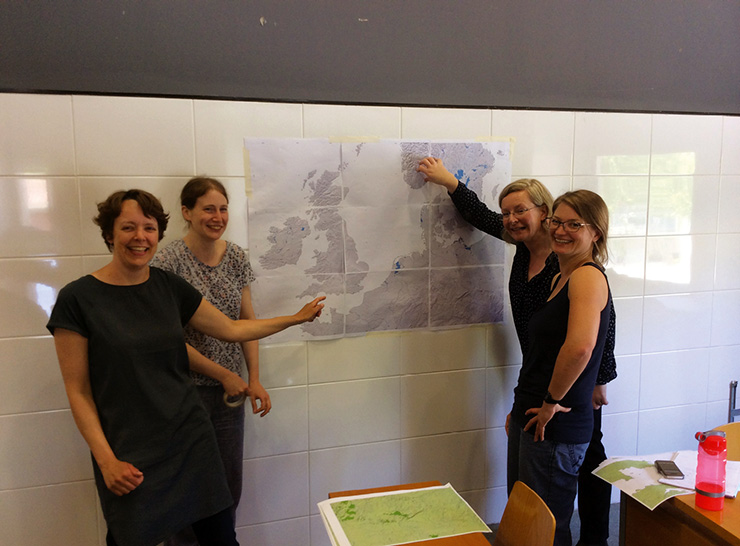
Figure 1: Participants from the Northern Europe Group mapping their region. Photo credit: Welmoeud Out. |
Workshop outcomes
Twenty-two European archaeobotanists, archaeozoologists, chronologists, GIS, climate and land-use modelers attended the workshop. In addition, some researchers joined the meeting remotely via an internet stream, or sent materials, and others have been approached since the meeting to contribute data from under-represented regions.
The first day and a half was devoted to expectations of the archaeological and modeling communities for the land-use development and best approaches towards synthesizing and reconstructing land use at a continental scale. There was considerable enthusiasm from the European community to be involved and contribute data. It was agreed that land maps should be developed from archaeological-site data points and then aggregated at a sub-regional level. Metadata should be fully accessible and traceable, and underpinned by high quality chronological data. This will allow an evaluation of uncertainty, ensure the work is archaeologically accurate and allow future revisions. A European database of 14C dates developed by Marc Vander Linden (University of Cambridge, UK) was made available to facilitate mapping. Discussion also focused around “rules for interpolation” between data points and “unknown” areas, data quality and traceability. Each LU area should be assigned a percentage land-use value as far as possible, allocated at a regional or country level, based on expert knowledge; proportions of crops and animals will be assessed for particular regions.
There were extended discussions on LU categories (Morrison et al. 2018), which led to the addition of a LU category for “no evidence” and adjustments to lower-level categories for hunting-foraging-fishing, pastoralism and agriculture to fully reflect the European evidence. Further work around definitions will be needed. The final half-day of the workshop was spent undertaking initial top-level mapping on printed versions of gridded maps.
The main objectives of the workshop were met; more time was focused on item (i) than initially envisaged. However, this allowed the group to develop the necessary protocols for step (ii) and (iii). We are now progressing with step (ii) and have established areas for which there is good data coverage (iii). Datasets are well distributed across Europe, but further work will be needed to fill in data gaps and develop protocols for data quality.
Next steps
Maps and 14C datasets have been transferred into a simple GIS database to produce preliminary LU maps. These will need considerable work and refining. A follow-up meeting is planned for 29-30 January 2019 at the Research Center for Wetland Archaeology, in Hemmenhofen, Germany.
We are keen for interested archaeologists to join the group, especially from regions that are currently less-well represented (e.g. France, some areas of North and central Eastern Europe, and southern parts of the Mediterranean). Visit our website for more information: pastglobalchanges.org/landcover6k
affiliations
1School of Geography, Earth and Environmental Sciences, Plymouth University, UK
2ICREA and Department of Humanities, Universitat Pompeu Fabra, Barcelona, Spain
3Integrative Prehistory and Archaeological Science (IPAS), University of Basel, Switzerland
contact
Nicki Whitehouse: Nicola.whitehouseplymouth.ac.uk (Nicola[dot]whitehouse[at]plymouth[dot]ac[dot]uk)
references
Daniele Colombaroli1, J. Mistry2, A. Milner1, B. Vannière3, C. Adolf4, D. Hawthorne5 and the Global Paleofire Working Group (GPWG2)
Egham, UK, 4-7 September 2018
Integration of ecosystem science and applied research in ecosystem management is a high priority and key challenge for the science-policy interface, as recently highlighted by the Intergovernmental Science-Policy Platform on Biodiversity and Ecosystem Services (IPBES 2018). A more direct involvement of stakeholders and policymakers into the research agenda requires new approaches for knowledge transfer from the academic to the stakeholder community, as also emphasized during previous workshops organized by the Global Paleofire Working Group GPWG2 (Blarquez et al. 2018; Courtney-Mustaphi et al., this issue).
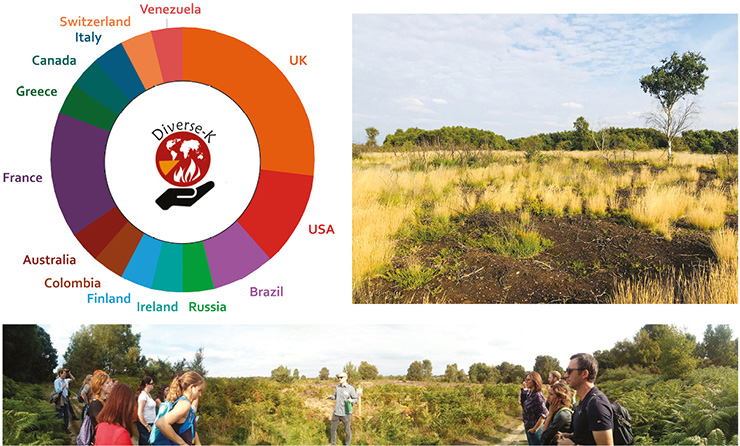
Thirty participants from 15 countries (Fig. 1) met at Royal Holloway University of London, UK, to discuss ongoing challenges on biodiversity conservation and fire policy, considering three approaches: (a) long-term ecology – informing on ecosystem responses to environmental change across regions and timescales (paleoecology-informed conservation); (b) local, traditional, and indigenous-knowledge systems on fire management that maintain biodiversity (community-owned and -driven conservation); and (c) conservation challenges and agendas defined by stakeholders and policymakers (stakeholder-driven research). The combination of long-term ecology with traditional knowledge represents a novel and alternative approach to promote a more sustainable management practice of present ecosystems under current threats, and fosters the dialogue between the different disciplines.
 |
|
Figure 1: (Left) Distribution of the participants' home countries. (Right and bottom) Guided discussion on fire risk and lowland heath-conservation priorities at Chobham Common, the largest National Nature Reserve in South East England. Photos: A. Milner and D. Colombaroli. |
Before the workshop, conservation and fire-management evidence priorities were identified together with the UK Government Department for Environment, Food and Rural Affairs , and included: (1) the impact of changing climate and land use on fire regimes; (2) ecosystem recovery after fires of different severity; (3) the optimum fire regimes needed to achieve management objectives for biodiversity conservation; and (4) the effects of prescribed burning (and other land-management practices) on wildfires. The participants discussed examples of fire policies and relative impacts based on their regional expertise and on a field discussion in Chobham Common (Fig. 1). Different sub-groups then compiled evidence-based case studies on past ecosystem legacies, the role of local ecological knowledge in maintaining landscapes (Mistry and Berardi 2016), post-fire ecosystem dynamics, and burning conditions that optimize biodiversity across ecosystems (Colombaroli et al. 2013). This approach also highlighted potential conflicts in conservation targets for specific regions (natural vs cultural; e.g. Jackson and Hobbs 2009), and the need to anticipate new challenges in a future warmer world (Fischer et al. 2018). The participants produced a first draft of a policy brief summarizing best practices for sustainable ecosystem management, including how transdisciplinary knowledge can inform fire management and policy, and highlighted future priorities to foster effective science-policy knowledge exchange in this region. In addition, a group of early-career researchers focused on the compilation of a systematic review protocol to summarize the available evidence on the effects of climate change and land use on fire regimes.
Adapting fire policy to more sustainable practices for specific regions requires approaches that focus primarily on the most urgent challenges set by policymakers (policy-driven research), in co-production with diverse knowledge and expertise (here paleoecology, cultural geography and policymakers). This dialogue can lead to the implementation of decision tools for policymakers, and further promote the integration of long-term ecology in more applied science (Willis and Birks 2006). The Global Paleofire Working Group, through the Diverse Knowledge framework (DiverseK), will continue to build a strong network of researchers, land managers, practitioners, and policymakers to tackle ongoing challenges in ecosystem management and biodiversity conservation.
acknowledgements
Funding has been provided by PAGES, the Quaternary Research Association (QRA), and Chrono-environnement at Université Bourgogne Franche-Comté. The full meeting program is available at gpwg.paleofire.org/event/focus-group-3-workshop-london-2018. Additional material is on our Twitter account (@diverse_K). The motivation for this workshop was inspired by Cathy Whitlock, the GPWG community (gpwg.paleofire.org) and previous PAGES meetings in 2012 by K.J. Willis and E. Jeffers in Oxford, UK, (PAGES Focus 4 Biodiversity Theme Workshop, pastglobalchanges.org/calendar/1006) and in 2017 in Bern, Switzerland, by H. Fischer, K. Meissner and A. Mix (PAGES Warmer Worlds Integrative Activity workshop, pastglobalchanges.org/calendar/128556).
affiliations
1Centre for Quaternary Research, Department of Geography, Royal Holloway University of London, UK
2Department of Geography, Royal Holloway University of London, UK
3UMR Chrono-environnement (CNRS), Université Bourgogne Franche-Comté, Besançon, France
4Department of Zoology, University of Oxford, UK
5AOC Archaeology Group, Edinburgh, UK
contact
Daniele Colombaroli: daniele.colombarolirhul.ac.uk
references
Blarquez et al. (2018) PAGES Mag 26(1): 40
Colombaroli D et al. (2013) Divers Distributions 19: 157-170
Fischer H et al. (2018) Nat Geo 11: 474-485
Jackson S, Hobbs RJ (2009) Science 325: 567-569
Colin J. Courtney-Mustaphi1,2,3, D. Colombaroli4,5, B. Vannière6, C. Adolf7, L. Bremond8,9, J. Aleman10 and the Global Paleofire Working Group (GPWG2)
Nairobi, Kenya, 19-22 July 2018
Patterns of fire are changing across African savannahs, rainforests, fynbos, woodlands, and Afroalpine and montane forests, with direct environmental and socio-ecological consequences. Fire variability has implications for biodiversity (Beale et al. 2018), vegetation patterns, grazing quality, carbon emissions, protected area management, and landscape heterogeneity.
Fire is a crucial component of savannah functioning and structure and is essential for maintaining its biodiversity. Long-term records are key to understanding drivers of fire variability and contextualize recent and ongoing land-use changes that altered fire responses to climate and vegetation changes (e.g. Ekblom and Gillson 2010, Colombaroli et al. 2014). As indigenous forest loss continues and modification through selective harvesting and land-use encroachment accelerate forest changes, the importance of historical disturbance regimes is increasingly relevant for assessing past ranges of variability and to define management targets that support more resilient socioecological systems (Whitlock et al. 2018). But how can the research community engage and integrate with land-management practitioners and policy developers? And how can we promote knowledge transfer and collaborative capacity between the international community and the next generation of African scientists?
 |
|
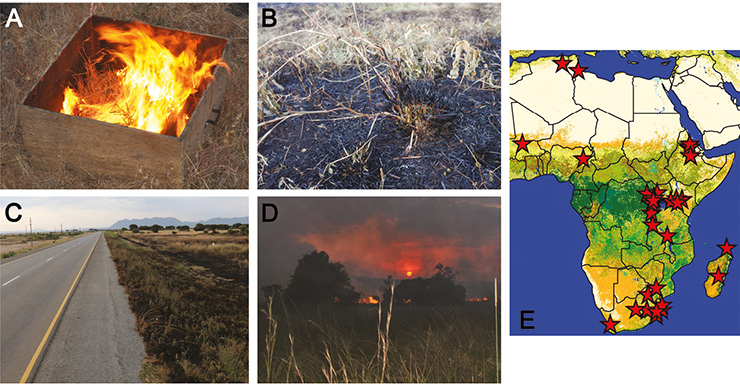
Figure 1: (A) Experiments, like this 1x1 m controlled grass burning, help relate vegetation-fire-charcoal proxy measurements to paleoecological charcoal records. (B) Residual culms and mainstems from grazing and burning that will regrow leaves and inflorescence. (C) Roads and linear infrastructure increase fragmentation altering spatial complexity for fires. (D) Grass and woody fuels burning near Klein’s Camp, Serengeti National Park, Tanzania, 16 July 2016. (E) Published charcoal records that participants identified during a literature review, including records absent from the Global Charcoal Database (Map source: due.esrin.esa.int/page_globcover.php). Photographs: Colin Courtney-Mustaphi. |
Such themes were explored and discussed during a GPWG2 workshop following the African Quaternary Association (AFQUA) conference. The workshop gathered 18 participants from 12 countries, including 10 researchers from Africa-based institutions. It opened with introductory lectures and laboratory practical courses on study-site selection, sampling techniques, laboratory preparation and charcoal morphology analyses, and a discussion on charcoal calibration approaches for African sites (Ekblom and Gillson 2010; Adolf et al. 2018; Hawthorne et al. 2018; Fig. 1). Participants were introduced to quantitative paleoenvironmental data analysis techniques using R; those included reconstructing savannah fire responses to precipitation and biomass using Generalized Additive Models (GAMs) with data from Lake Naivasha, Kenya (Colombaroli et al. 2014). Dedicated breakout sessions involved data mining using the Global Charcoal Database (GCD) and examinations of spatiotemporal knowledge gaps, notably for western and central Africa, where spatial coverage is scant and several published records need to be imported in the GCD (Fig. 1e). The data gaps are also apparent from the driest and wettest ends of the precipitation gradient, and mostly lacking from mangrove, Afroalpine, and dry woodland study sites. Furthermore, only a limited number of study sites are located near archaeological sites, limiting analyses on human-environment interactions (Marchant et al. 2018). The discussion highlighted the need to develop high-quality charcoal series that account for potential biases in sediment accumulation and related chronological uncertainties (Colombaroli et al. 2014).
Finally, participants discussed the contribution of paleofire data to land-management applications (Fig. 1), including conservation and fire policy; a theme specifically addressed by the GPWG DiverseK framework-workshop (see Colombaroli et al., this issue). Participants were assigned sub-regions and discussed challenges and alternatives for managing fire as a component in socio-ecological systems (Whitlock et al. 2018). The discussion highlighted how resource management in the Menengai Forest, Kenya, and areas of southwest Madagascar are impacted by logging, unauthorized burning, resource extraction, and invasive species; while in the Bale Mountain National Park, Ethiopia, the existing contestation between pastoralists and conservation requirements necessitates new approaches to maintain ecosystem services and promote co-benefits. Approaches combining paleoecology and qualitative, local content optimize bidirectional knowledge transfers and encourage long-term engagement between the GPWG2 and new active members of the research community.
affiliations
1Department of Environmental Sciences, University of Basel, Switzerland
2Department of Archaeology and Ancient History, Uppsala University, Sweden
3Environment Department, University of York, UK
4Department of Geography, Royal Holloway University of London, UK
5Institute of Plant Sciences, University of Bern, Switzerland
6CNRS-UMR Chrono-environnement, Université Bourgogne Franche-Comté, Besançon, France
7Department of Zoology, University of Oxford, UK
8Institut des Sciences de l'Evolution de Montpellier (CNRS, IRD, EPHE), Université de Montpellier, France
9École Pratique des Hautes Études, PSL Research University, Paris, France
10Département de Géographie, Université de Montréal, Canada
contact
Colin J. Courtney-Mustaphi: colin.courtney-mustaphiunibas.ch (colin[dot]courtney-mustaphi[at]unibas[dot]ch)
references
Adolf C et al. (2018) Glob Ecol Biogeog 27: 199-212
Beale C et al. (2018) Ecol Lett 21: 557-567
Colombaroli D et al. (2014) Glob Change Bio 20: 2903-2914
Ekblom A, Gillson L (2010) Holocene 20: 1063-1077
Hawthorne D et al. (2018) Quat Int 488: 3-17