PAGES Magazine articles
Matthew Toohey1, M. Sigl2, F. Ludlow3, A. N. LeGrande4 and K. J. Anchukaitis5
Volcanic eruptions are an awe-inspiring example of a natural driver of environmental change. At the local scale, erupted lava, ash and gases can have a drastic impact on the environment, with sometimes severe impacts on ecosystems, human health and economies. Global scale impacts can be produced by major volcanic eruptions, like those of Mt. Pinatubo (1991), or Tambora (1815). Such large-scale effects are due primarily to the injection of sulfur into the stratosphere, resulting in the formation of sulfate aerosols. The primary impact of these aerosols is a decrease in global temperature; however, the aerosols can also affect atmospheric circulation and precipitation patterns, leading to complex regional-scale climate impacts. Information on the climate anomalies resulting from volcanic eruptions in the Earth’s past therefore provides important insights for understanding the global and regional climate responses to external forcing agents. This in turn informs predictions of future climate change, such as that due to projected increases in anthropogenic greenhouse gases. Volcanically induced climate changes also provide valuable test cases for understanding the impact of climate variability on society.
A wealth of information is available from modern observations of recent volcanic eruptions, however, the number of such events is relatively small. To broaden our understanding of the impacts of eruptions, we rely on other sources, including geophysical records (e.g. tephra layers, ice cores, and climate proxies such as tree rings), as well as archeological and documentary evidence (Ludlow et al. 2013). While there have been great strides forward over recent decades in understanding the role of volcanic eruptions in climate, important open questions remain, and a wide range of interdisciplinary research on this theme is currently underway globally (see PAGES Magazine 23(2), LeGrande and Anchukaitis 2015).
The Volcanic Impacts on Climate and Society (VICS) working group will provide a forum for information exchange between the diverse research communities interested in volcanic eruptions and climate. VICS has three overarching scientific aims:
 |
|
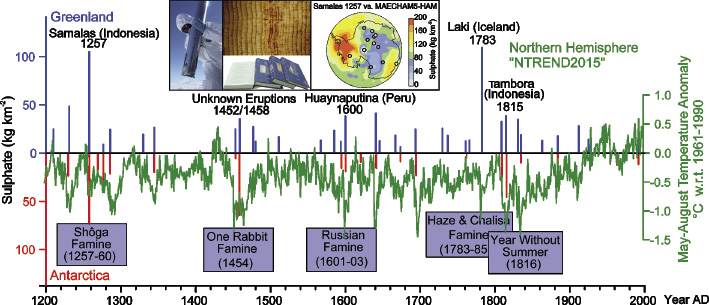
Figure 1: Enhanced atmospheric sulfate burden in the aftermath of large volcanic eruptions as reconstructed from ice cores in Greenland and Antarctica (Sigl et al. 2014, 2015) caused severe summer cooling in the northern hemisphere (Wilson et al. 2016), often associated with crop failures and famines (Puma et al. 2015). Inset suggests archives and tools that can be employed to advance our understanding of the volcanic impact on climate and societies. |
(1) Improve volcanic radiative forcing reconstructions. VICS will support the reconstruction of next-generation volcanic forcing datasets — focusing first on the past 2000 years, and eventually the full Holocene — and facilitate their use within modeling efforts such as the Paleo-Modelling Intercomparison Project (PMIP). Progress will incorporate improved knowledge of: volcanic sulfate deposition to Antarctica and Greenland (Sigl et al. 2014, 2015), stratospheric transport and deposition of sulfate (Toohey et al. 2013), and the microphysical evolution of aerosols.
(2) Improve understanding of volcanically-induced climate variability. Climate models, proxy-based climate reconstructions and instrumental data don’t always agree on the climate impact of major historic eruptions. VICS will support efforts to reconcile different sources of information, fostering collaboration between the proxy, cryosphere, and climate modeling communities; for example, concerning the validation of climate-model simulations. Special emphasis will be placed on the regional and seasonal character of volcanic climate responses and proxy records, the robustness of decadal-scale responses, dynamical responses linked to atmospheric circulation, the role of different boundary conditions (e.g. season and ENSO state), and the roles of eruption frequency versus magnitude.
(3) Improve understanding of societal impacts of volcanic eruptions. VICS will encourage studies into how major eruptions have impacted societies in the past, based on examination of historical, archeological and paleoecological records, and will also aim to develop tools to better frame climate-model results in terms of societal impacts. Such tools will be helpful in predicting societal impacts of major near-future eruptions; for example, there are major uncertainties concerning how a Pinatubo or larger Tambora-magnitude eruption might impact modern economies.
For more information visit the VICS website (www.pastglobalchanges.org/ini/wg/vics/intro), where you can also subscribe to the VICS mailing list.
affiliationS
1GEOMAR Helmholtz Centre for Ocean Research Kiel, Germany
2Paul Scherrer Institute, Villingen, Switzerland
3Trinity College Dublin, Ireland
4NASA Goddard Institute for Space Studies, New York, USA
5School of Geography and Development and Laboratory of Tree-ring Research, University of Arizona, Tucson, USA
contact
Matthew Toohey: mtoohey geomar.de
references
LeGrande AN, Anchukaits KJ (2015) PAGES Mag 23(2)
Ludlow F et al. (2013) Env Res Lett 8, doi:10.1088/1748-9326/8/2/024035
Puma MJ et al. (2015) PAGES Mag 23: 66-67
Sigl M et al. (2014) Nature Clim Change 4: 693-697
Sigl M et al. (2015) Nature 523: 543-549
Jennifer Clear1,2, R. Chiverrell3, R. J. DeRose4, I. Drobyshev5,6, J. Morris7 and M. Svoboda1
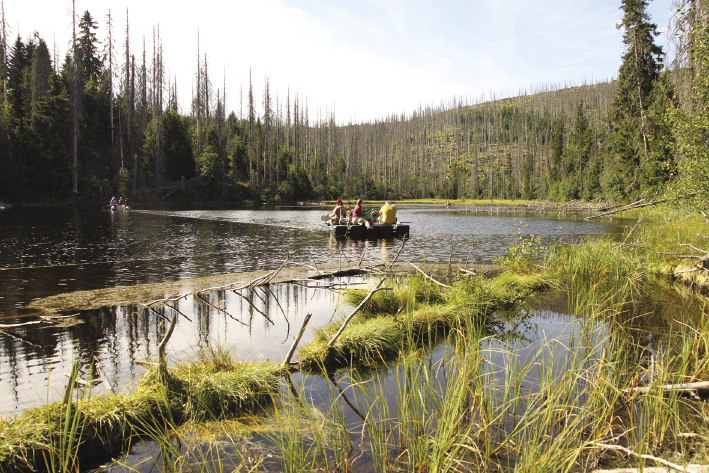
Forest dynamics are driven by an array of disturbances both natural (e.g. fire, windstorms, pathogens) and anthropogenic (e.g. clear cutting, selective logging, slash-and-burn) in origin. Evidence of these events is recorded in sediments (lakes and mires; Fig. 1), dendroecology (tree ring) records, and forestry inventory data. Natural disturbances are fundamental for vital functioning of forest ecosystems, and their impacts (e.g. frequency, severity, spatial pattern) change in response to increasing climatic and anthropogenic pressures. Understanding the disturbance dynamics of the past, present and future is critical research to better inform forest conservation and management (Morris et al. 2015).
 |
|
Figure 1: Lake sediment coring in a Spruce bark beetle disturbed catchment at Jezero Laka, Czech Repulic. Photo: Petr Kuneš. |
The primary aim of the new Forest Dynamics working group is data integration across disciplines, combining the knowledge gained from sediment geochemistry and paleoecology records with that from dendroecology, dendrochronology and monitored forest inventories. Such integration should improve our understanding of forest disturbance dynamics via better proxy calibration and analyses across these different environmental archives. Ultimately, information from these combined resources can contribute to enhance policymaking and land management.
Scientific objectives
The objectives of Forest Dynamics are to: (1) build a spatial geodatabase of reconstructed disturbance histories from the sedimentary and dendrochronological records; (2) combine these disturbance histories by compiling, extrapolating and integrating short-term data onto a common time series; and using well-dated and process-validated calibrated sediment data to extend the knowledge of forest disturbance dynamics from dendroecological to millennial timescales; and (3) assessing the emergent spatial and temporal patterns in forest dynamics related to fire, wind and pathogen disturbances in context of potential shifting drivers of vegetation dynamics (e.g. climate and humans).
Forest Dynamics aims to unite global research communities by linking the multiple temporal scales of paleoecology and bridging the scale difference between sedimentary records and dendroecological records of forest disturbances. Our integrated geodatabase will enable improved interpretation of forest disturbances and help identify limitations in current data coverage. By uniting existing and facilitating new research projects, we aim to improve the spatial coverage and temporal resolution of research into natural and anthropogenically driven forest dynamics.
The Forest Dynamics working group includes an expansive network of international scientists and key participants. We wish to expand our working group and seek global representation from scientists interested in all aspects of forest dynamics (forest succession and development, disturbance dynamics and catchment responses) including tropical, temperate and boreal forests.
Visit the Forest Dynamics website at: http://pastglobalchanges.org/ini/wg/forest-dynamics/intro and join our mailing list to keep up to date with our activities.
Upcoming activities
Workshop (spring 2017 Løvenholm Castle, Denmark) will bring together researchers with interests in forest disturbance (sedimentary geochemists, paleoecologists and dendroecologists) with the aim to bridge the gap between these research communities and produce a comprehensive review paper titled “Mind the gap: challenges and progress in forest disturbance science”.
AGU Fall Meeting (12-16 December 2016, San Francisco, USA) - B005 Alteration of disturbance-driven forest dynamics under a changing climate (Session 12625) https://agu.confex.com/agu/fm16/preliminaryview.cgi/Session12625
PAGES OSM (9-13 May 2017, Zaragoza, Spain) - Session 5: Disturbance dynamics across spatial and temporal scales: fire, wind, pathogens and post-disturbance run off as drivers of environmental change www.pages-osm.org/osm/sessions-osm
affiliationS
1Department of Forest Ecology, Czech University of Life Sciences, Prague, Czech Republic
2Department of Marine and Coastal Sciences, Rutgers University, New Brunswick, USA
3Department of Geography and Planning, University of Liverpool, UK
4Rocky Mountain Research Station, US Forest Service, Ogden, USA
5Swedish University of Agricultural Sciences, Southern Swedish Forest Research Centre, Alnarp, Sweden
6Chaire industrielle en aménagement forestier durable, Université du Québec en Abitibi-Témiscamingue, Rouyn-Noranda, Canada
7Department of Forest, Rangeland, and Fire Sciences, University of Idaho, Moscow, USA
contact
Jennifer Clear: jenniferlcleargmail.com
references
Morris et al. (2015) For Ecosyst 2, doi: 10.1186/s40663-015-0057-0
Boris Vannière1, J. R. Marlon2 and the GPWG2 Scientific Steering Committee3
Understanding the role of human-climate-fire linkages in the past and their influence on the biosphere is key in light of the major fire-regime changes that are occurring on most continents. In the past decade, the GPWG analyzed fire history using the Global Charcoal Database (GCD), and advanced our understanding of the controls and impacts of fire on a wide range of spatial and temporal scales (Marlon et al. 2016). Climate variability had a strong, persistent influence on Late Quaternary trends in fire through its direct impacts on the number and timing of ignitions and fire weather, and through its indirect impacts on vegetation changes and productivity. The complexities of vegetation change and its influences on fire, especially at regional scales and on multi-decadal to centennial timescales, however, remain poorly understood, as do the varied roles of humans (Vannière et al. 2016). The GPWG is therefore launching a new phase – GPWG2 – to more deeply examine the linkages between fires, climate-driven fuel changes, traditional human land uses, modern landscape management, and biodiversity conservation.
GPWG2 will involve fire modelers and stakeholders through projects and workshops, where we will jointly identify questions and approaches that prioritize science in support of sustainability, to provide evidence-based solutions to understanding and managing fire under rapidly changing global conditions. GPWG2 also includes a new focus on crowd-sourced data collection, which is being led by early-career researchers. Throughout Phase 2, we will continue to develop and promote the use of open-source tools, hypothesis testing, and “natural” and model experiments.
Organization and strategy
 |
|
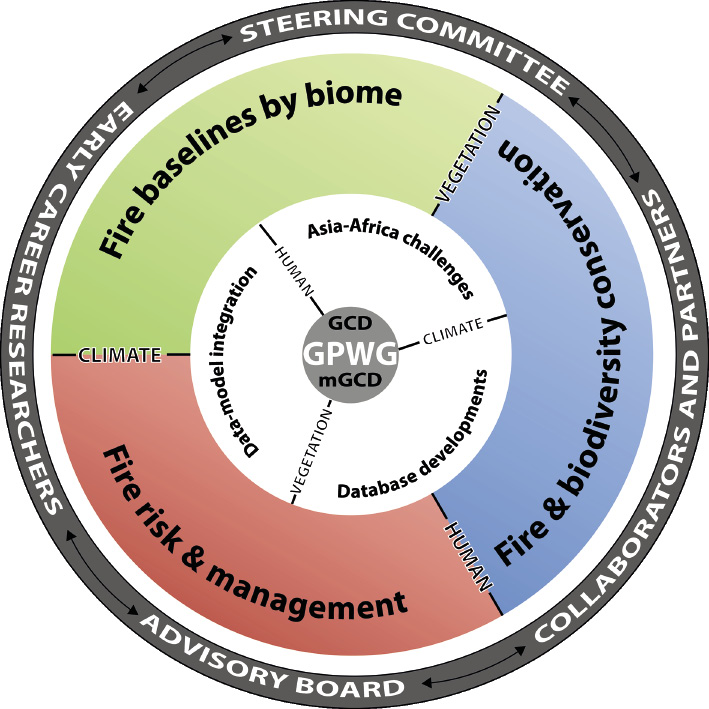
Figure 1: Structure of the Global Paleofire Working Group phase 2 activities. |
Three focus groups will address (A) similarities and differences in fire baselines at the biome level; (B) fire risk assessment and management practices to support planning at regional and finer scales; and (C) the role of fire in biodiversity conservation (Fig. 1). These groups will drive our workshop agendas over the next years, and will draw on and intersect with four cross-cutting initiatives. The initiatives, in turn, will provide the data, tools, and infrastructure to support the research of the focus groups. Specifically, the cross-cutting initiatives are:
- • Geographic data development for Asia and Africa, particularly to support fire and risk management, which are critical for human livelihoods and the future sustainability of ecosystem services there;
- • Syntheses and database development, including the launch of a new user-friendly website and database architecture to support paleofire science broadly (www.paleofire.org);
- • Paleofire data-model integration and links with other databases associated with LandCover6k, the European pollen database, Neotoma, LaACER, and more, to support data-model integration and multiproxy comparisons of fire from ice cores, for example;
- • Develop the modern Global Charcoal Database (mGCD), launched during the last GPWG workshop (Harvard Forest, October 2015), and containing surface samples obtained using a standardized protocol, to improve calibration of fire history records and data-model comparisons. This effort will also facilitate the quantification of past changes in fire activity and quantification of uncertainties in reconstructions.
Key components of GPWG2 as a whole, then, are fostering connections among individuals within the interdisciplinary community; promoting strong data practices, including development, access, management, and sharing, among the community; and facilitating the integration of teams, data, and tools to address the questions in fire science at a broad range of temporal and spatial scales. Importantly, GPWG2 is also committed to building capacity in developing countries and to promoting education and training of students and early-career researchers.
Further details on the organization of the working group, coordinators and key participants, and future activities can be found on the GPWG website: www.paleofire.org
Upcoming activities
The first workshop on “Fire history baselines by biome" will be near Bordeaux, France, 25-29 September 2016: www.gpwg.paleofire.org/fire-history-baselines-by-biome/ and there will be a follow up workshop on "Central European paleofire research" 5-8 December 2016: www.gpwg.paleofire.org/natural-and-human-driven-fire-regime-and-early-land-cover-changes-in-central-and-eastern-europe/. In 2017 and 2018 workshops are planned in Montréal (Canada), Bern (Switzerland), Eastern Africa and China.
A special issue of Quaternary international about "The fire-human-climate-vegetation nexus" is planned for winter 2016-2017.
affiliationS
1Chrono-environnement, CNRS - Université de Bourgogne Franche-Comté, Besançon, France
2School of Forestry and Environmental Studies, Yale University, New Haven, USA
3O. Blarquez (Université du Québec à Montréal, Montréal, Canada); D. Colombaroli (Institute of Plant Sciences and Oeschger Centre for Climate Change Research, University of Bern, Switzerland); A.-L. Daniau (Environnements et Paléoenvironnements Océaniques et Continentaux, CNRS - Bordeaux University, Pessac, France); M. Power (University of Utah, Salt-Lake-City, USA); J. Aleman (Yale University, New Haven, USA); D. Hawthorne (Trinity College Dublin, Ireland); C. Courtney-Mustaphi (University of York, UK)
contact
references
Shaun Lovejoy1 and CVAS Science committee2
"Weather is what you get, climate is what you expect". Is it, really? Consider a series of measurements of temperature along the time axis (Fig. 1A). If successive fluctuations tend to cancel each other (Fig. 1B), then averaging over longer and longer intervals smooths the signal; the averages converge more and more to an (apparently) well-defined mean value. However, if slow processes are forcing the system - for example changing the albedo or CO2 - the system changes constantly, so that this apparently convergent mean slowly varies, and choosing longer and longer periods to estimate it will be of no help. Such systems "wander"; they do not "relax" (Fig. 1C). Whether the system is relaxing or wandering is a matter of timescales: at weather scales or at the multi-millennium (climate) scales, it wanders. Predicting the future thus requires knowledge of the entire history of the evolution of the system.
 |
|
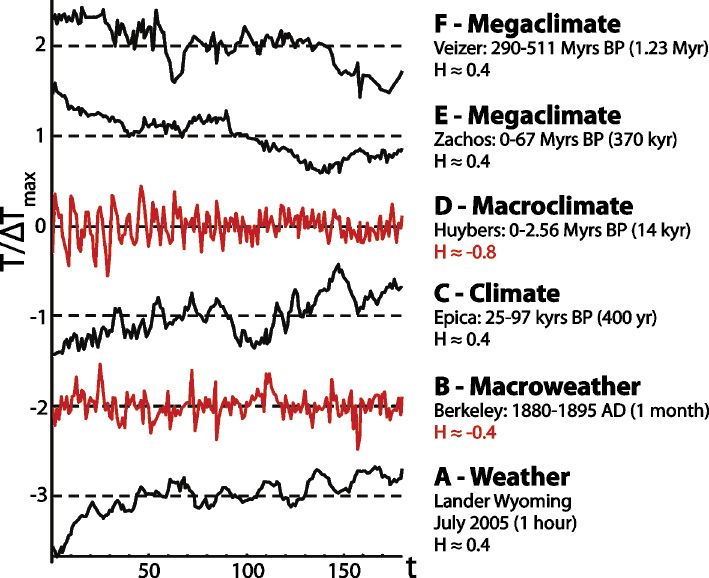
Figure 1: Representative series from each of the five scaling regimes over time periods of seconds to hundreds of millions of years, resolutions indicated in parenthesis with daily, annual detrending (when needed). Starting at the bottom, (A) the temperature seems to wander, the difference between two values tends to increase with lag: for the fluctuation ΔT over time interval (lag) Δt, analysis shows that ΔT ≈ ΔtH with H>0. (B) On the contrary, the Berkeley (global, land) series has successive fluctuations that tend to cancel; H<0 quantifies the rate. Moving upward, (C) the Epica Antarctic δ18O based paleo series is again “wandering”. (D-F) The top three are based on benthic isotopes. Each series had the same number of points (180) and was normalized by its overall range, and was offset by 1 unit in the vertical for clarity. The black curves all illustrate “wandering” cases with H>0, the red, “canceling”, with H<0. This figure is reproduced from Lovejoy (2015) where full details are given. |
Therefore, we need to take a fresh look at climate variability and theory, bringing together nonlinear geoscientists and climate scientists to think about effective ways to (i) characterize climate fluctuations and understand their causes and (ii) focus on these aspects when analyzing both climate data and climate models.
This is the objective of the new PAGES working group on “Climate Variability Across Scales: from centuries to millennia (CVAS)”. The group brings people together from both climate and nonlinear geophysics, with expertise in climate, paleoclimate, climate modeling, nonlinear physics, statistics and stochastics. The group’s common research agenda includes a number of themes around the variability of the climate, especially at centennial to multi-millennial scales.
Examples of research that the working group will highlight include: pitfalls while exploiting state-of-the-art paleoclimate data; the origin of long-memory processes; spatiotemporal variability; the gain between forcing and response at timescales of hundreds and thousand years; the carbon budget; atmosphere dynamics at the Last Glacial Maximum; and the role of long-memory processes for seasonal, annual and decadal forecasts, for extreme events and for global warming.
Specific activities include (i) the development of statistical and modeling tools for analyzing and comparing time series and spatial distributions, focusing on centennial and millennial timescales, (ii) the continued development of numerical packages and emphasis of training aspects, through maintained webpages and mini-courses, (iii) preparation of paleoclimate compilations (in both space and time), consistent with respect to their centennial and millennial scale variability, and to properly account for the role of variability in proxy recording on top of climate variability, and (iv) provision of open-source and easy to use software for above data analysis.
The group will hold its first workshop, titled "What do we know about multicentennial, multimillennial variability?"in Hamburg, Germany, from 28-30 November 2016.
affiliations
1Department of Physics, McGill University, Montreal, Canada
2CVAS members
contact
Shaun Lovejoy: lovejoyphysics.mcgill.ca
link
pastglobalchanges.org/cvas
references
Shaun Lovejoy1, M. Crucifix2 and A. de Vernal3
Montreal, Canada, 5-7 October 2015
 |
|
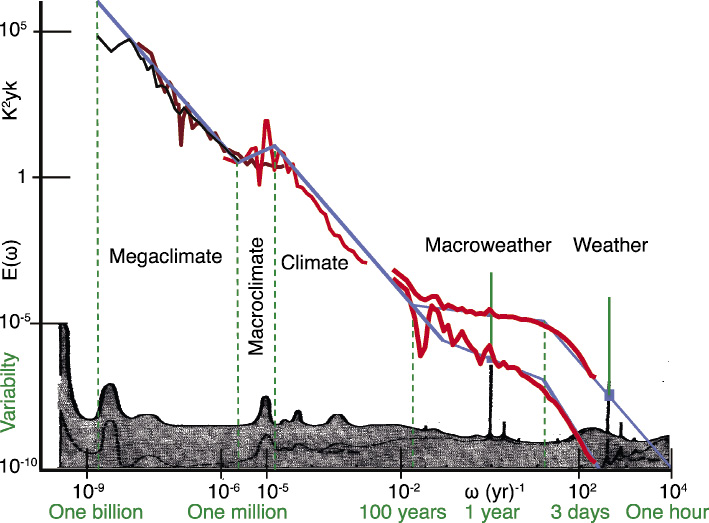
Figure 1: The temperature spectrum (E(ω)) giving the variance per interval of frequency (ω). The bottom (grey) is M. Mitchell’s “educated guess” showing the still dominant view of a fairly flat (white noise) “background” interspersed with spikes corresponding to important (quasi-periodic) processes (Mitchell 1976). Top curves are based on instrumental and paleo-data and their range differs from Mitchell’s guess by a factor of roughly 1015. In actual fact, the “background” accounts for nearly all the variance, so that the roles of foreground and background must be inverted: Mitchell must be “stood on his head”. To a first approximation, the spectrum can be divided into five power law regimes (linear on this log-log plot, blue reference lines). At the far right, there are two nearly parallel instrumental curves corresponding to the spectra of temperatures averaged over the globe (bottom) and over 5°X5° (top). Also shown (green) are the spikes corresponding to diurnal and annual cycles. Adapted from Lovejoy (2015), which has the full details of the data sources. |
Forty years ago, at the dawn of the revolution in paleoclimate data, it was believed that atmospheric variability essentially consisted of an uninteresting, spectrally flat (white noise) “background”, interspersed with periodic and quasi-periodic processes such as the diurnal and annual cycles, the Southern Oscillation and Milankovitch cycles (Fig. 1, bottom). Since then, instrumental and paleo data have shown this picture is wrong by a large factor (Fig. 1, top): the background displays nontrivial “variability across scales” that can be roughly divided into five power law (“scaling”) regimes. This state of affairs, underscoring the need for a fresh look at climate variability and theory, motivated this workshop.
The first objective was to get nonlinear geoscientists and paleoclimate scientists to think about effective ways to characterize climate fluctuations, understand their causes, and focus on these aspects when analyzing paleoclimate data; the second was to develop a common research agenda.
The workshop successfully brought communities together with expertise in recent climate (11 participants), paleoclimate (21), climate modeling (9), and nonlinear, statistical and stochastic mathematics (22). Participants, including 14 students, came from Canada, USA, Europe, Asia, and Latin America.
The ice core and marine paleoclimate experts in particular provided an authoritative account of what paleoclimate data can offer (E. Wolff, A. De Vernal), including various pitfalls (M. Kucera). The more applied-mathematics-inclined speakers discussed the origin of long-memory process (C. Franzke), their detection (K. Rypdal), and some difficulties (T. Nielsen). A wide range of timescales was covered from the instrumental periods permitting the study of spatio-temporal variability (H. Frederiksen). We now have enough accurate data to address questions that were previously impossible, such as the gain between forcing and response at timescales of hundreds of thousand years (P. Huybers). Specific physical mechanisms associated with the carbon budget (K. Kohfeld) or atmosphere dynamics at the Last Glacial Maximum (W. Roberts) were discussed. Finally, the value of a good knowledge of long-memory processes was emphasized for seasonal forecasts (R. Hébert), extreme events (S. Innocenti) or global warming (S. Lovejoy).
A number of common research themes emerged around the variability of the climate, especially at centennial to multi-millennial scales. For example, paleoclimate scientists tend to refer to modes of changes called “NAO-like” or “El-Niño like”, but how does it actually connect to the interannual modes of variability described by meteorologists? This variability must also be understood from a physical point of view and include the implications for climate change predictions and projections.
The overall result was the creation of a PAGES working group “Climate Variability Across Scales” (CVAS, see Program News article on page 32).
The workshop was co-organized and funded by McGill University and Université de Québec à Montréal. It received additional funding from PAGES and CLISAP (University of Hamburg).
affiliations
1Department of Physics, McGill University, Montreal, Canada
2Georges Lemaitre Centre for Earth and Climate Research, Université catholique de Louvain, Belgium
3GEOTOP, Université de Quebec à Montréal, Canada
contact
Michel Crucifix: michel.crucifixuclouvain.be
references
Emilie Capron1,2, A. Govin3, P. Bakker4, J.S. Hoffman4, M. Holloway1,5, G. Moseley6 and E. J. Stone5
Cambridge, UK, 9-11 November 2015
The Last Interglacial (LIG, ~129-116 ka) and Marine Isotopic Stage 11 (MIS 11, ~424-374 ka) stand out as warm interglacials in the context of the last 800 ka (PIGS Working Group 2016). During the first workshop of PAGES’ Quaternary Interglacials (QUIGS) working group, a multi-disciplinary group of 31 delegates assessed the current knowledge and research needs on the temporal and spatial patterns of climate forcing, responses and feedbacks during these warm extremes.
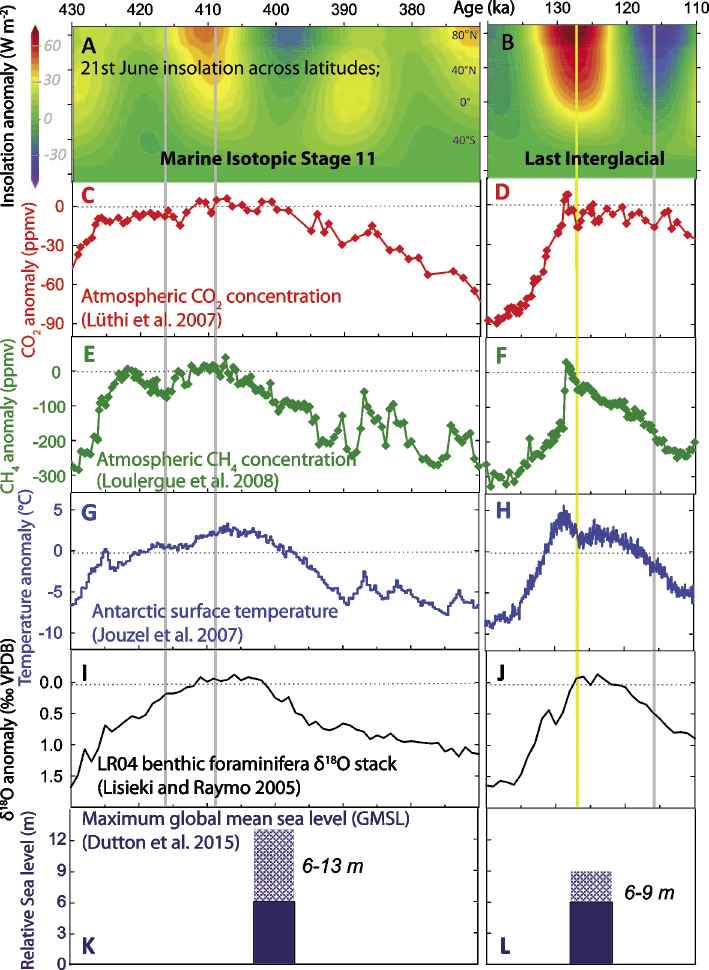
Presentations and discussions around recent work (new climate proxies and paleoclimatic records, data syntheses, and climate simulations) outlined known features of the LIG and MIS 11 climates. Overall, the LIG was characterized by sea level 6-9 m higher and warmer temperatures than present-day almost everywhere over the globe. However, peak warmth did not occur synchronously across the globe and it is unlikely orbital forcing explains the observed warmth at all locations. During MIS 11, sea level reached 6-13 m higher than present day and many locations experienced prolonged warmth. Still, the magnitude and drivers of enhanced warmth during LIG and MIS 11 remain unclear.
 |
|
Figure 1: Forcing and climatic records across Marine Isotopic Stage 11 and the LIG. Anomalies for A-J are relative to the average value of the last 1000 years, and to present day for K-L. Ice core records are displayed in panels C-H on the AICC2012 chronology (Bazin et al. 2012; Veres et al. 2012), the LR04 benthic δ18O curve on its independent chronology (Lisiecki and Raymo 2005). Vertical yellow line indicates 127 ka, the time interval chosen to run the coordinated CMIP6/ISMIP6/PMIP4 core simulation and the vertical grey lines represent the 116, 409 and 416 ka, time intervals for which additional PMIP4 sensitivity simulations will be run. (K-L) Maximum global mean sea level (GMSL) relative to present-day, uncertainties remain both in the amplitude (indicated by the shading) and in the exact timing of the GMSL peaks for each interglacial. |
The workshop also identified current limitations, critical missing datasets and research needs for both interglacials. We need to move toward quantitative estimates of MIS 11 and LIG global warmth and spatio-temporal climate evolutions, via new data compilations and advanced model-data comparisons. Future data syntheses should (1) better assess the seasonality of proxy records to improve interpretation of temperature reconstructions, (2) use robust and coherent chronologies amongst climatic records derived from different archives and a full integration of uncertainties on ages and tracers, (3) better integrate terrestrial records, and (4) be extended to parameters other than temperature (e.g. isotopic tracers). The latter is particularly important, since a number of climate models now have the ability to explicitly simulate climate proxies. Finally, diagnosing unambiguously the state of the Antarctic and Greenland ice sheets during these warm extremes remains a major challenge essential to assess their respective contribution to the recorded higher sea levels.
Setting guidelines for climate simulations to be performed during Phase 6 of the Coupled Model and Ice Sheet Model Intercomparison Projects (CMIP6, ISMIP6) and Phase 4 of the Paleoclimate Model Intercomparison Project (PMIP4) were also discussed. The coordinated CMIP6/ISMIP6/PMIP4 core simulation will be run at 127 ka, which was identified as the most appropriate time interval to determine LIG climate responses and feedbacks to strong insolation forcing (Fig.1). Simulated climate will be compared to data time series between ~128-125 ka to account for delays in climate responses as well as age uncertainties. The 127 ka experiment design will be detailed in a paper to be submitted later in 2016 to the Climate of the Past CMIP6 special issue. Additional sensitivity simulations will be performed within PMIP4 e.g. (1) 127 ka snapshot simulations will investigate the effect of (i) Heinrich event 11 freshwater input and (ii) an early West Antarctic Ice Sheet collapse, (2) a 116 ka snapshot simulation to explore glacial inception processes, (3) MIS 11 snapshot simulations at 416 ka and 409 ka.
The next QUIGS workshop in October (http://pastglobalchanges.org/calendar/upcoming/127-pages/1592-2nd-quigs-wshop ) will focus on the timing and shape of glacial Terminations.
affiliationS
1British Antarctic Survey, Cambridge, UK
2Centre for Ice and Climate, University of Copenhagen, Denmark
3Laboratoire des Sciences du Climat et de l’Environnement, Gif-Sur-Yvette, France
4Oregon State University, Corvallis, USA
5School of Geographical Science, University of Bristol, UK
6University of Innsbruck, Austria
contact
Emilie Capron: capronnbi.ku.dk
references
Bazin L et al. (2013) Clim Past 9: 1715-1731
Dutton A et al. (2015) Science 349, doi: 10.1126/science.aaa4019
Jouzel J et al. (2007) Science 317: 793-796
Lisiecki LE, Raymo ME (2005) Paleoceanography 20, doi:10.1029/2004PA001071
Lüthi D et al. (2008) Nature 453: 379-382
Alan Haywood1, H. Dowsett2, E. McClymont3 and U. Salzmann4
Leeds, UK, 29 February – 1 March 2016
Thirty members of the PlioVAR working group met to discuss high-resolution proxy records and strategies for new experiments using climate models that will enable an enhanced appreciation and understanding of climate variability during the Late Pliocene.
The workshop began with a series of presentations reviewing high-resolution proxy records for the Late Pliocene. Presentations then focused on previous studies using climate models to predict climate variability during the Pliocene to provide the necessary scientific context for the workshop.
From the presentations and subsequent discussions, a number of key scientific questions and priorities emerged that will provide a focus for activities of the working group and wider scientific community. These include:
1. Characterizing Pliocene “Warm” and “Cold” climate states at a gross level
How does the environment change during warm and cold climate states of the Late Pliocene? How do such variations between warm and cold compare to glacial/interglacial climate variability of the Late Pleistocene? What is the relationship between climate and CO2 variability during the Late Pliocene and how does this compare to the Late Pleistocene? Going beyond basic reconstructions of temperature, what broader Earth system responses can be linked with climate variability in the Late Pliocene? This will include consideration of ice-sheet behavior, as well as other factors such as dust, which can be addressed using a combined geological data and Earth System Modeling approach.
2. Understanding the M2 “glacial” event
 |
|
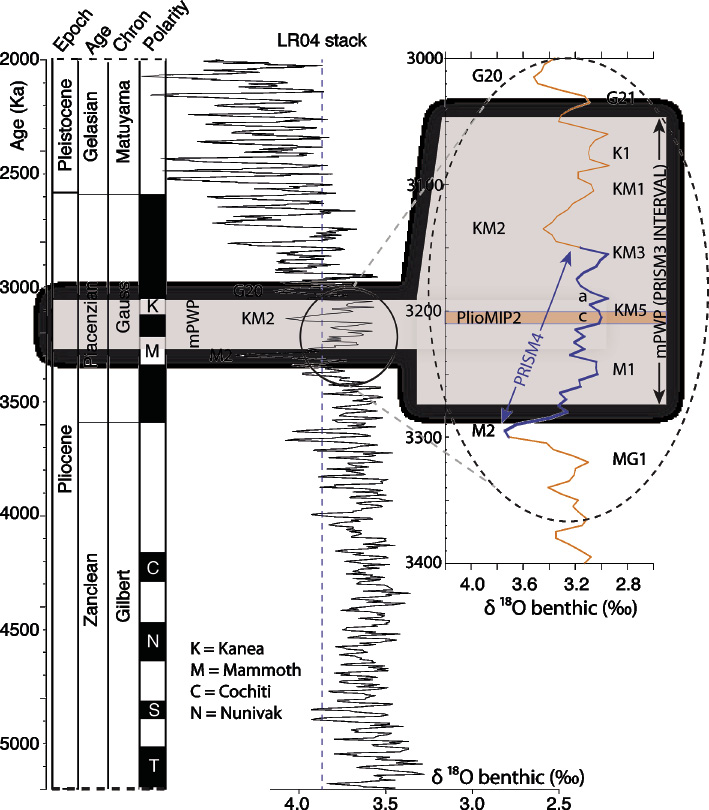
Figure 1: The PlioVAR interval of interest in relation to the long-term climate evolution of the late Pliocene. Shown is the global LR04 benthic oxygen isotope stack and timescale of Lisiecki and Raymo (2005). Vertical dashed line shows present day δ18O value. The mid-Pliocene warm period (mPWP) or PRISM3 warm interval (3.264-3.025 Ma) is shown by the horizontal shaded grey bar. The inset shows details for the mPWP and position of PlioVAR/PRISM4 and PlioMIP2 focus. Positions of Marine Isotope Stages MG1, M2, M1, KM5, KM3, KM2, KM1, K1, G21 and G20 are provided. |
Marine Isotope Stage (MIS) M2 is well represented as a positive isotope excursion in many benthic oxygen isotope records (Fig. 1). The event has been described as the failed onset of Northern Hemisphere Glaciation, but its character and significance remains highly uncertain. Targeted data acquisition will continue to improve our conceptual models of the climate transition into M2, including the difference between the response of the deep ocean and ocean surface. Climate modeling will be used to explore potential constraints on the M2 event using a well-known strategy of fingerprinting. Through a coordinated international effort, single forcing mechanisms of potential relevance to the M2 will be identified and incorporated into new experiments. These include orbital forcing, atmospheric trace gasses, plausible ice-sheet configurations, vegetation response and the importance of specific ocean gateways (e.g. Central American Seaway). The results of these simulations will be compared to available proxy data to determine what forcings, and forcing combinations, allow climate models to more reliably predict regional climate responses for the M2.
3. Understanding the climate transition from the M2 event to KM5
The transition out of the M2 event is just as enigmatic as the development of the event itself, but it heralded a period of relative climatic stability and equability until the end of MIS KM5 (Fig. 1). The period between M2 and KM5 intersects the warm interval selected for Phase 2 of the Pliocene Model Intercomparison Project (KM5c). Therefore, short high-resolution proxy time series from M2 to KM5 provide an opportunity to contribute towards data-model comparison and model evaluation exercises associated with PlioMIP, enhancing the capabilities of data-model synergy in the future.
PlioVAR is planning additional workshops during the next two years, as well as gathering at future EGU General Assemblies and AGU Fall meetings. Anyone interested in contributing to the project is encouraged to participate. The time, date and location of the meetings will be advertised through the PAGES website and e-news, and the PlioVAR mailing list.
affiliationS
1School of Earth & Environment, University of Leeds, UK
2U.S. Geological Survey, Reston, USA
3School of Geography, Durham University, UK
4Department of Geography, Northumbria University, Newcastle, UK
contact
Alan Haywood: earamhleeds.ac.uk
reference
Lisiecki LE, Raymo ME (2005) Paleoceanography 20, doi: 10.1029/2004PA001071
Jennifer Marlon
GPWG workshop, Petersham, USA, 27 September - 2 October 2015
The Global Paleofire Working Group (GPWG) met for a final synthesis workshop. The meeting reflected the culmination of five concurrent advances during the past decade, including an increase in wildfire salience globally and thus increased research motivation, the development of the Global Charcoal Database (GCD), the emergence of sophisticated global fire models, and the widespread adoption of open-source tools like the "R" programming language. The convergence of these factors enabled 36 researchers from 11 countries to address questions about fire on many temporal and spatial scales, producing insights that would have been unattainable prior to GPWG’s creation.
 |
|
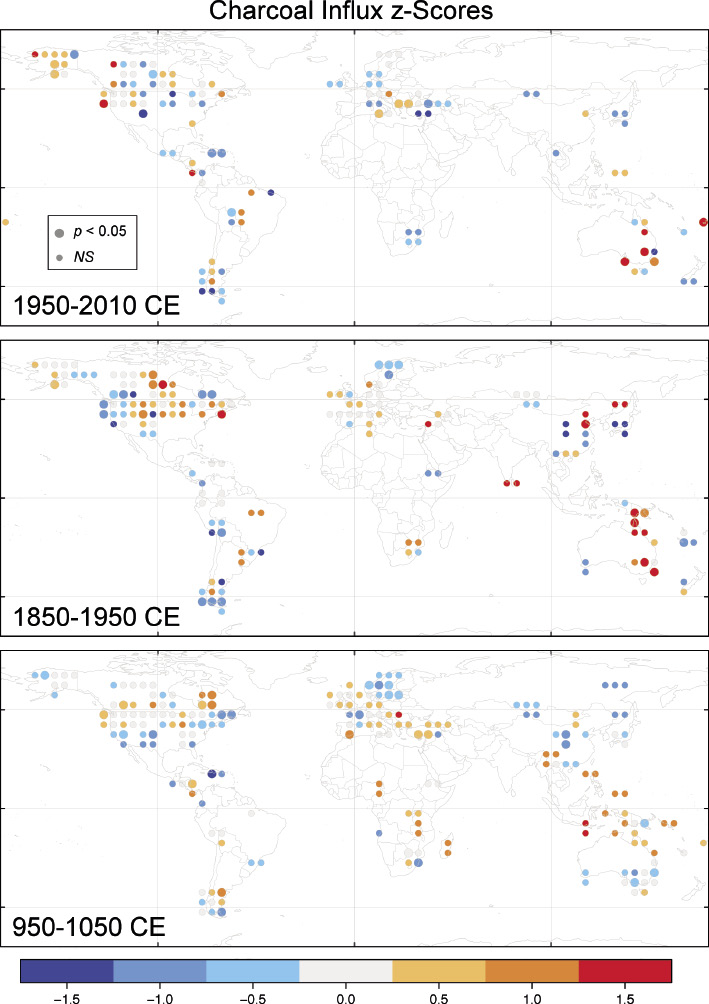
Figure 1: Spatially gridded biomass burning for 1950-2010, 1850-1950, and 950-1050 CE. Charcoal influx anomaly base period is 1000-1800 CE. From Marlon et al. 2016. |
In anticipation of the workshop, a method for gridding the GCD (Marlon et al. 2016) was developed to facilitate data-model comparisons (Fig. 1). The gridded maps provide new spatial information for specific intervals highlighted in the past millennium. Colored dots on the maps are anomalies that indicate increases or decreases in burning relative to average burning at that same location during the base period (1000-1800 CE). Recent human impacts on fire are particularly evident around the turn of the 19th century in eastern Asia, Australasia, and North America.
The limitation of working with anomalies was a key discussion topic at the workshop, prompting three initiatives aimed at quantitatively calibrating paleofire records. Currently, charcoal particles are measured using very diverse methods (e.g. counts, areas, weights, ratios). Using different quantification methods, coupled with the complexities of charcoal production, transportation, and deposition, limits meaningful comparisons across records from different locations. Standardizing paleofire records to a unitless dimension enables comparisons of relative changes through time, but the loss of units prevents analyses of spatial variability. Approaches using a statistical process model, a modern database of charcoal surface samples, and a series of regional multi-proxy comparisons were each developed to enable modeling of, or quantitative comparisons between, charcoal accumulation rates and independent estimates of area burned from fire-scar, historical, and satellite-based data. These efforts will elucidate the factors controlling charcoal accumulation, and may help to initialize and constrain fire simulations at multiple scales.
Workshop projects focused on human-fire interactions, fire ecology, and fire effects on global atmospheric chemistry and climate. Synthesizing anthropological evidence about human fire-use in traditional societies into a quantitative framework is needed to allow for its integration into global fire models. The current generation of models relies on simple assumptions between population density, fire ignitions, and fire suppression that draw from present-day data. Although modeling necessitates some simplification, synthesizing and incorporating data about cultural fire practices will enable model assessment and improvement not only for paleofire simulations, but also for simulations of past land-cover and land-use changes (e.g. through collaboration with PAGES’ LandCover6k working group). Such interdisciplinary research is essential for accurately understanding fire, human, and vegetation coupling with the climate system. The ultimate goal is to use this type of systematic and iterative approach of evaluating past fire activity and paleofire simulations to better contextualize contemporary fire management and understand future fire.
GPWG is continuing its work as GPWG2, with a growing emphasis on using data and models together to address research challenges in ecosystem and climate dynamics, and fire management, among others. Future meetings will be announced through the PAGES' website.
affiliationS
School of Forestry and Environmental Studies, Yale University, New Haven, USA
contact
Jennifer Marlon: jennifer.marlonyale.edu
references
Zicheng Yu1, D. Charman2, D. Beilman3 and J. Nichols4
1st C-PEAT workshop, New York, USA, 11-13 October 2015
Peats represent a large, and often active, carbon (C) pool in the land-atmosphere system. At present, these C-rich deposits contain about 600 Pg C, an amount similar to the total C stocks in all living biomass or in the atmosphere. The large size of the peat C pool and its concentration in a number of regions sensitive to climate change and human activities have promoted a heightened interest and increased research in peat C dynamics. Over the last decade, we have learned much about their distributions, histories and controls as a result of site-level, data synthesis, and modeling studies. However, large uncertainties remain in C sequestration rates and stocks, in our understanding of the underlying processes, and in our ability to project their future trajectories. PAGES' C-PEAT (Carbon in Peat on EArth through Time) working group was established in 2014 to coordinate peat C researchers to make important progress on data synthesis and process-level understanding from an integrated, global and Earth history perspective.
The C-PEAT launch workshop focused on three overarching themes: (1) the controls on peat formation (why is there peat?); (2) the estimates of peat C stocks and accumulation rates in Earth history; and (3) the future trajectories of peat C stocks. A total of 52 participants including many early-career researchers from 10 countries attended the workshop. Short presentations were followed by plenary and breakout group discussions. Details on the workshop program and presentations can be found on the workshop webpage (calendar/26502).
 |
|
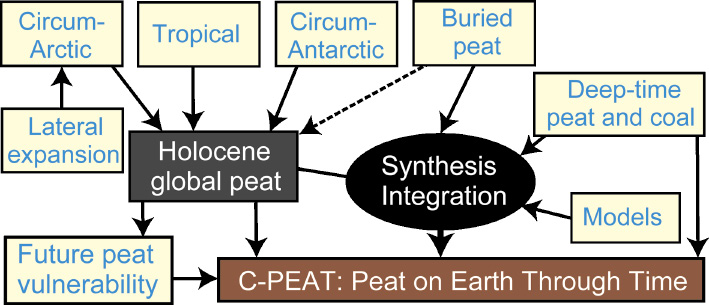
Figure 1: C-PEAT topical groups (yellow boxes) aim to facilitate the synthesis of data and knowledge of global Holocene peat C stocks and accumulation rates from northern, tropical and southern peatlands and their future trajectories, and to improve our understanding of peat accumulation processes and roles in Earth climate system over time through integrating Holocene and deep-time peat data and ideas. |
This workshop built on several recent synthesis efforts. The largest peatland region in the circum-Arctic, representing about 90% of global peat C stocks, was the focus of a workshop in October 2013 (Yu and Loisel 2014). A mini-workshop was held in October 2014 on circum-Antarctic peats, including Patagonian peatlands and Antarctic moss peat banks. To complement these efforts, this C-PEAT workshop focused on tropical peatlands, buried peats, deep-time peats and coals, and peat vulnerability (Fig. 1).
The breakout group discussions focused on these topics and the three overarching themes. In particular, a group of tropical peatland researchers discussed the best ways to generate an updated synthesis from tropical peatlands in different regions. Compiling information regarding buried peats under mineral soils or on continental shelves will help identify and quantify “missing” peat C as simulated in some models. A first ever involvement of several deep-time wetland and coal researchers in a peat workshop generated exciting discussions about approaches to estimate equivalent C accumulation rates from deep-time peat and coal deposits. Regarding peat C vulnerability, ideas emerged regarding rapid modern and future loss of tropical peats due to human activities, and potential for new peats in frontier regions, such as the Arctic and Antarctica, in response to a warmer and possibly wetter climate. On the question about why there is peat, we considered that reduced decay of initial organic matter is critical — often achieved by waterlogging (especially in tropical peatlands), by the presence of permafrost (including aerobic peatbanks in the High Arctic and Antarctica), or by cold environmental conditions. Also, recent progress in global peatland modeling (e.g. Stocker et al. 2014) and peat data synthesis (Loisel et al. 2014) will likely lead to more productive data-model comparisons.
During the next couple of years of C-PEAT Phase 1, these topical groups will coordinate and organize focused meetings and workshops to generate synthesis products. We plan a workshop focused on tropical peats in early 2017 and a synthesis workshop, for all C-PEAT members, in late 2017.
Acknowledgements
We thank PAGES, INQUA, NSF (Antarctic Earth Sciences grant 1246190) and Lehigh’s Department of Earth and Environmental Sciences for financial support, and LDEO for hosting the workshop.
affiliations
1Department of Earth and Environmental Sciences, Lehigh University, Bethlehem, USA
2Department of Geography, University of Exeter, UK
3Department of Geography, University of Hawaii at Manoa, Honolulu, USA
4Lamont-Doherty Earth Observatory at Columbia University, Palisades, USA
contact
Zicheng Yu: ziy2lehigh.edu
references
Loisel J et al. (2014) Holocene 24: 1028-1042
Andrea U. Kay, L.N. Phelps and J.O. Kaplan
Les Rasses, Switzerland, 2-6 November 2015
PAGES' LandCover6k working group aims to better understand the development and present state of global ecosystems as influenced by climate change and humans during the late Holocene. The interdisciplinary working group joins archaeologists with ecosystem modelers and paleoecologists to map land-cover and land-use change over the last 6000 years. This workshop was convened by LandCover6k members who are studying sub-Saharan Africa, a region that has been only superficially treated in most previous large-scale synthesis work, and whose researchers have been underrepresented in international collaborations.
The workshop focused on land-use change during the critical period of the African Iron Age transition (1000 BC-1500 AD) which is marked not only by the spread of agriculture and pastoralism across most of sub-Saharan Africa, but also by the development of modern African climate following the end of the African Humid Period.
The central methodology of LandCover6k is to employ archaeological and paleoecological archives to reconstruct past land cover and land use. Land use is not only influenced by environment but also is a product of historical, cultural, and societal factors that cannot be easily predicted. Kay and Kaplan (2015) therefore proposed a categorization of livelihoods in Iron Age Africa. Each category encompasses the subsistence, trade, technology, and political organization of societies that may be identified in archaeological and historical records. With this classification scheme, we set out to map the occurrence of the livelihood categories in space and time. We decided that a more focused case-study area would facilitate the mapping process, so West and Central Africa were chosen to test this process.
The goal of the ACACIA/LandCover6k workshop was to assemble experienced and early-career researchers who study West and Central Africa. Twenty-four researchers representing 14 institutions in nine countries set out to critique and improve both the existing classification system and a prototype set of maps. Assembling this group – experts in a range of fields including paleoecology, linguistics, archaeology, archaeobotany, archaeozoology, human geography, and modeling – in the same room for a focused discussion of the issues and best practices was the optimal way to address the questions set forth by our project.
The workshop was structured around presentations by participants in plenary, informal discussion sessions, and breakout workgroups. The workgroups were divided between live-editing sessions where we worked on the livelihood maps and a discussion group focused on pastoral systems. One of the first developments to emerge from the plenary discussions was the need to revise the classification system; in some cases, this meant consolidating the existing categories, but also adding new ones. For example, the former category called “Neolithic farmers” has been combined with the "Forager-horticulturalist" category, since the primary difference between the two was the type of crops being used, which is more environmentally than culturally determined. The combined category is now called Small-scale food producers (see Box 1). In addition to the categories revised above, we decided that political entities and their spheres of influence, metallurgical presence/ubiquity/industry, and domestic animal species distributions should be mapped in separate layers, independent of the agricultural categories.
 |
|
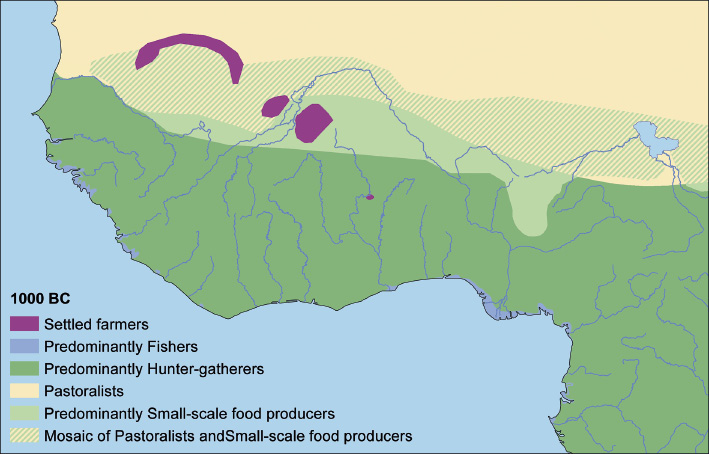
Figure 1: Simplified map of lifestyle category distribution for 1000 BC time slice. |
Mapping progress was made on several time slices, and a temporary pastoralism polygon (Fig. 1) was put in place until an improved version can be developed. Several plans were made for continued work including office visits in 2016, and collaboration on the publication of the final mapset and a database of African archaeological site data. There was also discussion on the planning of a pastoralism workshop in 2016, where pastoral experts will come together for a critical analysis of basic layers, and to incorporate more specialist knowledge in cultural and subsistence overlays.
|
• Hunter-gatherers • Fishers • Small-scale food producers • Settled farmers • Diversified farmers • Intensive diversified farmers • Wetland farmers • Upland rice farmers • Pastoralists* • Industrial production centers* *to be further revised and defined in future |
Box 1: Revised classification scheme for West and Central Africa
Acknowledgements
Funding for this workshop was provided by PAGES and the Swiss National Science Foundation.
affiliationS
Institute of Earth Surface Dynamics, University of Lausanne, Switzerland
contact
Andrea U. Kay: Andrea.Kayunil.ch
references