PAGES Magazine articles
Kees Klein Goldewijk1, M.-J. Gaillard2, K. Morrison3, M. Madella4 and N. Whitehouse5
LandCover6k general meeting, Utrecht, The Netherlands, 14-16 June 2016
The LandCover6k working group brought together a group of 50 scientists from various disciplines (archaeology, history, geography, paleoecology, land-use and climate modeling) to discuss progress and future plans to improve historical land-use descriptions for Holocene climate modeling. It was the group’s second general workshop - the first being the launch meeting in October 2015 (Gaillard et al. 2015). Alongside this, a first workshop of the historians and archaeologists group was held in 2015 (Morrison et al. 2016) and several regional workshops have also been organized. The aim of this second general workshop was to update the group on the progress made during the working group’s first year of activities, and plan the next steps.
LandCover6k’s rationale is that adequate incorporation of land cover in global and regional climate models is not satisfactory, and the effect of anthropogenic activities on global climate via bio-geochemical and bio-geophysical processes in the past is not yet fully understood (pastglobalchanges.org/landcover6k).
 |
|
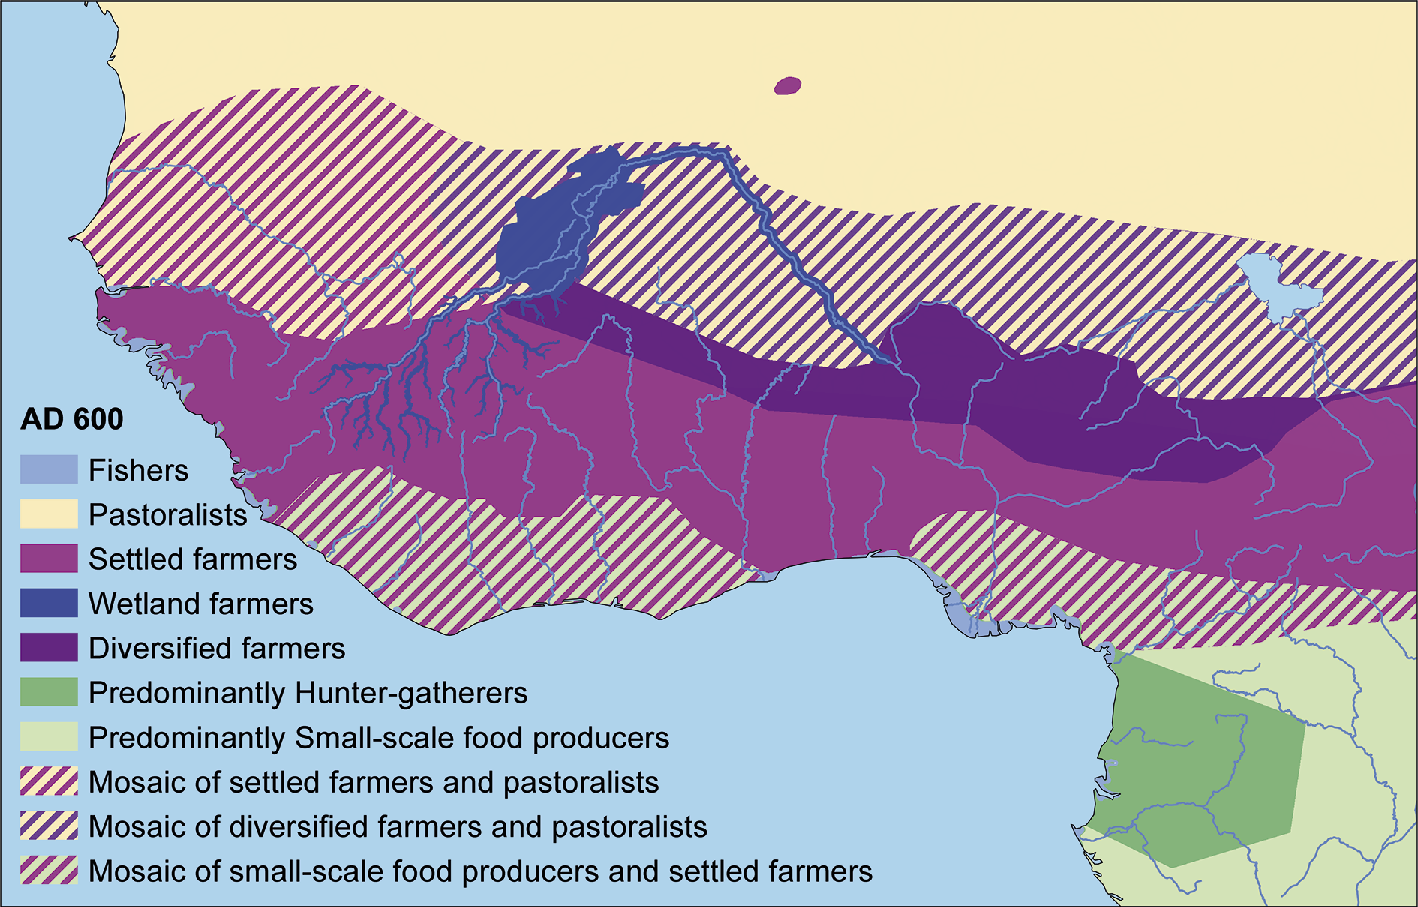
Figure 1: Livelihood distribution map for western Africa, AD 600 (Kay et al., unpublished data). |
An overview of modeled Holocene land-use changes was presented, based on a new version of the HYDE database (Klein Goldewijk et al. 2011) - updated with better data, irrigated and rain-fed cropland areas, and a distinction between managed pasture and extensive rangelands. The group reviewed patterns of HYDE, and regional comparisons were made with maps from historical geographers and archaeologists. One of the conclusions was that global allocation rules of HYDE do not perform well in the deep past due to a Eurocentric view of how people engaged in settlement and agriculture (expansion). Input from archaeologists and historians is clearly essential to this work and progress has already been made in southern and Central America, western Africa (see Fig. 1) and southern India. These regions are used as test cases of the land-use classification proposed by the LandCover6k working group (Morrison et al. 2016).
The group also reviewed progress made over the globe on regional pollen-based reconstructions of land cover) based on studies with the REVEALS model (Sugita 2007). REVEALS reconstructions for Europe except the Mediterranean and easternmost regions are already published (Trondman et al. 2015). REVEALS reconstructions will be available at the end of 2016 for parts of northern America, northern and temperate China, Siberia, and Cameroon.
Finally, current climate-modeling projects (e.g. within PMIP and CMIP) were reviewed and their needs in terms of past land-use and land-cover characteristics were discussed in the context of LandCover6k’s aims and goals.
Participants agreed that focus should be on testing the global scale land-use categorization established by the archaeologists involved in LandCover6k in southern America and southern India, and on the pollen-based reconstructions in regions where they are achievable within the relatively near future, i.e. northern America, southern and eastern Europe, Siberia, and India. Moreover, a case study is planned to incorporate empirical archaeological data from a single region into the HYDE system, in order to see whether this would produce a significant difference in modeled past agricultural patterns, and to evaluate whether that difference would significantly impact on climate change. It was also decided that Neotoma (www.neotomadb.org) will act as the major archive of all case studies from LandCover6k.
The LandCover6k working group will continue to be present at many international conferences, organizing sessions and presenting scientific results. Forthcoming events are the European Geosciences Union Assembly 2017, and PAGES’ 5th Open Science Meeting (OSM). The third general workshop of LandCover6k will be held in conjunction with the OSM on 16-17 May 2017 in Zaragoza, Spain. For more details, see: pastglobalchanges.org/calendar/127-pages/1637
affiliations
1Copernicus Institute of Sustainable Development, Utrecht University, The Netherlands
2Department of Biology and Environmental Science, Linnaeus University, Kalmar, Sweden
3Department of Anthropology, University of Pennsylvania and the Museum of Archaeology and Anthropology, Philadelphia, USA
4Department of Humanities and ICREA, Universitat Pompeu Fabra, Barcelona, Spain
5School of Geography, Earth and Environmental Sciences, Plymouth University, UK
contact
Kees Klein Goldewijk: c.g.m.kleingoldewijk uu.nl
uu.nl
references
Gaillard M-J et al. (2010) Clim Past 6: 483-499
Gaillard M-J et al. (2015) PAGES Mag 23: 81
Klein Goldewijk K et al. (2011) Glob Ecol Biogeogr 20: 73-86
Morrison K et al. (2016) PAGES Mag 24: 40
N’dji dit Jacques Dembele
Bamako, Mali, 26-30 September 2016
Since 2009, WAQUA (West African Quaternary Research Association) has been promoting Quaternary research in West Africa by organizing meetings for researchers involved in Quaternary science.
One of the main issues raised during these meetings is the absence of contributions from West African researchers to the understanding of paleoenvironmental conditions in the region, because of the lack of trained Quaternary scientists. To help address this issue, WAQUA organized a training session for 60 early-career scientists and students from the West Africa region. Attendees were mainly archaeologists, geographers, historians, and botanists, from Cote d’Ivoire, Benin, Mali, Niger and Nigeria.
The four invited speakers discussed Quaternary palynological methods (Chantal Kabonyi, Democratic Republic of Congo), analysis of palynological data (Monique Tossou, Benin), dendrology (Ntamwira Miranda, Democratic Republic of Congo) and quaternary sediments and geomorphological evidences (N’dji dit Jacques Dembele, Mali).
The workshop focused on seven topics that were addressed during the five days. Day one introduced the stratigraphic framework of the Quaternary and the geomorphological evidences of Quaternary paleoenvironments. These presentations were followed by debates and discussions.
 |
|
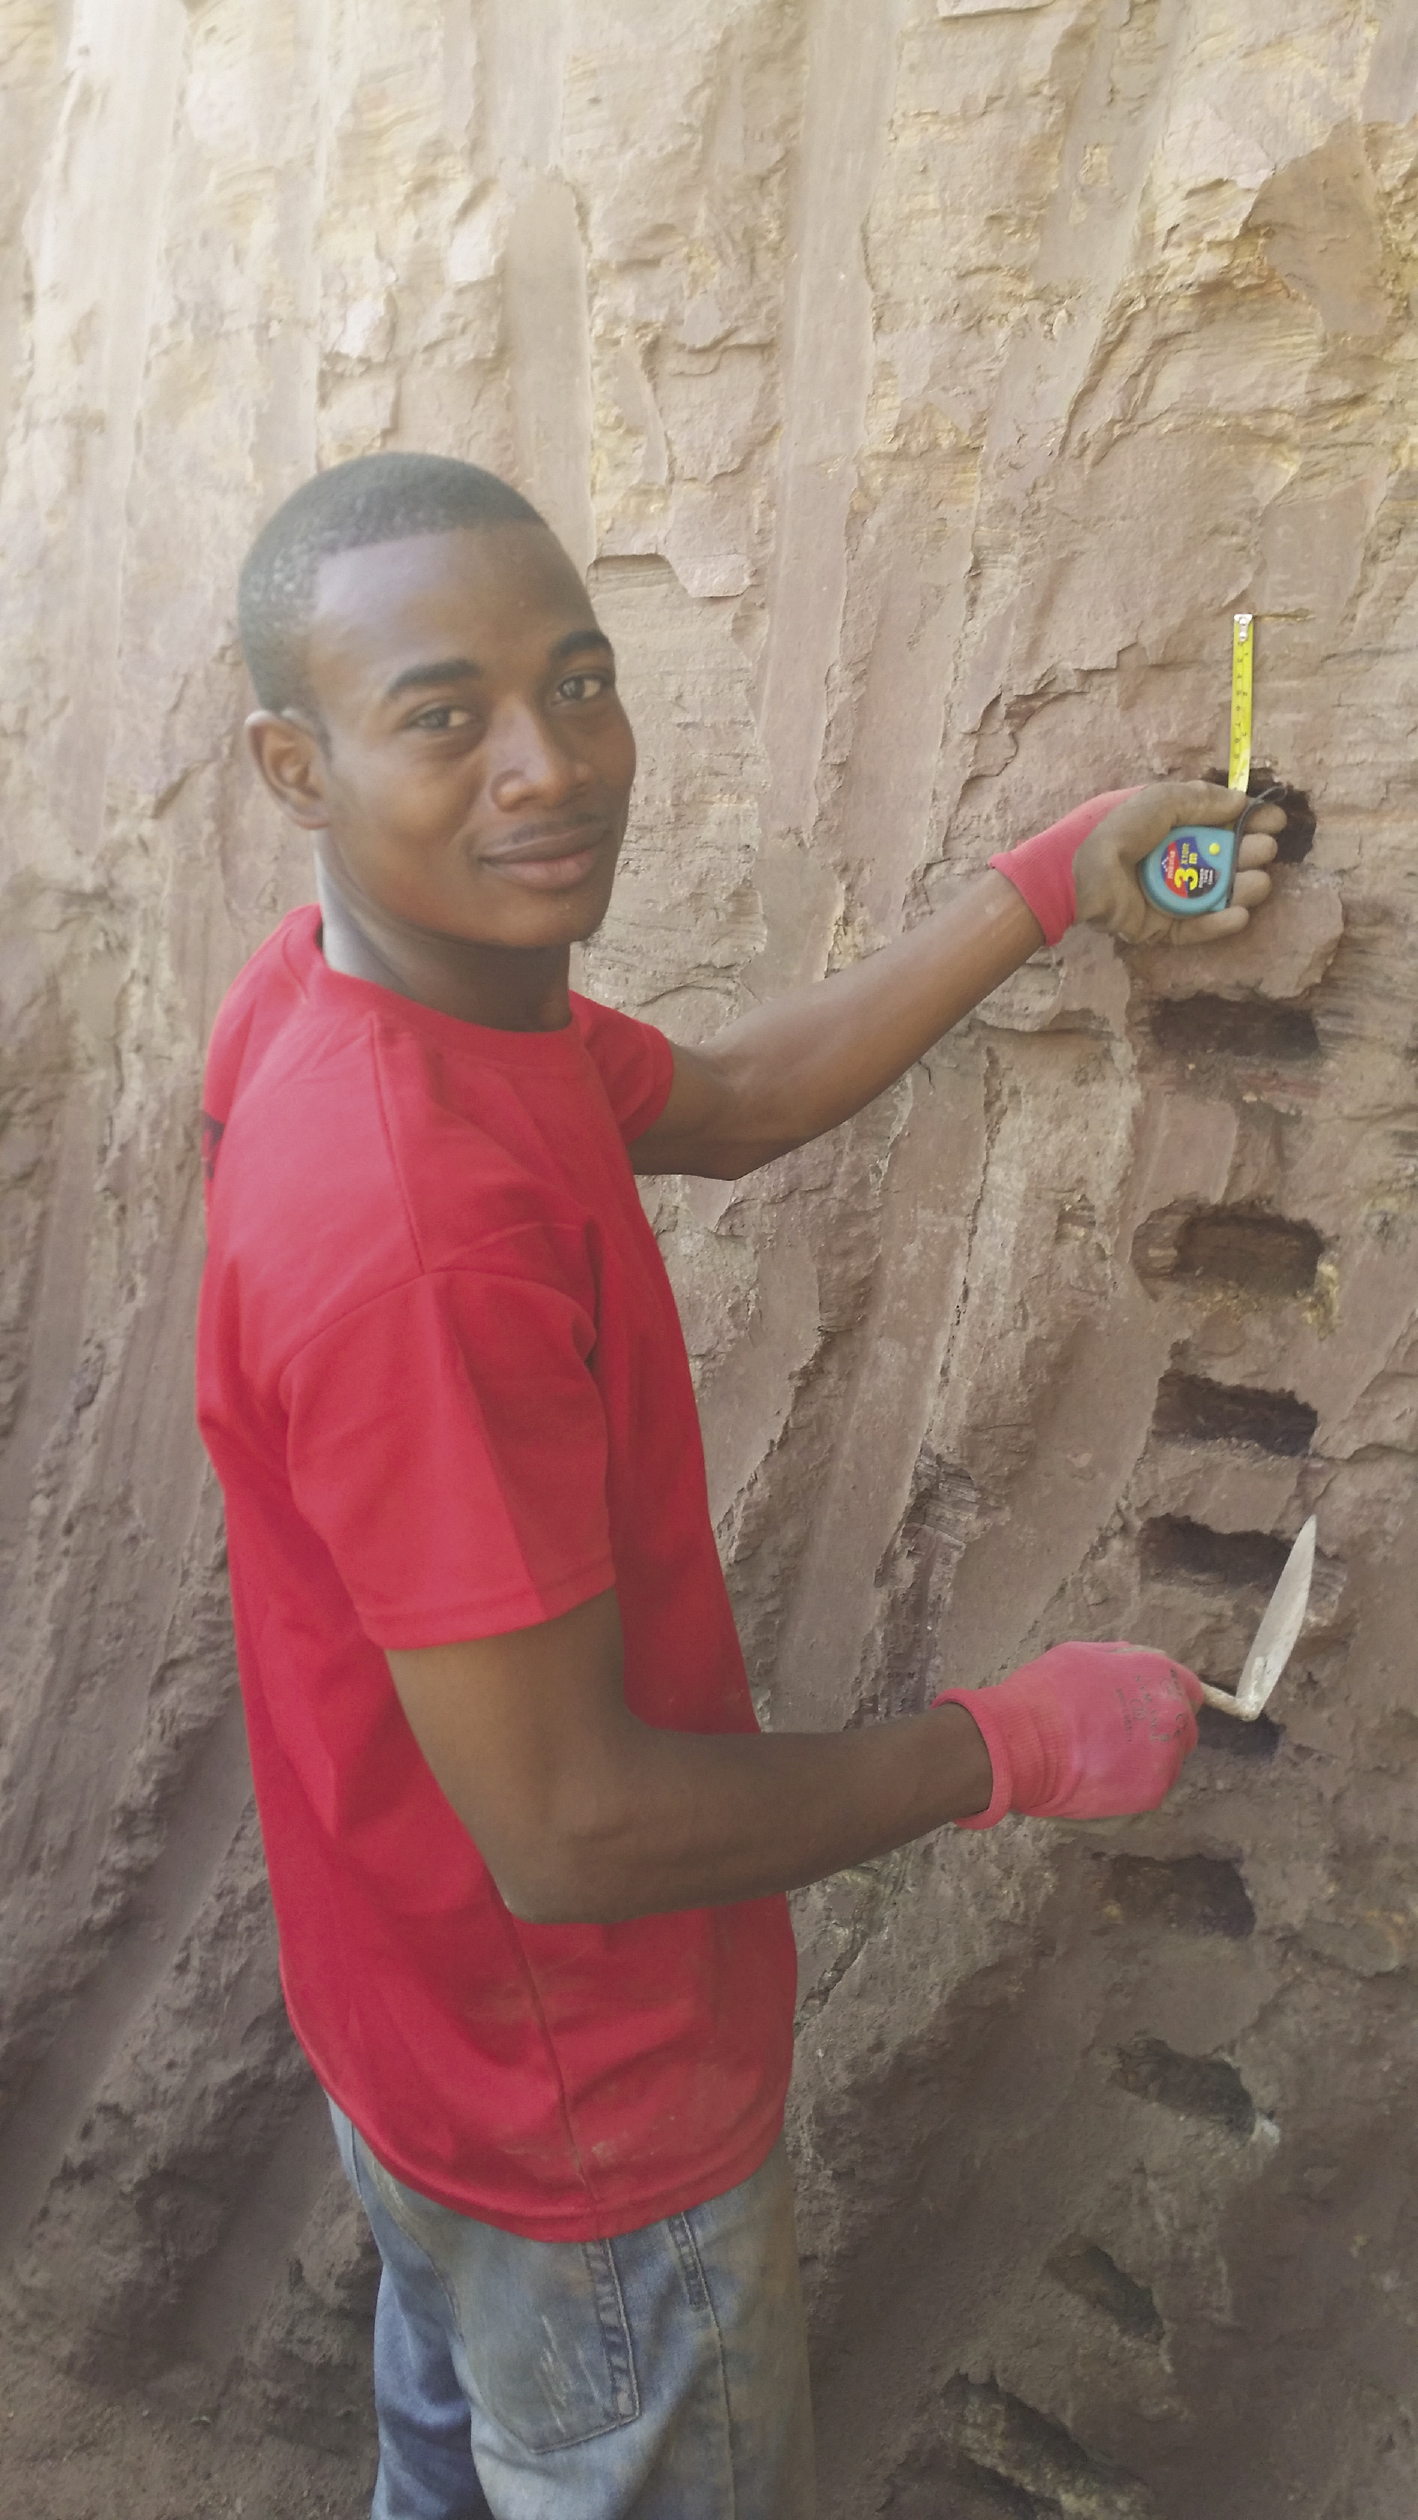
Figure 1: Workshop participant Diarra Cheick Oumar sampling a lacustrine profile of the Niger River right bank, near Bamako, during the field excursion. |
The second day was devoted to Quaternary sediments: the different types, their textures and structures; the methodology to analyze the textures and structures; the different environments of deposits and the methodology of their reconstruction; the provenance of the sediments using heavy-minerals analysis; and the use of Quaternary sediments to infer Quaternary paleoenvironmental change. While the morning was devoted to theory, participants spent the afternoon on a field trip to see Quaternary sediments of the Niger River at Bamako (Fig. 1).
Day three focused on Quaternary palynology. Methods were presented to collect, treat and extract pollen samples; to make pollen slides and analyze them using the microscope; to count and classify pollen using morphology and typology; and to build pollen diagrams. The afternoon was dedicated to practical courses. The participants learnt to extract and identify pollen, and build a pollen diagram. The used samples were from honey, as the preparation of sediment sample necessitates hazardous chemicals such as hydrofluoric acid.
The morning of the fourth day was dedicated to archaeology. Presenters discussed the types of archaeological sites in West Africa, the Paleolithic and Neolithic Periods of West Africa, and the archaeological excavation techniques in the West African context. The afternoon was spent discussing major issues concerning paleoenvironmental research in West Africa, such as the lack of quaternary science courses in West African universities; the fact that African researchers have to send their samples to Europe and Asia for analysis; the lack of communication between researchers from different regions; and the lack of funding.
The fifth and last day of the training workshop was used to define new research paths for possible paleoenvironmental research; to discuss publishing issues (language, high fees, and lack of paleo journals interested in West African case study results). The participants proposed to investigate the options for creating a new PAGES working group on paleoenvironmental dynamics of the Niger River during the Holocene. Also, following on from the day’s discussions, a group was mandated to assess the feasibility and scope for a new journal where Quaternary scientists from West Africa could publish their results more easily. It was also proposed that WAQUA should hold a workshop every year so that West African researchers can remain informed about new research methods and techniques.
In addition to the various daily agendas, a session titled “Meet the Experts” was held every day during the training workshop, to enabled early-career researchers and doctorate students to discuss their research issues with senior scientists. The participants felt inspired following this much-welcome training meeting and look forward to implementing their new skills and interact with the new colleagues they met.
acknowledgements
WAQUA members want to express their sincere gratitude to PAGES and the University of Social Sciences and Management of Bamako (USSGB) for their financial and material support, and for their encouragements.
affiliation
Faculty of History and Geography, University of Social Sciences and Management of Bamako, Mali
contact
N’dji dit Jacques Dembele: ndjijacquesicloud.com
Jing Li1 and Nico Caltabiano2
Qingdao, China, 18-25 September 2016
 |
|
Figure 1: Plenary session during the CLIVAR Open Science Conference. |
More than 600 scientists from 50 countries gathered in Qingdao, China, for the second CLIVAR Open Science Conference (OSC). The event was titled “Charting the course for climate and ocean research” and marked the 20th anniversary of CLIVAR. Over the course of five days, scientists showcased major advances in climate and ocean research. By design, more than one third of participants were early-career scientists, who presented their work through 234 posters and oral presentations, including plenary talks (Fig. 1).
Throughout the conference, the value of cross-disciplinary integration and international cooperation was emphasized. Critical issues addressed included the impacts of a warming ocean on future climate; regional variations in ocean and climate warming; the respective contributions of thermal expansion and melting ice to sea-level rise; the connections between the oceans and the global water and energy cycle; the changes taking place deep in the ocean; and the consequences of excess carbon on sea life. Different aspects concerning climate or proxy modeling that could bring about closer interactions between PAGES and CLIVAR were highlighted during the PAGES Town Hall at the CLIVAR OSC, with specific focus on: regional and high resolution modeling for paleoclimate studies; proxy modeling and assimilation of paleo observations in climate models; study on monsoon and changes in ENSO-monsoon teleconnections at different timescales, etc. Both parties could benefit from common model simulations, data syntheses and methodologies in future cooperation.
Closing a successful week of high-level talks and discussions, and new or strengthened collaborations, the final day of the conference was devoted to climate information for sustainable development and the future of climate and ocean science. Presenters and panelists concluded that CLIVAR of the future needs to help build a society resilient to environmental changes by expanding the understanding of uncertainty in climate risk and providing regional climate information and seamless predictions across timescales. All participants argued for a continued international CLIVAR coordination effort to improve our observational records (including paleo), models and process understanding, and our ability to communicate scientific discoveries translating knowledge into useful information. It was emphasized that further improvements in our understanding of climate processes are required, covering scales ranging from a centimeter to global and from hours to decades, and longer.
One of the important aims of the conference was to engage the future generation. Jointly with the OSC, CLIVAR successfully organized an Early Career Scientists Symposium (ECSS), hosted by China’s First Institute of Oceanography, State Oceanic Administration (SOA/FIO). More than 120 students and early-career scientists (some of them supported by PAGES) participated in the symposium. Participants enjoyed an informal atmosphere, while discussing in groups the key research challenges that the scientific climate community faces at the moment and highlighting the need for international science collaboration. They also discussed the best ways to engage potential stakeholders with their scientific information and suggested their vision for the future of CLIVAR.
The conference injected an amazing degree of enthusiasm about CLIVAR’s research and fortified the notion that CLIVAR is and will be critical to meet society’s needs for climate information. International cooperation of the type that CLIVAR fosters will continue to be indispensable to developing the human capacity and infrastructure that underpin all major scientific breakthroughs. The conference certainly helped in handing over the enthusiasm for CLIVAR and its science to the next generation, whose excitement is a promise for a very bright future.
The conference was hosted by the Qingdao National Laboratory for Marine Science and Technology - a new campus designed to be an open and innovative world-class marine research center. More details about the Open Science Conference can be found at www.clivar.org.
affiliations
1International CLIVAR Project Office, Qingdao, China
2International CLIVAR Project Office, Southampton, UK
contact
Nico Caltabiano: nico.caltabianoclivar.org
PAGES SSC 2015 Meeting and new SSC members
The next PAGES Scientific Steering Committee will meet 24 - 25 January 2015 in Las Cruces, Chile. Issues on the agenda include the implementation of PAGES’ scientific structure and collaborations with Future Earth and the World Climate Research Program (WCRP). A regional paleoscience symposium on the 22 and 23 January will precede the SSC meeting.
This year we are pleased to welcome two new members to the SSC:
• Blas Valero-Garcés - a paleolimnologist and sedimentologist in the Limnogeology & Global Change Group at the Institute Pirenaico de Ecología, CSIC in Zaragoza, Spain
- • Darrell Kaufman - a specialist in Arctic paleoclimate, paleolimnology, and geochronology at the School of Earth Sciences & Environmental Sustainability at Northern Arizona University. He is also one of the coordinators of the 2k Network and the PAGES endorsed group, Arctic Holocene Transitions.
We’d also like to take this opportunity to thank Steven Colman, who rotated off the SSC at the end of 2014. We are grateful for his commitment and stewardship throughout his two terms.
New Human/Environment working groups
Three new working groups with a focus on environmental change and the impact of humans have recently launched:
- • GloSS (Global Soil and Sediment transfers in the Anthropocene)
- • LandCover6k
- • Aquatic Transitions
You can read more about each of them in their Program News articles in this issue. As all PAGES working groups, these are open to participation by scientists from everywhere in the world who are interested in contributing.
Databases and tools
A number of database and tools have been developed by our groups recently:
- • The Global Paleofire Working Group (GPWG) produced an open source R package, paleofire, for analyzing sedimentary charcoal series in the Global Charcoal Database. It is discussed and applied in a recent study by Blarquez et al. (2014, Comput Geosci 72).
- • Arctic Holocene Transitions, a PAGES-endorsed group, has published an extensive compilation of Holocene proxy climate records from the Arctic (Sundqvist et al. 2014, Clim Past 10).
- • A sub-group of the former MARGO (Multiproxy Approach for the Reconstruction of the Glacial Ocean Surface) project, which was supported by IMAGES and PAGES, has published a study addressing the constraints on surface seawater oxygen isotope change between the Last Glacial Maximum and the Late Holocene (Waelbroeck et al. 2014, Quat Sci Rev 105).
Future Earth update
Future Earth’s Strategic Research Agenda 2014 has been published after a year-long global consultation on the priorities for global change research. It identifies priority areas for research and collaboration between funders, policymakers, and researchers over the next 3-5 years.
www.futureearth.org/news/future-earth-strategic-research-agenda-2014-published
The Future Earth Engagement Committee was recently announced. This is a strategic advisory group, comprising thought-leaders from business, policy, and civil society. Its primary purpose is to foster interactions between science and society working alongside the Future Earth Science Committee.
www.futureearth.org/news/future-earth-engagement-committee-announced
Upcoming issues of PAGES Magazine
The next issue of PAGES Magazine will be on volcanic forcing and climatic response. Contact the guest editors Allegra LeGrande (allegra.n.legrandenasa.gov) and Kevin Anchukaitis (kjawhoi.edu), or the PAGES office to enquire about contributing to this issue.
We are also planning an issue on abrupt changes and tipping points in the Earth system. Contact the PAGES office if you are interested in contributing or exploring ideas.
In general, if you wish to lead a special section of the magazine on a particular topic, let us know at the PAGES office or have a discussion with any PAGES SSC member.
Dorthe Dahl-Jensen1, E. Capron2, P. Vallelonga3 and D.M. Roche4,5
Past4Future is a Collaborative Project in the European Union’s Framework Programme 7; it aimed to generate knowledge about climate changes during the last two interglacials. The approach was to combine proxy data with climate model simulations to investigate the existence and the cause of past abrupt climate changes during warm climate periods in order to evaluate the risk of abrupt changes in the future. Featuring contributions from a number of Past4Future participants, this Science Highlights section of PAGES Magazine showcases the cross-disciplinary nature of this very successful project that ended in December 2014.
One focus was to define the climatic and environmental conditions during the last two interglacials. A compilation of temperature changes in the high latitudes evidenced that the onset of the Last Interglacial warming occurred first in the Southern Hemisphere but was stronger in the Northern Hemisphere (Capron et al. p. 4). In addition, new paleoclimatic records covering the last two interglacials and their preceding deglaciations have unveiled abrupt environmental and climatic changes in sea ice extent (Sha et al. p. 24), oceanic circulation (Galaasen et al. p. 20; Marino and Zahn p. 22), sea surface salinity (Rodriguez-Sanz and Mortyn p. 6), and sea surface temperature (Martrat et al. p. 10). Abrupt changes in benthic foraminiferal δ13C at the onsets of the last two interglacials (Galaasen et al. p. 20) combined with direct simulations of δ13C (Bakker et al. p. 18) suggest that abrupt climate changes are likely to be related to reductions in North Atlantic Deep Water formation. Modeling experiments including freshwater and volcanic forcing (Roche et al. p. 8) further constrain that the risk of future changes at the centennial scale is related to the stability of the Atlantic Meridional Ocean Circulation, and that volcanic eruptions are unlikely to cause strong climate changes of longer duration than a decade.
 |
|
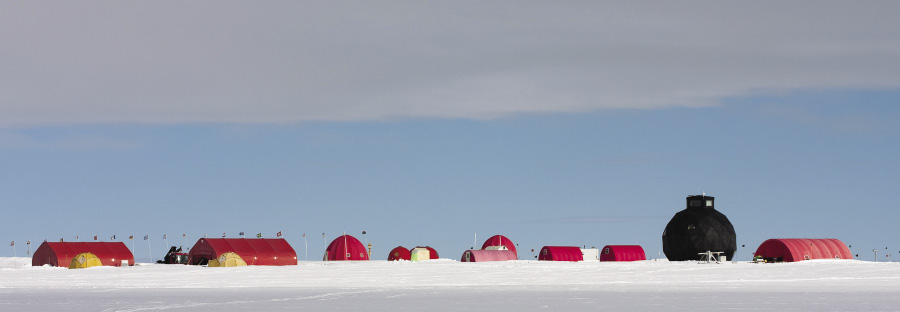
Photo The camp of the North Greenland Eemian Ice Drilling (NEEM) project where the first complete record of Eemian ice was recovered for Greenland. Photo: T. Burton. |
Another objective of Past4Future was to better understand global biogeochemical feedbacks between climate and the carbon and nitrogen cycles during interglacials. Antarctic ice core measurements of past CO2 concentration and its isotopic composition, provide new evidence that the rise of CO2 concentrations over the mid-Holocene cannot be man-made, but could be related to long-term re-equilibration of carbonate chemistry in the ocean (Fisher et al. p. 12). Biomass burning is also an important process affecting both regional and global climate, through the emission of greenhouse gases and particulates that reflect and absorb incoming solar radiation. New past fire activity tracers measured in ice cores were developed (Kerwhald et al. p. 14) and techniques to better compare biomass burning model simulations with the available datasets were established (Brücher et al. p. 16).
Overall, the Past4Future findings unambiguously demonstrate that abrupt climate changes are not limited to glacial conditions, but can also occur in a warm world. Changing ocean circulation, increasing greenhouse gas concentrations and instabilities of the remaining polar ice sheets are candidates for causing future abrupt changes.
The strength of the project relied on the interdisciplinary team of experts, which brought together the paleoclimatic data and modeling communities. While the research was centered on paleoclimate conditions and can therefore be classified as fundamental research, the knowledge gained is relevant for predictions – especially those relating to the risk and time scales connected to abrupt climatic and environmental changes in the near and more distant future.
A strong emphasis was also put on communicating the project results to an audience including scientists within and external to the climate science community, as well as policymakers, and the public (Dahl-Jensen p. 26).
While this five-year project has just ended, it will be crucial to pursue the integrative approach it fostered in order to gain additional insights on the causes of past abrupt changes and the potential risk of future ones. Essential future research directions include for example improving (i) paleoclimatic record timescales, (ii) direct modeling of paleoclimatic tracers, and (iii) data assimilation techniques.
In the future, it is not so clear how programs such as Past4Future may continue under the present European research framework, Horizon2020, where more focus is put on applied research and transferable knowledge to the private sector. Under the European Research Council’s funding scheme for excellence, PI-driven research projects will thrive, and it is obvious we should encourage scientists to look this way. However, instruments to drive collaborative and integrative science, the backbone of the Past4Future project, may be lacking.
Science does, however, crucially depend on such instruments to coordinate research, synthesize results, and foster the proliferation of scientific knowledge; therefore, providing a base to build our applicable scientific knowledge on issues such as the likelihood of abrupt changes in the future and predicting the associated risks.
acknowledgements
The research leading to these results has received funding from the European Union’s Seventh Framework programme (FP7/2007-2013) under grant agreement no. 243908, ”Past4Future. Climate change - Learning from the past climate”.
affiliations
1Centre for Ice and Climate, Niels Bohr Institute, University of Copenhagen, Denmark; Coordinator of Past4Future.
2British Antarctic Survey, Cambridge, UK
3Centre for Ice and Climate, Niels Bohr Institute, University of Copenhagen, Denmark
4Department of Earth Sciences, VU University of Amsterdam, The Netherlands
5Laboratoire des Sciences du Climat et de l’Environnement (LSCE), Gif-sur-Yvette Cedex, France
contact
Dorthe Dahl-Jensen: ddjnbi.ku.dk
Emilie Capron1, A. Govin2 and E.J. Stone3
We compiled ice and marine records of high-latitude temperature changes and placed them on a common timescale. We also produced climatic time slices for 115, 120, 125, and 130 ka. They represent improved benchmarks to perform Last Interglacial model-data comparisons.
The Last Interglacial (LIG, ~129-116 thousand of years BP, ka) represents a test bed for climate model feedbacks under warmer-than-present conditions. A spatio-temporal picture of LIG temperature evolution is indispensable to perform robust model-data comparisons and examine the General Circulation Models (GCMs) used for future climate projections (e.g. Lunt et al. 2013; Bakker and Renssen 2014).
However, existing LIG data syntheses (e.g. Turney and Jones 2010; McKay et al. 2011) consist of a single time slice and introduced dating uncertainties of up to several thousands of years by using the paleoclimatic records on their original timescales. Nevertheless, there is evidence that LIG surface temperatures peaked asynchronously around the globe (e.g. Bauch and Erlenkeuser 2008; Govin et al. 2012).
Here, we overcome the difficulty of aligning temperature records from different paleoclimatic archives retrieved across the world by limiting a new data synthesis to the high-latitudes. Our compilation provides a dynamic representation of the LIG temperature evolution, allowing more robust model-data comparisons.
A new LIG data synthesis associated with a coherent temporal framework
We combined 47 surface air and sea surface temperature records across the LIG polewards of 40°N and 40°S, respectively (Capron et al. 2014). Surface air temperature records are deduced from water stable isotopic profiles of ice cores. Sea surface temperatures (SST) are reconstructed from foraminiferal Mg/Ca ratios, alkenone unsaturation ratios, and faunal assemblages in marine sediment cores.
We use as a reference chronology for both marine and ice records, the recent Antarctic ice core chronology AICC2012. It is the first integrated timescale over the LIG, based on a multi-site approach including both Greenland (NGRIP) and Antarctic ice cores (EDC, EDML, TALDICE, Vostok). The numerous new stratigraphic links significantly reduce the absolute dating uncertainty down to ±1.6 ka (1σ) during the studied time interval (Bazin et al. 2013) making it a particularly well-constrained age scale.
In a first step we have transferred the Dome F and NEEM ice cores onto AICC2012 since they were not initially included in the construction of AICC2012. In a second step, to align marine records onto AICC2012, we follow the strategy of Govin et al. (2012). It is based on the assumption that surface-water temperature changes in the sub-Antarctic zone of the Southern Ocean (respectively in the North Atlantic) occurred simultaneously with air temperature variations above Antarctica (respectively Greenland).
 |
|
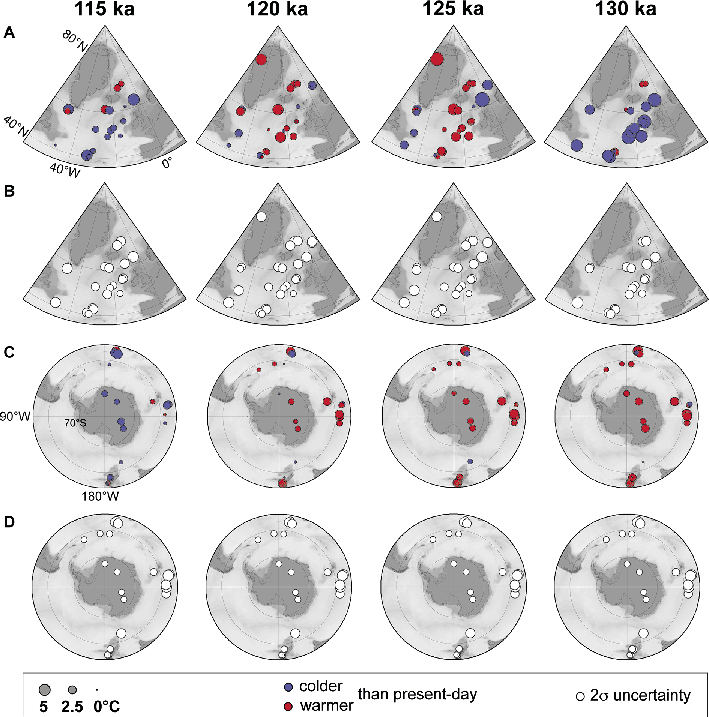
Figure 1: Temperature time slices across the Last Interglacial. NH air and sea surface temperature anomalies (A) associated with 2σ uncertainties (B). (C) and (D) are the same as (A) and (B) for the SH. The size of the dots (both for temperature anomaly and associated 2σ uncertainty) follows the temperature scale given in the box. For all panels, warming (cooling) compared with modern temperature is represented in red (purple). The temperature anomalies are relative to the World Ocean Atlas (WOA) 1998, 10 m-depth data for marine records and relative to present-day instrumental surface air temperature measurements for ice records. |
The aligned time series have already been used for comparison with transient model simulations (as in Loutre et al. 2014). In addition, we constructed four time slices to assist snapshot simulation assessment. We calculated temperature anomalies relative to present-day conditions over 2 ka time windows centred on 115, 120, 125, and 130 ka.
The aligned surface temperature time series and the time slice reconstructions benefit from quantitative uncertainty estimates. We used a Monte-Carlo analysis, taking into account temperature reconstruction errors as well as the propagation of dating uncertainties (see Capron et al. 2014 for details). This results in a final uncertainty estimate of ± 2.6°C on average for SST records and ± 1.5°C for surface air temperature Antarctic records (Fig. 1).
LIG climatic features
 |
|
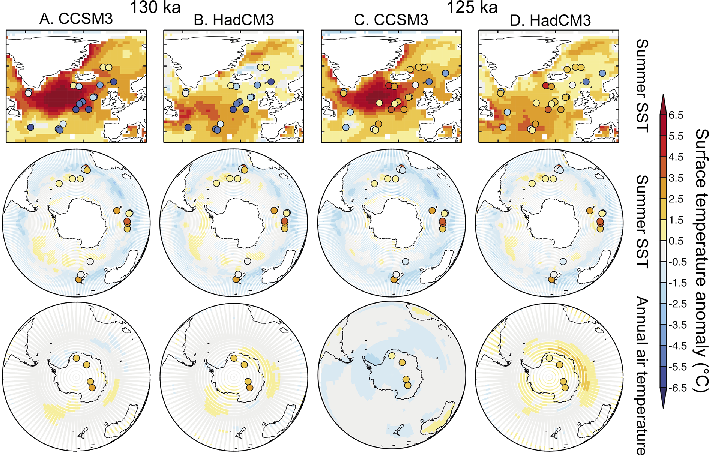
Figure 2: Model-data comparison of time slice reconstructions for 130 ka (A and B) and 125 ka (C and D) with respective snapshot simulations using the CCSM3 and HadCM3 models. Summer SST temperature anomalies from the marine sediment data (dots) superimposed onto model July-August-September SSTs in the NH and model January-February-March SSTs in the Southern Ocean; Annual mean surface air temperature anomalies from ice core data (dots) superimposed onto the model annual surface air temperature. |
Producing robust age models and SST reconstructions remains difficult in the Nordic Seas. Thus, we focus on the robust climatic patterns found in the North Atlantic and Southern Ocean. The time slices (Fig. 2) capture the major features characterizing the spatial sequence of events described in the time series (Capron et al. 2014). In particular, the comparison of the 130 ka time slices from the two polar regions illustrates that warming in the Southern Hemisphere (SH) preceded warming of the North Atlantic. This interhemispheric asynchrony, which has already previously been reported (e.g. Govin et al. 2012), is attributed to the “bipolar seesaw” mechanism, induced by changes in the intensity of the Atlantic Meridional Overturning Circulation (AMOC; Stocker and Johnsen 2003). The melting of northern ice sheets extended beyond the penultimate deglaciation into the early LIG and the associated release of meltwater into the North Atlantic was suggested to have delayed the full establishment of a vigorous AMOC, resulting in peak Antarctic temperatures while the North Atlantic was still cold (Govin et al. 2012).
The 130 ka time slice also reveals SSTs significantly cooler-than-present-day conditions, e.g. up to 7.5 ± 3°C cooler in the northern high latitudes, while temperatures were slightly warmer than present-day (1.7 ± 2.5°C on average) in most of the SH sites. Warmer-than-present-day climatic conditions are clearly visible in the 130, 125, and 120 ka time slices in the SH, while they are only observed locally and with a relatively high uncertainty in the 125 and 120 ka time slices of the Northern Hemisphere (NH). Warmer-than-present-day conditions hence lasted longer at southern high latitudes than at northern ones. Finally, the magnitude of temperature changes is larger at northern than at southern high latitudes during the LIG onset and demise.
Toward more robust model-data comparisons
To illustrate the potential of our new LIG data synthesis for model-data comparisons, we compared 125 and 130 ka snapshot simulations performed with two GCMs, CCSM3 (Otto-Bliesner et al. 2013; Collins et al. 2006), and HadCM3 (Gordon et al. 2000), to the corresponding data-based time slices (Fig. 2; Capron et al. 2014).
We observe that both models predict warmer-than-present-day North Atlantic conditions at 130 ka, i.e. earlier than in our data compilation. Furthermore, neither of the models reproduce the reconstructed early SH warming (Fig. 2A,B). This means that the 130 ka simulations do not reproduce the bipolar seesaw pattern identified from the data synthesis. This is possibly because they only simulate the climate response to the static orbital and greenhouse gas forcing at 130 ka without taking into account potential dynamic AMOC responses to persistent NH ice sheet melting. Indeed, simulations where freshwater forcing to the North Atlantic from the Laurentide and Eurasian ice sheets is introduced perform better in reproducing the late NH warming (Govin et al. 2012). Also both models run under modern polar ice sheet and vegetation configurations, not under 130 ka ones. Other simulations considering an additional feedback linked to the disintegration of the West Antarctic ice sheet resulted in an additional warming over Antarctica (Holden et al. 2010; Otto-Bliesner et al. 2013).
At 125 ka, both models produce warmer-than-present-day conditions in the North Atlantic region (Fig. 2C,D). In Antarctica, CCSM3 suggests a cooler climate at 125 ka compared to present-day while ice core data suggest warmer conditions (Fig. 2C). The observed dissimilarities between CCSM3 and HadCM3 simulations are likely related to their different sea ice sensitivities (Otto-Bliesner et al. 2013).
Summary and outlook
We produced the first data synthesis that documents the spatio-temporal evolution of high-latitude temperatures from the LIG onset to its demise, using one single reference chronology. We paid careful attention to estimate quantitatively the temperature errors, including the propagation of dating uncertainties. Our study reveals asynchronous temperature changes between the polar regions and highlights the importance of considering the LIG sequence of events rather than averaging climate conditions over the entire LIG period.
This work should encourage more in-depth model-data comparison exercises with both snapshots and transient model simulations. Future work should not only consider surface temperature, but include additional climatic parameters (e.g. deep ocean circulation changes, sea ice extent) to move towards a more complete picture of LIG climatic and environmental changes.
acknowledgements
This work has also received funding from the UK-NERC consortium iGlass (NE/I009906/1).
affiliations
1British Antarctic Survey, Cambridge, UK
2MARUM/Center for Marine Environmental Sciences, University of Bremen, Germany
3School of Geographical Sciences, University of Bristol, UK
contact
Emilie Capron: ecapbas.ac.uk
references
Bakker P, Renssen H (2014) Clim Past 10: 1633-1644
Bauch HA, Erlenkeuser H (2008) Polar Res 27: 135-151
Bazin L et al. (2013) Clim Past 9: 1715-1731
Capron E et al. (2014) Quat Sci Rev 103: 116-133
Collins WD et al. (2006) J Clim 19: 2122-2143
Gordon C et al. (2000) Clim Dyn 16: 147-168
Govin A et al. (2012) Clim Past 8: 483-507
Holden PB et al. (2010) Clim Past 6: 431-443
Loutre MF et al. (2014) Clim Past 10: 1541-1565
Lunt DJ et al. (2013) Clim Past 9: 699-717
McKay NP et al. (2011) Geophys Res Lett 38, doi:10.1029/2011GL048280
Otto-Bliesner B et al. (2013) Phil Trans R Soc London, Ser A, doi: 10.1098/rsta.2013.0097
Stocker TF, Johnsen SJ (2003) Paleoceanography 18, doi:10.1029/2003PA000920
Laura Rodríguez-Sanz1 and P. Graham Mortyn2,3
During the last glacial termination, atmospheric and oceanic teleconnections promoted millennial-scale episodes of widespread salinification in the tropical and extratropical Pacific Ocean that coincided with the Younger Dryas and Heinrich Stadial 1 cold phases in the North Atlantic.
 |
|
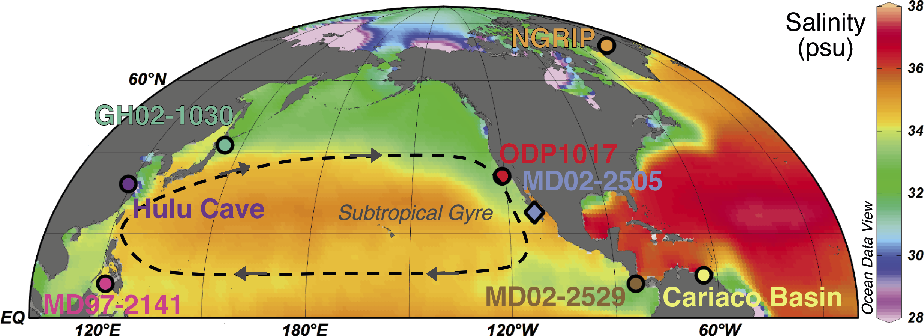
Figure 1: Modern Northern Hemisphere Sea surface salinity and location of the studied paleoclimatic records. Salinity data are from Ocean Data View (http://odv.awi.de/en/data/ocean/world_ocean_atlas_2005/). |
It has long been debated how ocean circulation may have responded to the decline in the formation of North Atlantic Deep Water and weakened Atlantic Meridional Overturning Circulation (AMOC) during Heinrich Stadial 1 (HS1) and the Younger Dryas (YD). Proxy-data and model simulations suggest that convective overturning in the North Pacific reached down to intermediate (ca. 1-2 km; Jaccard and Galbraith 2013) or even deep (3 km) levels (Okazaki et al. 2010; Rae et al. 2014) during HS1, while the water column appears to have been more stable during the YD. It has been proposed that intermediate/deep water formation in the Pacific Ocean hinges on a basin-wide increase in ocean salinity driven by changes in, e.g. the strength of the Asian Monsoon, the transport of moisture from the Atlantic to Pacific, and in the North Pacific storm tracks (Emile-Geay et al. 2003). To provide an overview of the North Pacific hydrography, of its circulation, and of the potential for overturning during the last glacial termination (T1), we gathered data from several tropical and sub-tropical sites that reveal the timing and spatial distribution of surface ocean salinity changes in this region (Fig. 1).
Salinification of the North Pacific
 |
|
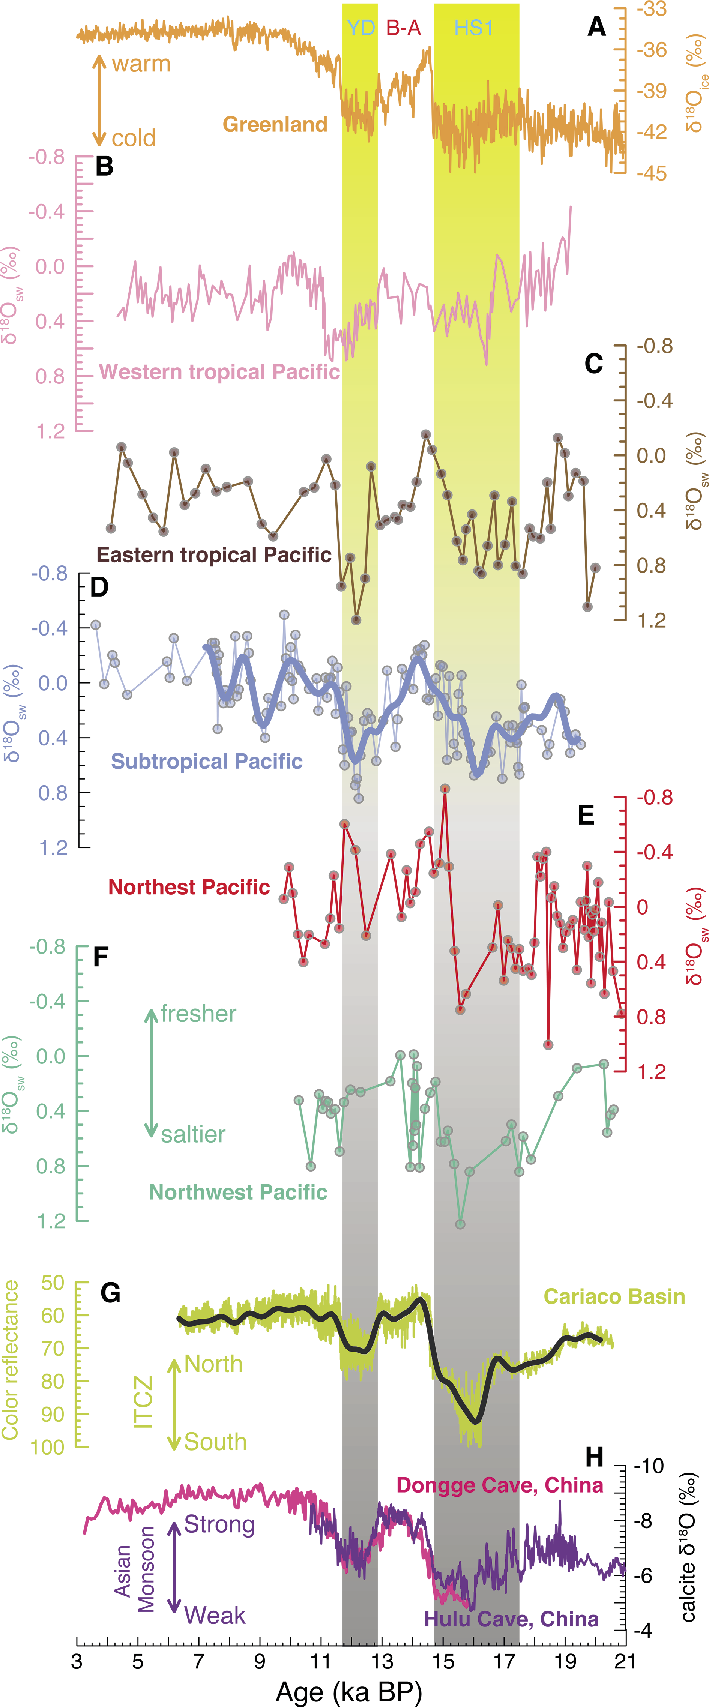
Figure 2: Paleohydrologic records from across the North Pacific compared to key paleoclimatic records. (A) Climate variability recorded in the Greenland NGRIP ice core δ18O. Ice-volume corrected seawater δ18O from the (B) western (Rosenthal et al. 2003) and (C) eastern (Leduc et al. 2007) tropical Pacific, the (D) subtropical eastern Pacific (Rodríguez-Sanz et al. 2013), and the mid-latitude (E) northeastern (Pak et al. 2012) and (F) northwestern Pacific (Sagawa and Ikehara 2008). (G) Intertropical Convergence Zone (ITCZ) position, (Deplazes et al. 2013); (H) Asian Monsoon strength (Wang et al. 2001; Yuan et al. 2004). See Fig. 1 for the names and locations of sites. HS1, Heinrich Stadial 1; B-A, Bølling-Allerød; YD, Younger Dryas. |
Seawater stable oxygen isotope data (δ18OSW) derived from paired Mg/Ca-δ18O measurements in planktic foraminifera is widely applied to reconstruct salinity fluctuations in the past. This approach uses the linear relationship between δ18OSW and seawater salinity observed at regional scales in the modern ocean (LeGrande and Schmidt 2006). During HS1 and the YD (Fig. 2A), millennial-scale δ18OSW increases at several locations in the mid- to low-latitude North Pacific (Fig. 1) indicate an overall salinification of the surface ocean (Fig. 2B-F). This picture is, however, complicated by the superimposed regional variability, likely in connection with more local circulation changes and freshwater inputs. This might explain, for instance, why salinification during HS1 was more subtle in the western tropical Pacific (Fig. 2B) than elsewhere in the basin (Fig. 2C,D).
The salinity increases in the tropical-subtropical Pacific associated with the YD and HS1 (Fig. 2B-D) coincided with cold conditions in Greenland (Fig. 2A), a more southward mean position of the Intertropical Convergence Zone (ITCZ; Fig. 2G), and a weakened boreal summer monsoon (Fig. 2H). Gibbons et al. (2014) proposed that the deglacial salinity increases in the tropical Pacific, and more widely in the Indo-Pacific region as a whole, reflect large-scale reorganizations of the hydrological cycle in response to reduced inter-hemispheric temperature gradients modulated by the AMOC slowdowns during T1. The salinity maxima coinciding with the YD and HS1 in the Western Equatorial Pacific (Rosenthal et al. 2003) have been ascribed to the millennial-scale weakening of the Asian Monsoon (Wang et al. 2001). Leduc et al. (2007) invoked that Atlantic-to-Pacific transport of moisture must have been reduced in response to the southward displacement of the ITCZ (Fig. 2G) to explain similarly timed millennial-scale salinification phases in the Eastern Equatorial Pacific (Fig. 2C). The northward expansion of these eastern tropical salinity anomalies at the expense of the fresher California Current likely controlled the salinification at 25°N off the Baja California Margin (Fig. 2D). This was possibly in response to reorganizations of the atmospheric circulation over the North American continent and/or El Niño conditions (Rodríguez-Sanz et al. 2013). Similar processes may have also controlled the surface ocean salinification at 34°N along the California Margin (Fig. 2E) during HS1, whereas the local hydrographic response during the YD apparently occurred in the opposite sense, i.e. with a freshening (Pak et al. 2012). Interestingly, at 42°N on the western side of the Pacific Ocean (Fig. 2F) salinification is also recorded for HS1, but not for the YD (Sagawa and Ikehara 2008). Likewise, a paleosalinity reconstruction obtained from organic-walled dinoflagellate cyst assemblages from the Northeast Pacific (de Vernal and Pedersen 1997) documents saline conditions in this sector of the basin during HS1 but not during the YD (not shown).
Implications for North Pacific overturning
The salinification of the tropical and sub-tropical North Pacific, and the northward advection of saline waters across the basin during the deglacial intervals of weakened AMOC has been proposed as a key process for activating and sustaining the North Pacific overturning (Okazaki et al. 2010). However, several shortcomings challenge the picture of the interactions between ocean and climate change in the North Atlantic: response of the atmospheric circulation across the North American continent and the Indo-Pacific Ocean, and the influence of Pacific salinity on the basin’s overturning. For example, the salinity anomalies in the tropical Pacific up to 25°N are of similar amplitude during both HS1 and the YD (Fig. 2B-D). This is in contrast to the evidence that changes in the mean position of the ITCZ and the Asian Monsoon (Fig. 2G-H) were more prominent during HS1 than during the YD (Wang et al. 2001; Deplazes et al. 2013). There is therefore an apparent mismatch between the magnitude of change in the drivers and the response of the salinity budget of the Pacific Ocean. This may allude to complementary factors affecting the hydrography of the tropical and subtropical North Pacific and/or to a “saturation” of the salinity signal during extreme shifts in the position of the ITCZ and monsoon strength.
Another intriguing feature of the spatial and temporal evolution of surface ocean salinity in the North Pacific across T1 is the apparent divide that developed during the YD between the low-latitude Pacific experiencing salinification (Fig. 2C-D) and the mid- to high-latitudes that instead either freshened (Fig. 2E) or remained stable (Fig. 2F). This raises the possibility that the North Pacific storm tracks strengthened (Emile-Geay et al. 2003) or that the positive feedback between intermediate to deep overturning and advection of subtropical saline waters to the subpolar North Pacific was not operating during the YD (Okazaki et al. 2010).
Outlook
Model simulations of freshwater inputs into the North Atlantic (e.g. Okazaki et al. 2010) have shed light on global atmospheric and oceanic processes that could have caused widespread salinification of the Pacific Ocean with possible consequences for deep water convection in the basin. Results point toward overall reduced freshwater inputs in the Pacific due to a weakening of the Asian Monsoon and southward displacement of the ITCZ, and enhanced exchange of saline water masses across the North Pacific gyres aided by a closed Bering Strait. Available paleoceanographic data could be explained by the coexistence of all of these processes during the YD and HS1. Additional model simulations and high quality salinity reconstructions across the tropical and extratropical Pacific Ocean will permit researchers to quantitatively constrain the spatial distribution of the salinity anomaly and further understand the actual mechanisms controlling the response of the Pacific Ocean to changes in AMOC.
affiliations
1Research School of Earth Science, The Australian National University, Canberra, Australia
2Institute of Environmental Science and Technology, Universitat Autònoma de Barcelona, Spain
3Department of Geography, Universitat Autònoma de Barcelona, Spain
contact
Didier Roche: didier.rochelsce.ipsl.fr
references
de Vernal A, Pedersen TF (1997) Paleoceanography 12: 821-830
Deplazes G et al. (2013) Nat Geosci 6: 213-217
Emile-Geay J et al. (2003) J Geophys Res Oceans 108, doi:0.1029/2001JC001058
Gibbons FT et al. (2014) Earth Planet Sci Lett 387: 240-251
Jaccard SL, Galbraith ED (2013) Geophys Res Lett 40: 199-203
Leduc G et al. (2007) Nature 445: 908-911
LeGrande AN, Schmidt GA (2006) Geophys Res Lett 33, doi:10.1029/2006GL026011
Okazaki Y et al. (2010) Science 329: 200-204
Pak DK et al. (2012) Paleoceanography 27, doi:10.1029/2011PA002238
Rae JWB et al. (2014) Paleoceanography 29: 645-667
Rodríguez-Sanz L et al. (2013) Paleoceanography 28: 529-538
Rosenthal Y et al. (2003) Geophys Res Lett 30, doi:10.1029/2002GL016612
Sagawa T, Ikehara K (2008) Geophys Res Lett 35, doi:10.1029/2008GL035133
D.M. Roche1,2, H. Renssen1, C. Morrill3,4, H. Goosse5 and A. Mairesse5
A suite of model simulations performed within the Past4Future project have investigated the effect of freshwater fluxes and volcanic eruptions on global climate during interglacial climate conditions. Results for the Holocene evidence impacts that persist for centuries to millennia.
Reconstructions of the past climate unambiguously show that climate can shift abruptly on decadal timescales. Evidence of abrupt transitions comes from both the present “Holocene” Interglacial and the Last “Eemian” Interglacial (e.g. Alley et al. 1997; Pol et al. 2014). However, there is still considerable uncertainty concerning the role of the different climate forcings in causing abrupt shifts. Constraining the sensitivity of interglacial climates to each forcing is a pre-requisite for assessing the future risk of abrupt changes and the potential impacts on societies.
To better understand our capacity to reproduce the reconstructed past climate changes, the Past4Future project evaluated the results of large coordinated modeling experiments, including those that exposed interglacial climate to freshwater and volcanic forcing perturbations. We report here on the results regarding (i) the well-known 8.2 kyr cold event and (ii) the effect of volcanic forcing in Holocene transient simulations.
Freshwater forcing of the 8.2 kyr cold spell
The 8.2 kyr event is an abrupt cooling that lasted ~150 years and is clearly identified in water isotopic records from Greenland ice-core records (e.g. Johnsen et al. 1992). It is generally associated in models with a temporary weakening of the Atlantic Meridional Overturning Circulation (AMOC) as a consequence of freshwater forcing pulse; there are data evidences that this is also the case in reality (Kleiven et al. 2008). Though some uncertainties exist on the precise amount, duration, and sequence of the freshwater pulse(s) delivered to the North Atlantic at this time, the cause is generally regarded to be the final drainage of giant North American proglacial lakes that stored deglacial meltwater from the retreating Laurentide ice-sheet (Barber et al. 1999). The largest freshwater contribution into the North Atlantic Ocean likely came from proglacial Lake Agassiz-Ojibway.
The 8.2 kyr event is an easy target for model intercomparison studies because (i) of its short duration, (ii) it occurred at the very end of the deglaciation in a climate relatively similar to our current one, and (iii) of the relatively well-known characteristics of the freshwater pulse. As such, it is accessible for the most recent complex coupled climate models. Additionally, this event is of particular interest since previous modeling studies reported that the resulting oceanic circulation decrease is of comparable magnitude to that obtained in future climate projections by the end of the century (Cheng et al. 2013; LeGrande et al. 2006).
Morrill et al. (2013) analyzed the results of four simulations from three climate models obtained using the 8.2 kyr event simulation scenario proposed within Phase 3 of the Paleoclimate Modelling Intercomparison Project (PMIP3). The three models analyzed are of various complexities and resolution (see Table 1). They show reasonable skill in reproducing the present-day climate, and of particular interest here, the strength of the oceanic circulation. There are, however, notable differences between the models in the regions where deep oceanic waters are formed.
All studied models simulate an AMOC weakening following the imposed forcing anomaly where freshwater was added for one year at a rate of 2.5 Sv (1 Sv = 106 m3 s-1). Generally, the AMOC reduction is a consequence of surface ocean freshening and sea-ice expansion in the North Atlantic. However, the three models show differences in the duration and amount of the AMOC decrease. Two of them show a reduction of 10% of the AMOC and a return to pre-freshwater forcing values within a few decades. However, the third model shows a more substantial 25% AMOC reduction, with a longer lasting response of a century.
 |
|
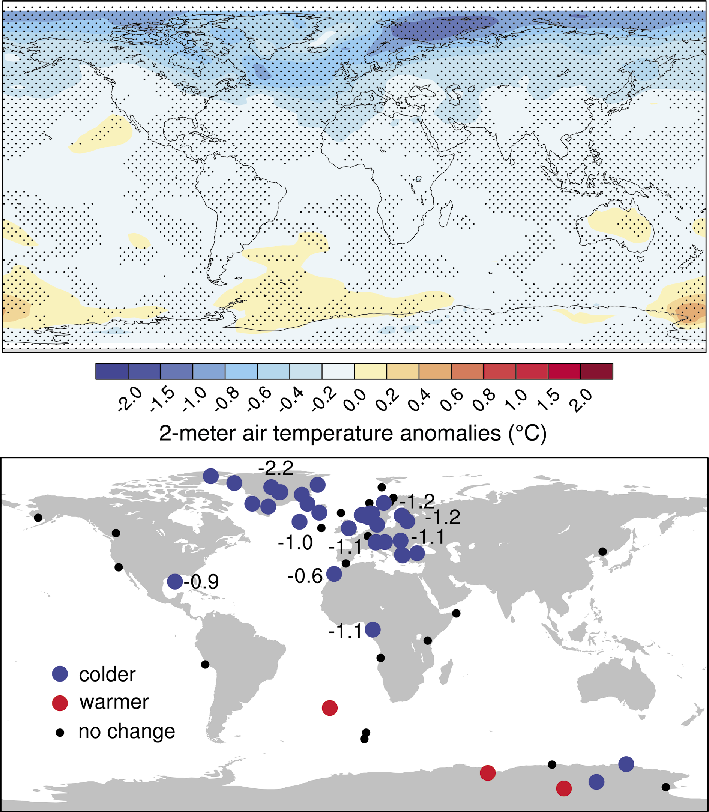
Figure 1: Comparison of mean annual temperature anomalies for the 8.2 kyr event from a multi-model ensemble (top) and proxy evidence (bottom). Stippling shows grid cells where at least three of four simulations agree on the sign of the temperature anomaly. Quantitative estimates of temperature anomalies from proxies are shown in degrees Celsius. |
As a consequence, surface temperature changes are observed in all models (Fig. 1a). Overall, a significant cooling is observed in the Northern Hemisphere, with a reduction in mean annual temperature of less than 0.5°C over most continents and around 1°C over some regions of the North Atlantic. Models also show a consistent pattern of warming of about 0.3°C or less in parts of the Southern Ocean. These features are consistent with the spatial distribution of temperature anomalies from proxy data (Fig. 1b). However, the models generally underestimate the amount of cooling by a factor of two and obtain only a shorter temperature response of just a few decades instead of the observed 150 years.
Analysis of model simulation differences shows that other factors may also influence the model result and account for some of the data-model discrepancies (Morrill et al. 2013). For example, the models may be sensitive to the presence or absence of deep oceanic convection in the Labrador Sea and to the length, amplitude, and other details in the freshwater forcing scenario.
Volcanic forcing of Holocene climate variability
Large volcanic eruptions are, in addition to freshwater releases, another well-known driver of abrupt climate variations. During explosive eruptions, sulphate can be injected into the stratosphere. This yields an enhanced absorption of solar and surface radiation and provokes a net stratospheric heating that in turn results in a net surface cooling. This effect was clearly observed following the Pinatubo eruption in 1991, which cooled lower troposphere temperatures globally by approximately 0.5°C (Dutton and Christy 2012). This cool anomaly lasted up to several years, linked to the lifetime of sulphate aerosols in the stratosphere.
Analysis of historical archives and sulphate deposited on ice-sheets enables us to reconstruct the history of large explosive volcanic eruptions. Volcanic forcing scenarios covering the last 10 kyr were developed to be utilized in climate models, expressed here as radiative impact (Total Solar Irradiance, TSI). The Mt. Tambora eruption in 1815, the largest of the last millennium, had an estimated TSI equivalent impact of 12 W m-2 and large eruptions in the Holocene may have had a magnitude many times greater than that, although the precise number is still uncertain (Mairesse 2014).
 |
|
Figure 2: Global annual mean temperature difference between the simulation with and without volcanism. Gray curve is the unfiltered simulation. Also shown are temperature filtered by a running mean of 101 (red), 251 (blue), 501 (green) and 1001 (pink) years. Note that the vertical scale does not show the whole range of extreme values. The strongest annual global cooling was 6°C (in 6500 BC). |
Using a newly developed volcanic forcing scenario, Mairesse (2014) performed transient fully coupled climate simulations with the LOVECLIM model over the last 10 kyr, with and without including the radiative effect of volcanoes. This enables the impact of large eruptions on Earth's global mean temperature to be analyzed (Fig. 2). The results show a significant (> 0.1 °C) imprint of volcanic eruptions on the simulated global climate. Medium-sized eruptions (injections of ~50 Tg of sulfate) result in recurrent coolings of 0.1 to 0.2°C at the centennial scale. The maximum effect for individual years is much larger but the exact magnitude of the response is still uncertain as the radiative impact of very large eruptions does probably not scale linearly with the sulphate emissions. Without further information, it remains difficult for now to reach a consensus on how to improve the forcing.
Outlook
The reported model experiments suggest that both volcanism and freshwater forcing have a significant impact at the century scale on the Earth's climate during the Holocene. There is a need, however, to refine the relationship between the TSI forcing and the sulfate injections for very large eruptions, since there is no analogue in the instrumental era.
The feedback from human activities on the melting of the Greenland ice-sheet may yield increased freshwater fluxes to the ocean over the course of this century. The strength of the fluxes can in principle be influenced by mitigation measures. While the rate and occurrence of disruptive volcanic eruptions is beyond human control, a risk assessment of their magnitudes and impacts may be useful for planning disaster prevention.
|
Model |
Atmospheric Resolution |
Oceanic Resolution |
Ice-sheet forcing |
pCO2 level |
Meltwater flux |
|
CCSM3 |
T42 (~2.8×2.8°), 26 levels |
1x1°, 40 levels |
Yes/No |
260 ppm |
No/0.05Sv |
|
GISS ModelE-R |
M20 (4×5°), 20 levels |
4x5°, 13 levels |
No |
285 ppm |
No |
|
LOVECLIM1.2 |
T21 (5.625×5.625°), 3 levels |
3x3°, 20 levels |
Yes |
260 ppm |
0.05Sv |
Box 1: Model simulation characteristics. CCSM3 includes two simulations, one with and one without ice-sheet forcing (topography and albedo changes).
affiliations
1Department of Earth Sciences, VU University of Amsterdam, The Netherlands
2Laboratoire des Sciences du Climat et de l’Environnement (LSCE), Gif-sur-Yvette Cedex, France
3Cooperative Institute for Research in Environmental Sciences, University of Colorado, Boulder, USA
4NOAA’s National Climatic Data Center, Boulder, USA
5Georges Lemaître Centre for Earth and Climate Research, Université catholique de Louvain, Louvain-la-Neuve, Belgium
contact
Didier Roche: didier.rochelsce.ipsl.fr
references
Alley RB et al. (1997) Geology 25: 483-486
Barber DC et al. (1999) Nature 400: 344-348
Cheng W et al. (2013) J Clim 26: 7187-7197
Dutton EG, Christy JR (2012) Geophys Res Lett 19: 2313-2316
Johnsen SJ et al. (1992) Nature 359: 311–313
Kleiven HKF et al. (2008) Science 319: 60-64
LeGrande AN et al. (2006) PNAS 103: 837-842
Mairesse A (2014) Analysis of the Holocene climate variability using a data assimilation method applied to the model LOVECLIM, PhD Thesis
Hubertus Fischer1, J. Schmitt1, S. Eggleston1, R. Schneider1, J. Elsig1, F. Joos1, M. Leuenberger1, T.F. Stocker1, P. Köhler2, V. Brovkin3 and J. Chappellaz4
High-precision ice core data on both atmospheric CO2 concentrations and their carbon isotopic composition (δ13Catm) provide improved constraints on the marine and terrestrial processes responsible for carbon cycle changes during the last two interglacials and the preceding glacial/interglacial transitions.
 |
|
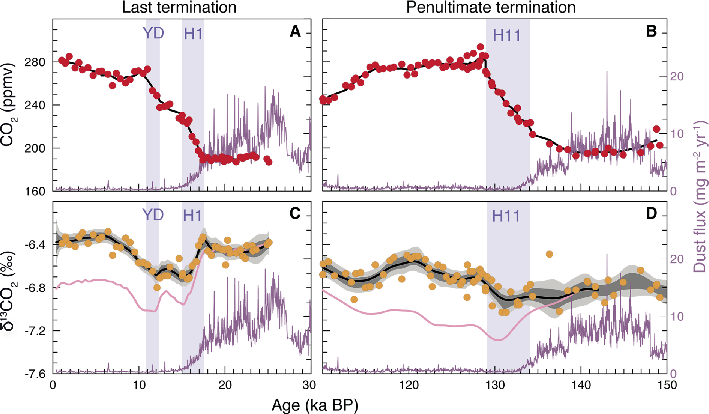
Figure 1: Evolution of atmospheric CO2 (red dots), δ13CO2 (orange dots), and dust flux (purple line) over the last two glacial/interglacial transitions and the subsequent interglacial periods. All measurements were performed on the EPICA Dome C ice core. The dark and light grey shaded fields represent the 1σ and 2σ errors of a Monte Carlo spline average of the δ13CO2 (black line; Schmitt et al. 2012; Schneider et al. 2013). The pink line indicates the δ13Catm spline after a first order correction for global sea surface temperature changes. High-resolution eolian dust fluxes (purple line; Lambert et al. 2012) provide a measure for Southern Ocean Fe fertilization. YD =Younger Dryas, H = Heinrich events. |
CO2 represents the most important greenhouse gas released into the atmosphere as a result of human activity. The majority of our knowledge on the increase in CO2 since the start of the industrialization comes from ice cores, which complement the direct atmospheric CO2 measurements obtained at Mauna Loa since the 1950s. The combined CO2 record shows an unambiguous anthropogenic CO2 increase over the last 150 years from 280 to about 400 ppm in 2014. Values above 300 ppm are unprecedented in the long-term ice core record covering the last 800,000 years with natural CO2 concentrations varying between interglacial and glacial bounds of about 280 and 180 ppm, respectively (Fig. 1; Lüthi et al. 2008; Petit et al. 1999). The record also showed that even during rather stable interglacial conditions, CO2 concentrations changed in response to long-term carbon cycle changes (Elsig et al. 2009). Although past atmospheric CO2 concentrations are known with high precision, the causes of the preindustrial CO2 changes cannot be easily attributed to individual processes. Substantial progress could come from better estimates of past changes in the carbon stored by the biosphere or from using stable carbon isotopes to constrain sources and sinks of carbon and exchange processes with the atmosphere.
The vast majority of the carbon cycling in the Earth system on multi-millennial timescales resides in the ocean. Accordingly, the global δ13C of inorganic carbon dissolved in seawater (δ13CDIC) may provide the best constraint on past carbon cycle changes. However, a global compilation of δ13CDIC from marine sediment records is hampered by insufficient spatial representation of vast ocean regions, the limited temporal resolution of many sediment records, and substantial chronologic uncertainties. The alternative, to reconstruct the mean δ13C record of the well-mixed atmosphere (δ13Catm) from the fossil air contained in Antarctic ice cores, has been a long-standing quest. Latest analytical progress that improved the measurement error while at the same time cutting down sample size by an order of magnitude has allowed us to gain this information from ice cores with the required precision and temporal resolution.
The enigma of glacial/interglacial CO2 changes
The cause of the glacial/interglacial 80-100 ppm increase of atmospheric CO2 represents a long-standing question in paleoclimate research. Several processes have been implied. These include Southern Ocean ventilation by wind or buoyancy feedbacks, iron fertilization of the marine biosphere in the Southern Ocean, changes in the re-mineralization depth of organic carbon, release of permafrost carbon during the deglaciation, decreased solubility due to ocean warming, changes in air/sea gas exchange due to changing sea ice cover, climate-induced changes in weathering changes rates, and marine carbonate feedbacks (Ciais et al. 2012; Fischer et al. 2010; Köhler and Fischer 2006; Menviel et al. 2012). However, none of these processes alone is able to explain the glacial/interglacial CO2 change.
 |
|
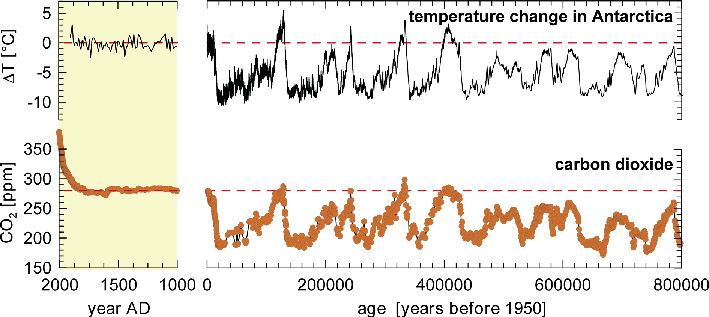
Figure 2: Right: Antarctic temperature and CO2 variations over the last 800,000 years. Ice sheet surface temperature change was calculated from δD measured on the EPICA ice core from Dome C (EPICA community members 2004), CO2 concentrations were measured on the Antarctic Dome C and Vostok ice cores (Lüthi et al. 2008; Petit et al. 1999). Left: Blow up of Antarctic temperature (EPICA community members 2004) and CO2 concentration changes (MacFarling Meure et al. 2006) over the last 1000 years. |
Our new δ13Catm data from the air trapped in the Antarctic EPICA Dome C ice core, provide improved constraints to revisit the enigma of deglacial CO2 increase (Fig. 2). Mean δ13Catm levels during peak glacials and interglacials were not much different, despite different CO2 concentrations and the substantially altered climate system. This implies that the δ13Catm record is the sum of several factors that balance each other to a large extent. For example, just considering the sea surface temperature-dependent fractionation of CO2 between the atmosphere and the ocean surface, approximately 0.4‰ lower δ13Catm values are expected for interglacials (Fig. 2).
Our δ13Catm data (Lourantou et al. 2010; Schmitt et al. 2012) from the last two major deglaciations suggest a sequence of processes that drove atmospheric CO2 changes during different stages of the transition from glacial conditions into a milder interglacial world.
• At the start of the transitions, upwelling of old 13C-depleted waters in the Southern Ocean increased the release of CO2 to the atmosphere. This process was likely synchronous with a demise in iron-stimulated bioproductivity in the Southern Ocean, when atmospheric dust concentrations declined rapidly.
• This was followed by the gradual growth of terrestrial carbon storage in vegetation, soil, and peatlands as evidenced by the slow δ13Catm increase. This process reached well into the subsequent interglacials. Termination I was special in that it was interrupted by another upwelling event synchronous to the Younger Dryas in the Northern Hemisphere.
The Holocene - natural changes or early anthropogenic influence?
The Holocene is often described as a rather stable period in climate history. Nevertheless, from 7 ka BP to the preindustrial era the CO2 concentration increased by ~20 ppm, i.e. by a quarter of the glacial/interglacial change. Such a CO2 increase is not found during the preceding three interglacials (Marine Isotope Stage (MIS) 5.5, 7.5 or 9.3), although increases at similar rates can be found in MIS 11.3 or 15.5. This gave rise to the hypothesis that the Holocene CO2 increase may be unique and was caused by early anthropogenic land use (Ruddiman 2003). However, an anthropogenic release of isotopically light terrestrial carbon would lead to a decrease in δ13Catm over the last 7000 years, which is not observed in our record (Fig. 2; Elsig et al. 2009). The expected anthropogenic δ13Catm decline could in principle have been compensated by a concurrent natural build-up of peat at higher latitudes, but in that case atmospheric CO2 should not have increased. In any case, a substantial early human influence on atmospheric CO2 is difficult to reconcile with the ice core evidence. Based on terrestrial carbon cycle model results (Stocker et al. 2011), anthropogenic land-use is also unlikely to have released sufficient carbon during the last 7000 years to explain the 20 ppm CO2 increase.
However, the carbon cycle may not only be altered by terrestrial processes during the Holocene, but also has a long-term ocean memory. The long-term carbonate compensation feedback (the re-equilibration of carbonate chemistry in the ocean) to carbon cycle changes occurring in the preceding deglaciation and enhanced shallow-water carbonate sedimentation during the Holocene due to sea level rise are acting on multi-millennial time scales and lead to a delayed increase in atmospheric CO2 as observed in the ice core record without changing δ13Catm (Elsig et al. 2009; Kleinen et al. 2010; Menviel and Joos 2012).
If so, why is there no similar CO2 increase observed during MIS 5.5? Explanations probably lie in the individual configuration of orbital forcing of each interglacial but also in the preceding deglacial history. For example the unique Younger Dryas event during Termination I may have disturbed the deglacial carbon cycle re-adjustment.
Outlook
The examples shown from the last two glacial-interglacial transitions demonstrate the value of high-quality δ13Catm data from Antarctic ice cores. However, maximum insight into the past carbon cycle can only be gained from joint atmospheric, terrestrial, and marine carbon cycle information in combination with coupled carbon cycle models. A stringent test for our carbon cycle understanding will be a future “Oldest Ice” ice core covering the last 1.5 Ma, which would provide the history of CO2 and δ13Catm over the mid-Pleistocene Revolution, when the glacial/interglacial cyclicity changed from a 40,000 year period driven by obliquity changes of the Earth’s axis to the well-known 100,000 year cycles in the later Quaternary.
affiliations
1Climate and Environmental Physics, Physics Institute and Oeschger Centre for Climate Change Research, University of Bern, Switzerland
2Alfred Wegener Institute, Helmholtz Centre for Polar and Marine Research, Bremerhaven, Germany
3Max Planck Institute for Meteorology, Hamburg, Germany
4UJF–Grenoble 1/CNRS, Laboratoire de Glaciologie et Géophysique de l’Environnement (LGGE), Grenoble, France
contact
Hubertus Fischer: hubertus.fischerclimate.unibe.ch
references
Ciais P et al. (2012) Nat Geosci 5: 74-79
Elsig J et al. (2009) Nature 461: 507-510
EPICA community members (2004) Nature 429: 623-628
Kleinen T et al. (2010) Geophys Res Lett 37, doi:10.1029/2009GL041391
Lambert F et al. (2012) Clim Past 8: 609-623
Lourantou A et al. (2010) Global Biogeochem Cycles 24, doi:10.1029/2009GB003545
Lüthi D et al. (2008) Nature 453: 379-382
MacFarling Meure C et al. (2006) Geophys Res Lett 33, doi:10.1029/2006GL026152
Menviel L, Joos F (2012) Paleoceanography 27, doi:10.1029/2011PA002224
Menviel L et al. (2012) Quat Sci Rev 56: 46-68
Petit JR et al. (1999) Nature 399: 429-436
Ruddiman WF (2003) Climatic Change 61: 261-293
Schmitt J et al. (2012) Science 336: 711-714
Natalie Kehrwald1, P. Zennaro1,2, S. Schüpbach3, T. Kirchgeorg1, J. R. McConnell4, R. Zangrando2, A. Gambaro1, and C. Barbante1,2,5
New data from Greenland ice cores reveal a major peak in boreal biomass burning during the 1600s AD, presumably related to major regional droughts in Central Asia. This climate-related peak in fire activity is greater even than post-industrial biomass burning.
Fires ignited by humans to manage the landscape may have started altering atmospheric greenhouse gas concentrations and warming the planet thousands of years ago (Ruddiman 2003). Today, biomass burning produces up to 50% as much carbon dioxide as fossil fuel burning (Bowman et al., 2009) while at the same time shrinking an important carbon sink.
Polar ice cores present a unique medium to quantitatively investigate past biomass burning at the global scale because they trap and archive fire-related aerosols before and after humans began influencing the global carbon cycle.
 |
|
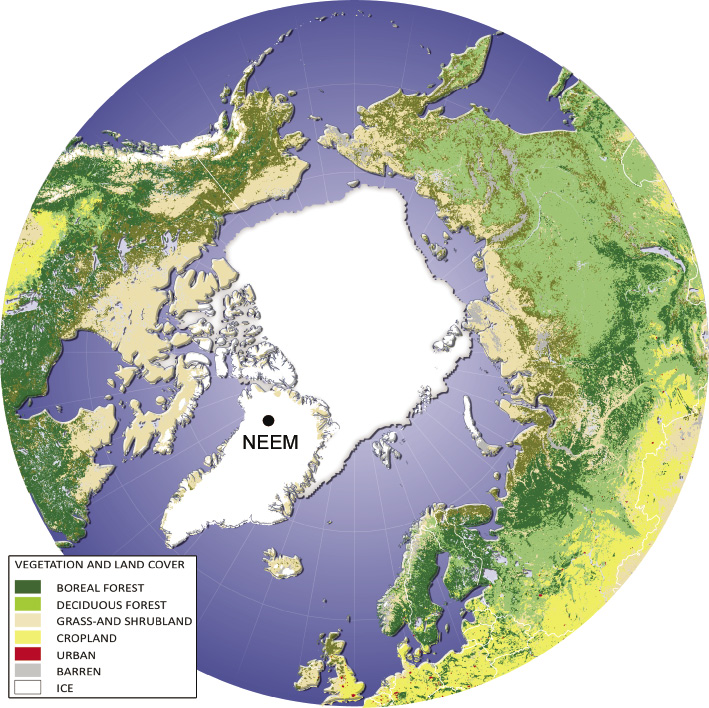
Figure 1: Distribution of the high northern latitude land cover and location of the NEEM ice core drilling site at 77.49°N, 51.2°W, 2480 m above sea level. Modified from the European Commission Global Land Cover 2000 database and based on the work of cartographer Hugo Alhenius UNEP/GRIP-Arendal. |
Here, we synthesize information from three geochemical fire activity proxies, i.e. levoglucosan, black carbon, and ammonium measured in the NEEM and NEEM-2011-S1 ice cores from Greenland (Fig. 1) to investigate interactions between Northern Hemisphere fire activity, climate, and possible human influences in boreal regions over the last 2000 years.
Fire proxies in ice cores
Several tracers of past biomass burning can be measured in polar ice cores. Aerosols are transported in smoke plumes from Eurasia and North America over thousands of kilometers. Some of the aerosols are transported all the way to Greenland, deposited there and trapped within the ice sheet (Kehrwald et al. 2012; Zennaro et al. 2014). Ammonium is a tracer of biomass burning, especially in boreal regions (e.g. Legrand et al. 1992), but also enters the atmosphere through interactions with fertilizers, manure, and marine sources. Black carbon is a more specific proxy as it is produced by the incomplete combustion of both biomass and fossil fuels (McConnell et al. 2007). Both black carbon and ammonium can be determined using high-resolution continuous flow analysis techniques (CFA; Zennaro et al. 2014). Fire information is also inferred from the isotopic composition of methane (CH4). The δ13C of CH4 is enriched if it was produced by a pyrogenic process compared to biogenic sources including rice cultivation, ruminants or wetlands (Sapart et al., 2012) Note, however, that due to methane’s atmospheric lifetime of several decades, the δ13C of CH4 is a global mixture from sources with different isotopic signatures (Sapart et al. 2012). Finally, levoglucosan, a monosaccharide anhydride, has strong potential for tracing broad-scale fire activity. It is only produced by burning cellulose at temperatures of 300°C or higher (Simoneit 2002) and represents one of the principal constituents of smoke plumes. Levoglucosan is currently only determined in discrete samples, resulting in lower-resolution records than parameters analyzed by CFA techniques.
Our study acknowledges both the strength and the weaknesses inherent in most ice core fire proxies and remedies the latter by integrating the results from ammonium, black carbon, and levoglucosan records from the NEEM ice cores over the past 2000 years (Zennaro et al. 2014).
Boreal biomass burning and climate
 |
|
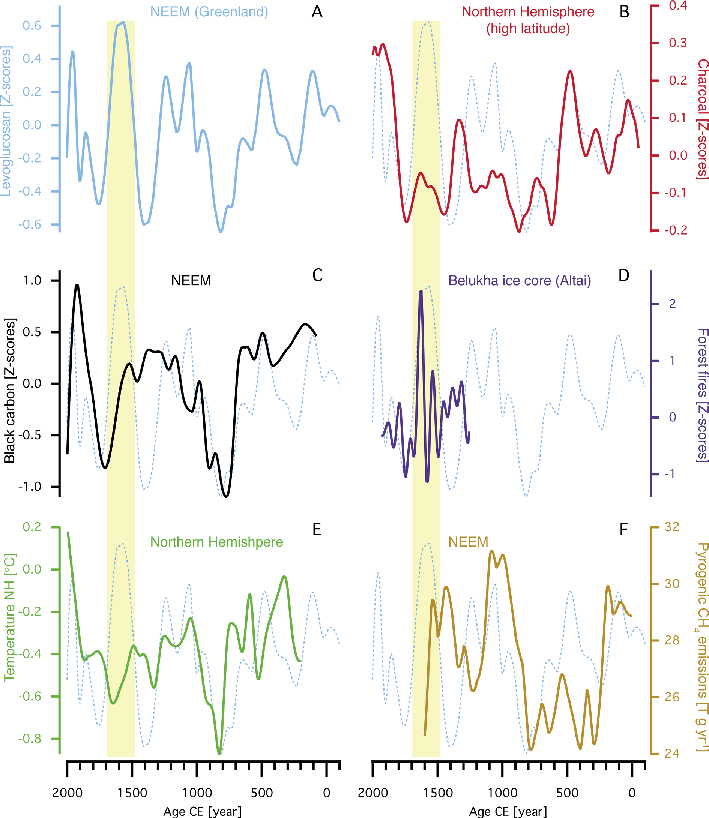
Figure 2: Climatic and environmental records over the past 2000 years, presented as z-scores smoothed by incorporating the nearest 10% of data. (A) NEEM levoglucosan concentrations; (B) Boreal charcoal concentrations (Marlon et al. 2008); (C) NEEM black carbon versus levoglucosan concentrations; (D) Siberian forest fire reconstruction (Eichler et al. 2011); (E) Northern Hemisphere land temperature (Mann et al. 2008); (F) NEEM pyrogenic CH4 emissions (Sapart et al. 2012). Dashed blue lines in panels B-F are the levoglucosan record from A for reference. The yellow vertical bar marks the levoglucosan-based 17th century fire activity maximum highlighted in the text. |
Fires are individual events lasting hours to weeks, yet droughts, increased temperatures, or land use changes can increase net fire activity over years to centuries. We compare our records with other biomass burning and climate reconstitutions from elsewhere to locate the geographical extent of the fire activity reconstructed from the NEEM ice cores and to investigate their driving factors. To all of the records we applied a locally-weighted scatterplot smoothing (LOWESS, details on the statistical method in Zennaro et al. 2014) and normalized all data as z-scores to ease the comparison between the different records (Fig. 2).
The NEEM levoglucosan record peaks over a century-long period, centered on 1640 AD (Fig. 2). Although less prominent, high values around that time also exist in the NEEM black carbon records (Fig. 2). A regional average record of northern high latitude (>55°N) charcoal data from the Global Charcoal Database of the Global Palaeofire Working Group (www.gpwg.org) shows similar trends to the levoglucosan record throughout most of the last two thousand years, with the interesting exception of low charcoal values during the 1640 AD levoglucosan peak (Fig. 2). However, the majority of the boreal charcoal data are located in North America, thus geographically weighting the resulting synopsis. This could explain the observed difference between the levoglucosan and hemispheric charcoal record syntheses during this time period.
Tree-ring, speleothem, and alpine ice core data (e.g. from the Belukha ice core in Mongolia) demonstrate widespread, decadal-scale droughts over most of Central Asia coincident with major fire peaks in the NEEM ice core (Zennaro et al. 2014). These Central Asian droughts, and associated fire activity peaks, do not correspond with either increased regional or Northern Hemisphere land temperatures (Fig. 2). Therefore, over decadal timescales, we propose that precipitation changes may be an important fire-controlling factor. Except during the 1640 AD fire peak, the resemblance observed between the NEEM levoglucosan, black carbon, and Northern Hemisphere temperature reconstructions suggests that temperature might be the major control of boreal biomass burning over centennial timescales.
Conclusions
Our multi-proxy (levoglucosan, black carbon, and ammonium) reconstruction of fire activity based on the NEEM ice cores suggests that temperature was the main control on boreal fire activity over the past two thousand years, while major droughts influenced biomass burning over decadal timescales. Our dataset suggests a peak in fire activity in the mid-1600s, which coincides with the most severe Central Asian droughts of the past two millennia. This fire activity peak is higher than any biomass burning recorded at NEEM after the Industrial Revolution, when land-clearing rates were the highest in recorded history. Therefore, this dominance of the 1640 AD fire peak suggests that climate affected boreal biomass burning more than human activity over the past two thousand years.
acknowledgements
The research leading to these results received funding from the European Union’s Seventh Framework programme (FP7/2007-2013) under grant agreement no. 243908, grant agreement no. 267696, and the U.S. National Science Foundation award no. 0909541.
affiliations
1Department of Environmental Science, Informatics and Statistics, Cà Foscari University of Venice, Italy
2IDPA-CNR, Venice, Italy
3Climate and Environmental Physics, Physics Institute and Oeschger Centre for Climate Change Research, University of Bern, Switzerland
4Desert Research Institute, Department of Hydrologic Sciences, Reno, USA
5Centro B. Segre, Accademia Nazionale dei Lincei, Rome, Italy
contact
Natalie Kehrwald: Kehrwaldunive.it
references
Bowman et al. (2009) Science 324: 481-484
Eichler A et al. (2011) Quat Sci Rev 30: 1027–1034
Holmes BJ, Petrucci GA (2007) J Atmos Chem 58: 151-166
Kehrwald N et al. (2012) Tellus B 64: 18196
Kirchgeorg T et al. (2014) Org Geochem 71: 1-6
Legrand M et al. (1992) Geophys Res Lett 19: 473-475
Mann et al. (2008) PNAS 105: 13252-13257
Marlon et al. (2008) Nat Geosci 1: 697–702
McConnell JR et al. (2007) Science 317: 1381-1384
Ruddiman WF (2003) Clim Change 61: 261-293
Sapart C et al. (2012) Nature 490: 85-88
Savarino J, Legrand M (1998) J Geophys Res Atmos 103: 8267–8279